. 2025 Feb;47(1):809-823.
doi: 10.1007/s11357-024-01269-y. Epub 2024 Jul 22.

Cognitive rejuvenation in old rats by hippocampal OSKM gene therapy

Affiliations

Cognitive rejuvenation in old rats by hippocampal OSKM gene therapy

Steve Horvath et al. Geroscience. 2025 Feb.

Abstract

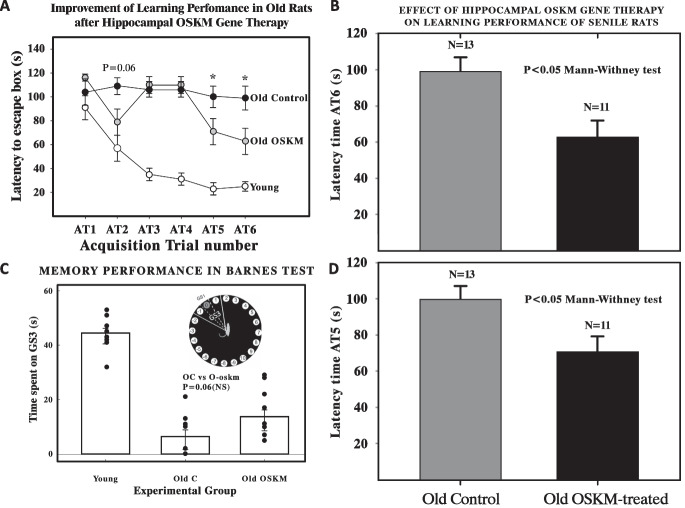
Several studies have indicated that interrupted epigenetic reprogramming using Yamanaka transcription factors (OSKM) can rejuvenate cells from old laboratory animals and humans. However, the potential of OSKM-induced rejuvenation in brain tissue has been less explored. Here, we aimed to restore cognitive performance in 25.3-month-old female Sprague-Dawley rats using OSKM gene therapy for 39 days. Their progress was then compared with the cognitive performance of untreated 3.5-month-old rats as well as old control rats treated with a placebo adenovector. The Barnes maze test, used to assess cognitive performance, demonstrated enhanced cognitive abilities in old rats treated with OSKM compared to old control animals. In the treated old rats, there was a noticeable trend towards improved spatial memory relative to the old controls. Further, OSKM gene expression did not lead to any pathological alterations within the 39 days. Analysis of DNA methylation following OSKM treatment yielded three insights. First, epigenetic clocks for rats suggested a marginally significant epigenetic rejuvenation. Second, chromatin state analysis revealed that OSKM treatment rejuvenated the methylome of the hippocampus. Third, an epigenome-wide association analysis indicated that OSKM expression in the hippocampus of old rats partially reversed the age-related increase in methylation. In summary, the administration of Yamanaka genes via viral vectors rejuvenates the functional capabilities and the epigenetic landscape of the rat hippocampus.

Keywords: Epigenetic age; Hippocampal aging; OSKM gene therapy; OSKM-induced demethylation; Rejuvenation; Spatial memory.


Conflict of interest statement

Declarations. Competing interest: Steve Horvath is a founder of the non-profit Epigenetic Clock Development Foundation which licenses several patents surrounding methylation measurements and epigenetic clock testing from his former employer UC Regents. These patents list SH as inventor. Robert T. Brooke is a founder and CEO of the Clock foundation. SH is an employee of Altos Labs Inc, UK. The other authors declare no conflicts of interest.

Figures

Fig. 1
Fig. 1
Effect of OSKM genes on learning performance and spatial memory in old rats. A The Barnes memory test begins with Acquisition Training, comprising six sessions (acquisition trials or AT). In each AT, a rat is placed at the Barnes platform's center and has 120 s to locate an escape box hidden under one of 20 peripheral holes. B, D Bar plots show the mean latency time and two standard errors (y-axis) in old controls and old treated rats at AT5 and AT6. Old-treated rats show a significant reduction (Mann-Whitney test two-sided P < 0.05) in latency time at AT5 (panel B) and AT6 (panel D) as compared with old controls. Individual data points are reported in Supplementary Table S1. C Spatial memory performance in the Barnes test, focusing on the duration rats spend exploring holes − 1, 0, and + 1 in the GS3 sector when the escape box is absent from hole 0. There is a marked fall in spatial memory between young (N = 11) and old rats (N = 9) but the OSKM treated old rats (N = 11) show only a trend (two-sided P = 0.06, one-sided P = 0.03) towards an improvement as compared with old control animals. The inset shows a diagram of the Barnes platform delineating the GS3 sector
Fig. 2
Fig. 2
OSKM-GFP expression in the rat hippocampus. A The arrow indicates the region of the dentate gyrus in the hippocampus where the OSKM-GFP adenovector was administered. The figure corresponds to Fig. 60 from the Paxinos atlas [33]. In each panel, the GFP signal is consistently localized to the dentate gyrus region of the hippocampus. B, C, D display GFP fluorescence at various time points following vector injection: B 7 days post-injection (PI-7), C 14 days post-injection (PI-14), and D 30 days post-injection (PI-30). Objective: 4× magnification. Scale bars are the same across all panels and are displayed only in the three panels labeled E. Four control animals were used in this study. Abbreviations, alv, alveous of the hippocampus; cg, cingulum. E Expression of Sox2, KLF4, and GFP in the dentate gyrus of OSKM-GFP adenovector-injected rats. The three panels, from left to right, show expression of Sox2, Oct4, and GFP in the dentate gyrus (DG), 21 days after adenovector injection. The inset shows a hippocampal cell expressing Klf4 and GFP fluorescence. Five treated rats were assessed. Control rats injected with the RAd-GFP placebo vector showed, as expected, the same distribution of GFP expression in the hippocampus. Scale bars indicate the corresponding magnification
Fig. 3
Fig. 3
Impact of aging and OSKM gene therapy on the dentate gyrus (DG) granule cell layer. The left bar plot quantifies doublecortin (DCX) positive neurons in the DG of young (N = 6 rats), old control (N = 5 rats), and old OSKM-treated (N = 5 rats) groups. “Old control” refers to aged rats administered with the GFP vector as a control. To the right, we exhibit the comparative decline of DCX neuron counts in aged rats, underscoring the significant decrease attributed to aging. Additionally, no substantial change in the number of DCX neurons was observed in the hippocampus of the old rats following 39 days of OSKM vector treatment. The right-side panels also confirm the absence of pathological changes in the hippocampal tissue of the old rats treated with OSKM for 39 days. Neurons expressing doublecortin (DCX) are identified by their brown labeling. The blue background results from counterstaining with cresyl violet
Fig. 4
Fig. 4
Epigenetic clock analysis of OSKM gene therapy in the rat hippocampus. The columns correspond to three epigenetic clocks: A, D Brain clock for rats (units of years). B, E Human–rat dual species pan tissue clock which estimates relative age (defined as ratio of age divided by maximum species lifespan). C, F Brain clock for mice estimates chronological age (units of years). A, B, and C present scatter plots with data points color-coded according to the sample condition: brown represents young samples (N = 6), blue old samples treated with OSKM (N = 8), and turquoise old control samples (N = 6). The old controls were always infected with the GFP vector. The bar plots in panels D, E, F depict the average DNAm age estimate with error bars representing one standard error from the mean. Gray numerals atop each bar denote the count of DNA samples for each group. The heading of each panel displays the calculated two-sided Student’s t-test p-value. The rat clocks are described in [15]. The mouse clocks for brain samples is described [16]. G, H Chromatin state analysis of OSKM rejuvenation (y-axis) versus aging effects (x-axis). Each point depicted here represents a Z-score, derived from the trimmed mean methylation levels of a specific chromatin state (as displayed on the y-axis). The chromatin states are defined in accordance with [19]. G The axis significance of aging effects in all rat tissues. H The x-axis significance for age effects throughout all rat tissues, as per the Mammalian Methylation Consortium’s meta-analysis correlation test Z-statistic across various rat tissues. I Aging effects on chromatin states in all rat tissues (x-axis) versus aging effects in the rat hippocampus (y-axis)
Fig. 5
Fig. 5
EWAS analysis of OSKM effects vs. age-related methylation in rat hippocampus. A Manhattan plots showing EWAS results for chronological age (left) and OSKM treatment effects (right). Genome coordinates are based on the Rattus norvegicus (Rnor_6.0.101). CpGs with P < 0.01 are highlighted: red (increased methylation) and blue (decreased methylation). Top 15 CpGs are labeled with adjacent genes. B Scatter plots of Z-scores for EWAS of age (x-axis) vs. OSKM treatment (y-axis). Null hypothesis Z-statistic follows a standard normal distribution. Red and blue lines: nominal two-sided p-values (0.01 and 0.05). Red dots: CpGs whose methylation levels were aggravated/aged by OSKM; blue dots: CpGs rescued/rejuvenated. Top CpGs labeled with adjacent genes. C Venn diagram showing overlap of age-associated CpGs with OSKM effects in the hippocampus. CpGs either rejuvenated or aged by OSKM are in the intersection. D Location of top CpGs relative to transcriptional start sites, with odds ratios and Fisher exact p-values (*p < 0.05, **p < 0.01, ***p < 0.001, ****p < 0.0001). E Box plots of EWAS Z-statistics vs. CpG island status. Box plots show 25th and 75th percentiles, median line, and 90% whiskers. Student’s t-test p-values reported. F Enrichment of chromatin states for EWAS hits based on StackHMM states in humans [48]. Nominal two-sided p-values from hypergeometric tests. PRC2 state based on binding of polycomb repressor complex 2 components (EED, SUZ12, EZH2). G Gene set enrichment analysis of top 500 EWAS hits (with p < 0.05 per CpG) per methylation direction. Analysis done using GREAT [49] with human Hg19 background and CpGs aligned to the rat genome. Enrichment for gene ontology, mouse phenotypes, promoter motifs, and MsigDB Perturbation terms with nominal p < 10−4 and minimum overlap of three genes

References

    1. Fischer W, Chen KS, Gage FH, Björklund A. Progressive decline in spatial learning and integrity of forebrain cholinergic neurons in rats during aging. Neurobiol Aging. 1992;13:9–23. - PubMed
    1. Sugaya K, et al. Molecular indices of neuronal and glial plasticity in the hippocampal formation in a rodent model of age-induced spatial learning impairment. J Neurosci. 1996;16:3427–43. - PMC - PubMed
    1. Morel GR, et al. Cognitive impairment and morphological changes in the dorsal hippocampus of very old female rats. Neuroscience. 2015;303:189–99. 10.1016/j.neuroscience.2015.06.050. - PMC - PubMed
    1. Blalock EM, et al. Gene microarrays in hippocampal aging: statistical profiling identifies novel processes correlated with cognitive impairment. J Neurosci. 2003;23:3807–19. - PMC - PubMed
    1. Burger C, et al. Changes in transcription within the CA1 field of the hippocampus are associated with age-related spatial learning impairments. Neurobiol Learn Mem. 2007;87:21–41. - PubMed

Substances

LinkOut - more resources