. 2024 Oct 1;19(10):1240-1252.
doi: 10.2215/CJN.0000000000000510. Epub 2024 Jul 22.

Association between Chronic Kidney Disease-Mineral and Bone Disorder Biomarkers and Symptom Burden in Older Patients with Advanced Chronic Kidney Disease: Results from the EQUAL Study

Collaborators, Affiliations

Association between Chronic Kidney Disease-Mineral and Bone Disorder Biomarkers and Symptom Burden in Older Patients with Advanced Chronic Kidney Disease: Results from the EQUAL Study

Lorenza Magagnoli et al. Clin J Am Soc Nephrol. .

Abstract

Key Points:

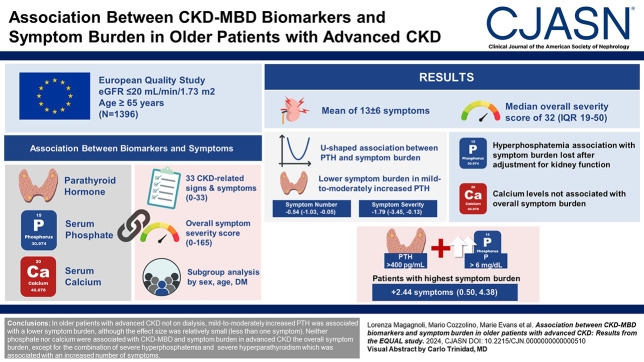
  1. In nondialysis patients with advanced CKD, mild-to-moderately increased parathyroid hormone is associated with lower levels of reported symptoms.

  2. Phosphate and calcium are not independently associated with overall symptom burden.

  3. Patients with both severe hyperphosphatemia and severe hyperparathyroidism had the highest symptom burden.

Background: Patients with advanced CKD develop numerous symptoms, with a multifactorial origin. Evidence linking mineral disorders (CKD-Mineral and Bone Disorder) and uremic symptoms is scant and mostly limited to dialysis patients. Here, we aim to assess the association between CKD-Mineral and Bone Disorder and symptom burden in nondialysis patients with CKD.

Methods: We used data from the European Quality study, which includes patients aged ≥65 years with eGFR ≤20 ml/min per 1.73 m2 from six European countries, followed up to 5 years. We used generalized linear mixed-effect models to determine the association between repeated measurements of parathyroid hormone (PTH), phosphate, and calcium with the overall symptom number (0–33), the overall symptom severity (0–165), and the presence of 33 CKD-related symptoms. We also analyzed subgroups by sex, age, and diabetes mellitus and assessed effect mediation and joint effects between mineral biomarkers.

Results: The 1396 patients included in the study had a mean of 13±6 symptoms at baseline, with a median overall severity score of 32 (interquartile range, 19–50). The association between PTH levels and symptom burden appeared U-shaped with a lower symptom burden found for mild-to-moderately increased PTH levels. Phosphate and calcium were not independently associated with overall symptom burden. The highest symptom burden was found in patients with a combination of both severe hyperparathyroidism and severe hyperphosphatemia (+2.44 symptoms [0.50–4.38], P = 0.01). The association of both hypocalcemia and hyperphosphatemia with symptom burden seemed to differ by sex and age.

Conclusions: In older patients with advanced CKD not on dialysis, mild-to-moderately increased PTH was associated with a lower symptom burden, although the effect size was relatively small (less than one symptom). Neither phosphate nor calcium were associated with the overall symptom burden, except for the combination of severe hyperphosphatemia and severe hyperparathyroidism which was associated with an increased number of symptoms.


Conflict of interest statement

Disclosure forms, as provided by each author, are available with the online version of the article at http://links.lww.com/CJN/B980.

Figures

None
Graphical abstract
Figure 1
Figure 1
Flow diagram of patient selection. CKD-MBD, CKD-mineral and bone disorder; EQUAL, European Quality.
Figure 2
Figure 2
Prevalence of all symptoms at baseline. The bar plot represents the proportion of patients who reported each symptom at baseline. The gray color scale represents the severity of each symptom reported. Symptoms are divided in groups (by color).
Figure 3
Figure 3
Associations between mineral biomarkers and overall symptom burden. In each column, the bar plot at the bottom represents the number of measurements of each biomarker in categories; the top and central forest plots represent the association between the biomarker and the overall symptom number and the overall symptom severity, respectively. Numbers reported in the forest plots represent the median symptom number and severity in the reference category. The model represented consists of a GLMM using random intercept for individuals, clustered by countries, adjusted for age, sex, baseline CCI, eGFR, urea, albumin, hemoglobin, and baseline medications (vitamin D, phosphate binders and calcimimetics). Conversion factors for units: PTH in pg/ml to pmol/L, ×0.106; phosphate in mg/dl to mmol/L, ×0.323; calcium in mg/dl to mmol/L, ×0.250. CCI, Charlson Comorbidity Index; GLMM, generalized linear mixed-effect model; PTH, parathyroid hormone.
Figure 4
Figure 4
Associations between mineral biomarkers and all symptoms. Heatmap representing the association between each biomarker category and the probability of having each symptom, reported as OR in each cell. All models are GLMMs using random intercepts for individuals, clustered by countries, adjusted for age, sex, baseline CCI, and eGFR. Other confounders were used for each specific outcome, as appropriate: urea, albumin, hemoglobin for general and musculoskeletal symptoms; urea, albumin, and baseline medications for gastrointestinal symptoms; albumin and hemoglobin for cardio-pulmonary symptoms; urea and baseline medications for skin and mucosal disorders; urea and hemoglobin for neurological symptoms; hemoglobin for sexual disorders. After adjustment for multiple testing none of these associations remained statistically significant. Conversion factors for units: PTH in pg/ml to pmol/L, ×0.106; phosphate in mg/dl to mmol/L, ×0.323; calcium in mg/dl to mmol/L, ×0.250. CCI, Charlson Comorbidity Index; GLMM, generalized linear mixed-effect model; OR, odds ratio; PTH, parathyroid hormone.
Figure 5
Figure 5
Associations between mineral biomarkers and overall symptom burden in subgroups based on sex and age. (A) Shows the association between different categories of PTH (left), phosphorus (middle), and calcium (right) with the total number of symptoms (top) and total severity (middle), in men (blue) and women (pink). The models represented consist of GLMMs using random intercepts for individuals, clustered by countries, adjusted for age, kidney function, albumin, hemoglobin, baseline CCI, and baseline medications (vitamin D, phosphate binders, calcimimetics). The bar graph at the bottom shows the number of each category by gender. The asterisks represent the statistical significance of the interaction (P < 0.05). The numbers in italics represent the average value in the reference category by sex. Similarly, (B) shows the association between different categories of biomarkers with the overall symptom burden, in patients aged 65–75 years (green) and patients older than 75 years (orange). These GLMMs are adjusted for sex, kidney function, albumin, hemoglobin, baseline CCI and baseline medications (vitamin D, phosphate binders, calcimimetics). Conversion factors for units: PTH in pg/ml to pmol/L, ×0.106; phosphate in mg/dl to mmol/L, ×0.323; calcium in mg/dl to mmol/L, ×0.250. CCI, Charlson Comorbidity Index; GLMM, generalized linear mixed-effect model; PTH, parathyroid hormone.

References

    1. Fletcher B Damery S Aiyegbusi OL, et al. Symptom burden and health-related quality of life in chronic kidney disease: a global systematic review and meta-analysis. PLoS Med. 2022;19(4):e1003954. doi: 10.1371/journal.pmed.1003954 - DOI - PMC - PubMed
    1. Almutary H, Bonner A, Douglas C. Symptom burden in chronic kidney disease: a review of recent literature. J Ren Care. 2013;39(3):140–150. doi: 10.1111/j.1755-6686.2013.12022.x - DOI - PubMed
    1. Caplin B, Kumar S, Davenport A. Patients' perspective of haemodialysis-associated symptoms. Nephrol Dial Transplant. 2011;26(8):2656–2663. doi: 10.1093/ndt/gfq763 - DOI - PubMed
    1. Murphy EL, Murtagh FEM, Carey I, Sheerin NS. Understanding symptoms in patients with advanced chronic kidney disease managed without dialysis: use of a short patient-completed assessment tool. Nephron Clin Pract. 2009;111(1):C74–C80. doi: 10.1159/000183177 - DOI - PubMed
    1. Murtagh FEM, Addington-Hall J, Higginson IJ. The prevalence of symptoms in end-stage renal disease: a systematic review. Adv Chronic Kidney Dis. 2007;14(1):82–99. doi: 10.1053/j.ackd.2006.10.001 - DOI - PubMed