. 2024 Jul 22;19(7):e0307549.
doi: 10.1371/journal.pone.0307549. eCollection 2024.

Prochlorococcus marinus responses to light and oxygen

Affiliations

Prochlorococcus marinus responses to light and oxygen

Mireille Savoie et al. PLoS One. .

Abstract

Prochlorococcus marinus, the smallest picocyanobacterium, comprises multiple clades occupying distinct niches, currently across tropical and sub-tropical oligotrophic ocean regions, including Oxygen Minimum Zones. Ocean warming may open growth-permissive temperatures in new, poleward photic regimes, along with expanded Oxygen Minimum Zones. We used ocean metaproteomic data on current Prochlorococcus marinus niches, to guide testing of Prochlorococcus marinus growth across a matrix of peak irradiances, photoperiods, spectral bands and dissolved oxygen. MED4 from Clade HLI requires greater than 4 h photoperiod, grows at 25 μmol O2 L-1 and above, and exploits high cumulative diel photon doses. MED4, however, relies upon an alternative oxidase to balance electron transport, which may exclude it from growth under our lowest, 2.5 μmol O2 L-1, condition. SS120 from clade LLII/III is restricted to low light under full 250 μmol O2 L-1, shows expanded light exploitation under 25 μmol O2 L-1, but is excluded from growth under 2.5 μmol O2 L-1. Intermediate oxygen suppresses the cost of PSII photoinactivation, and possibly the enzymatic production of H2O2 in SS120, which has limitations on genomic capacity for PSII and DNA repair. MIT9313 from Clade LLIV is restricted to low blue irradiance under 250 μmol O2 L-1, but exploits much higher irradiance under red light, or under lower O2 concentrations, conditions which slow photoinactivation of PSII and production of reactive oxygen species. In warming oceans, range expansions and competition among clades will be governed not only by light levels. Short photoperiods governed by latitude, temperate winters, and depth attenuation of light, will exclude clade HLI (including MED4) from some habitats. In contrast, clade LLII/III (including SS120), and particularly clade LLIV (including MIT9313), may exploit higher light niches nearer the surface, under expanding OMZ conditions, where low O2 relieves the stresses of oxidation stress and PSII photoinhibition.


Conflict of interest statement

The authors have declared that no competing interests exist.

Figures

Fig 1
Fig 1. Peak Photosynthetically Usable Radiation (PUR; μmol photons m-2 s-1) vs. peak Photosynthetically Active Radiation (PAR; μmol photons m-2 s-1).
The correlation between PAR, plotted on the x-axis and PUR, plotted on the y-axis, are coloured for each imposed spectral waveband; 450 nm (blue circles), 660 nm (red circles) and white LED (black circles). The grey dashed line represents a hypothetical one to one correlation. A. is Prochlorococcus marinus MED4. B. is Prochlorococcus marinus SS120. C. is Prochlorococcus marinus MIT9313.
Fig 2
Fig 2. Ocean detection of Prochlorococcus marinus photosynthesis complexes.
Protein detections (circles) are plotted vs. O2 (μM) (x-axis) and depth (m) (y-axis) at sample origins, with ‘jitter’ offsets up to 15% of full axes scales, to visualize over-laid data points. Rows separate data annotated as from Prochlorococcus marinus clades: HLI (including P. marinus MED4, solid black circles), LLI (including P. marinus NATL2A, solid black circles), LLII/III (including P. marinus SS120, solid black circles) and LLIV (including P. marinus MIT9313, solid black circles). Columns show detections of proteins annotated as Photosystem II (PSII), Cytochromeb6f complex (Cytb6f), Photosystem I (PSI), ATP Synthase or Ribulose-1,5-bisphosphate oxygenase carboxylase (RUBISCO). For comparison, experimental conditions for culture growth rate determinations are indicated by horizontal grey lines for depths, approximating peak Photosynthetically Active Radiation (PAR; μmol photons m-2 s-1); and vertical grey lines for imposed [O2] (μM). Data obtained from the Biological and Chemical Oceanography Data Management Office repository [43].
Fig 3
Fig 3
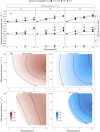
A. Chlorophyll specific growth rate (d-1) for Prochlorococcus marinus MED4 (High-Light (HLI) near surface clade) vs. photoperiod (h). Rows separate data from levels of imposed dissolved O2 concentrations (250 μM, 25 μM and 2.5 μM). Columns separate data from 3 levels of peak imposed Photosynthetically Active Radiation (PAR; 30, 90 and 180 μmol photons m-2 s-1). Colours represent the imposed spectral waveband (nm). Large circles show mean or single determinations of growth rate from logistic curve fits; small circles show values for replicate determinations, if any: Replicates often fall with larger circles. B. Contour plot of a Generalized Additive Model (GAM) representing the chlorophyll specific growth rate (d-1) for Prochlorococcus marinus MED4 grown under 660 nm (red) or 450 nm (blue) light. X-axis is photoperiod (h). Y-axis is Photosynethetically Active Radiation (PAR, μmol photons m-2 s-1). Top left panel represents the model under 250 μM of O2 and red light. Bottom left panel represents the model under 25 μM of O2 and red light. Top right panel represents the model under 250 μM of O2 and blue light. Bottom right panel represents the model under 25 μM of O2 and blue light. Legends represent a colour gradient of growth rate from no growth (white) to 1.00 d-1 (dark red or dark blue). Labeled contour lines indicate the 90%, 50%, and 10% quantiles for achieved growth rate.
Fig 4
Fig 4
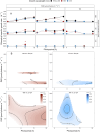
A. Chlorophyll specific growth rate (d-1) for Prochlorococcus marinus SS120 (Low-Light, deep ocean clade LLII/III) vs. photoperiod (h). Rows separate data from levels of imposed dissolved O2 concentrations (250 μM, 25 μM and 2.5 μM). Columns separate data from 3 levels of peak imposed Photosynthetically Active Radiation (PAR; 30, 90 and 180 μmol photons m-2 s-1). Colours represent the imposed spectral waveband (nm). Large circles show mean or single determinations of growth rate from logistic curve fits; small circles show values for replicate determinations, if any: Replicates often fall with larger circles. B. Contour plot of a Generalized Additive Model (GAM) representing the chlorophyll specific growth rate (d-1) for Prochlorococcus marinus SS120 grown under 660 nm (red) or 450 nm (blue) light. X-axis is photoperiod (h). Y-axis is Photosynethetically Active Radiation (PAR, μmol photons m-2 s-1). Top left panel represents the model under 250 μM of O2 and red light. Bottom left panel represents the model under 25 μM of O2 and red light. Top right panel represents the model under 250 μM of O2 and blue light. Bottom right panel represents the model under 25 μM of O2 and blue light. Legends represent a colour gradient of growth rate from no growth (white) to 1.00 d-1 (dark red or dark blue). Labeled contour lines indicate the 90%, 50%, and 10% quantiles for achieved growth rate.
Fig 5
Fig 5
A. Chlorophyll specific growth rate (d-1) for Prochlorococcus marinus MIT9313 (Low-Light, deep ocean clade LLIV) vs. photoperiod (h). Rows separate data from levels of imposed dissolved O2 concentrations (250 μM, 25 μM and 2.5 μM). Columns separate data from 3 levels of peak imposed Photosynthetically Active Radiation (PAR; 30, 90 and 180 μmol photons m-2 s-1). Colours represent the imposed spectral waveband (nm). Large circles show mean or single determinations of growth rate from logistic curve fits; small circles show values for replicate determinations, if any: Replicates often fall with larger circles. B. Contour plot of a Generalized Additive Model (GAM) representing the chlorophyll specific growth rate (d-1) for Prochlorococcus marinus MIT9313 grown under 660 nm (red) or 450 nm (blue) light. X-axis is photoperiod (h). Y-axis is Photosynthetically Active Radiation (PAR; μmol photons m-2 s-1). Top left panel represents the model under 250 μM of O2 and red light. Center left panel represents the model under 25 μM of O2 and red light. Bottom left panel represents the model under 2.5 μM of O2 and red light. Top right panel represents the model under 250 μM of O2 and blue light. Center right panel represents the model under 25 μM of O2 and blue light. Bottom right panel represents the model under 2.5 μM of O2 and blue light. Legends represent a colour gradient of growth rate from no growth (white) to 1.00 d-1 (dark red or dark blue). Labeled contour lines indicate the 90%, 50%, and 10% quantiles for achieved growth rate.
Fig 6
Fig 6. Chlorophyll specific growth rate (d-1) vs. cumulative diel Photosynthetically Usable Radiation (PUR, μmol photons m-2 d-1).
Rows separate data from levels of imposed dissolved O2 concentrations as 250 μM, 25 μM and 2.5 μM. Columns separate data from strains; MED4 (A-C), SS120 (D-F) and MIT9313 (G-I). Shapes show the imposed photoperiod (h); 4 h (solid square), 8 h (solid diamond), 12 h (solid circle), 16 h (solid upright triangle). Symbol colours show the spectral waveband for growth; 660 nm (red symbols), and 450 nm (blue symbols). Large symbols show mean of growth rate from logistic curve fits; small symbols show values from replicates, if any. Harrison and Platt [54] 4 parameter model fit to 660 nm (red lines) or 450 nm (blue lines) growth rate data for each combination of strain and dissolved oxygen shown with solid lines (red significantly different from blue, P value < 0.05) or dashed lines (red not significantly different from blue, P value > 0.05) tested using one-way ANOVA comparisons of fits.
Fig 7
Fig 7. Ocean detection of Prochlorococcus marinus protein metabolism complexes.
Protein detections (circles) are plotted vs. O2 (μM) (x-axis) and depth (m) (y-axis) at sample origin with a 15% offset to separate protein detections occupying the same origin. Rows separate data annotated as from Prochlorococcus marinus clades: HLI (including P. marinus MED4, solid black circles), LLI (including P. marinus NATL2A, solid black circles), LLII/III (including P. marinus SS120, solid black circles) and LLIV (including P. marinus MIT9313, solid black circles). Columns show detections of proteins annotated as FtsH Protease Complexes (FtsH1, FtsH2, FtsH3) or the Ribosome. For comparison, experimental conditions for culture growth rate determinations are indicated by horizontal grey lines for depths approximating peak Photosynthetically Active Radiation (PAR; μmol photons m-2 s-1); and vertical grey lines for [O2] (μM). Data obtained from the Biological and Chemical Oceanography Data Management Office repository [43].
Fig 8
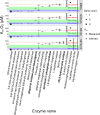
Fig 8. Km values for oxygen metabolizing enzymes.
The y-axis represents the log10 concentration of oxygen substrate (μM). The x-axis represents the oxygen metabolizing enzymes encoded in at least one of the Prochlorococcus marinus strains in this study. The Prochlorococcus marinus strains are indicated in rows. The solid circles represent Km values from literature and the asterisks represent predicted values. Colours represent the gene counts. The red shaded area denotes a Km oxygen concentration range from 230 to 280 μM. The green shaded area denotes a Km oxygen concentration range from 5 to 50 μM. The blue shaded area denotes a Km oxygen concentration range from 0.5 to 5 μM. The black bars show the minimum and maximum Km values. Figure was generated using a filtered subset of the annotated phytoplankton gene sequences dataset from Omar et al. [62].
Fig 9
Fig 9. Genes encoding DNA repair enzymes.
The y-axis represents Prochlorococcus marinus strains. The x-axis represents enzymes encoded for DNA repair found in at least one Prochlorococcus marinus strain in this study. Point size indicate gene counts. Figure was generated using a filtered subset of the annotated phytoplankton gene sequences dataset from Omar et al. [62].
Fig 10
Fig 10. Potential Future Niches for Prochlorococcus clades in a warming ocean.
The maps shows current latitudinal distribution limits for Prochlorococcus (between green dashed lines), along with tropical and temperate latitudinal regions (yellow bands). Light levels, photoperiods and spectral bands, potentially permissive for growth of Prochlorococcus clades are determined by the interactions of latitude, season and depth attenuation of light. A. Potential clade occupancies under hypothetical Full Oxygen Zones (250 μM O2, not shown on map) are shown for 10–50 m and 100 m depths, in temperate vs. tropical regions, under depth-resolved photoperiods, approximating Winter Solstice, Equinox and Summer Solstice. Clade HLI is excluded from temperate depths by short photoperiods at Winter Solstice. Clades LLII/III and LLIV are excluded from shallow depths by excessive light. B. Oxygen Minimum Zones (25 μM O2, not shown on map) would drastically alter these potential occupancy patterns by excluding clade HLI from the temperate winter solstice at all depths, and by expanding the exploitation of higher light zones by Clade LLIV. Potential clade occupancies for the southern temperate zone mirror the northern temperate zone occupancies.

Similar articles

Cited by

References

    1. Chisholm SW, Frankel SL, Goericke R, Olson RJ, Palenik B, Waterbury JB, et al. Prochlorococcus Marinus nov. Gen. Nov. Sp.: An oxyphototrophic marine prokaryote containing divinyl chlorophyll a and b. Archives of Microbiology. 1992;157: 297–300. doi: 10.1007/BF00245165 - DOI
    1. Partensky F, Hess WR, Vaulot D. Prochlorococcus, a Marine Photosynthetic Prokaryote of Global Significance. Microbiology and Molecular Biology Reviews. 1999;63: 106–127. - PMC - PubMed
    1. Rocap G, Larimer FW, Lamerdin J, Malfatti S, Chain P, Ahlgren NA, et al. Genome divergence in two Prochlorococcus ecotypes reflects oceanic niche differentiation. Nature. 2003;424: 1042–1047. doi: 10.1038/nature01947 - DOI - PubMed
    1. Moore LR, Rocap G, Chisholm SW. Physiology and molecular phylogeny of coexisting Prochlorococcus ecotypes. Nature. 1998;393: 464–467. doi: 10.1038/30965 - DOI - PubMed
    1. Moore LR, Goericke R, Chisholm SW. Comparative physiology of Synechococcus and Prochlorococcus: Influence of light and temperature on growth, pigments, fluorescence and absorptive properties. Marine Ecology Progress Series. 1995;116: 259–275. Available: https://www.jstor.org/stable/44635011.

LinkOut - more resources