. 2024 Jul 22;20(7):e1011348.
doi: 10.1371/journal.pgen.1011348. eCollection 2024 Jul.

APOER2 splicing repertoire in Alzheimer's disease: Insights from long-read RNA sequencing

Affiliations

APOER2 splicing repertoire in Alzheimer's disease: Insights from long-read RNA sequencing

Christina M Gallo et al. PLoS Genet. .

Abstract

Disrupted alternative splicing plays a determinative role in neurological diseases, either as a direct cause or as a driver in disease susceptibility. Transcriptomic profiling of aged human postmortem brain samples has uncovered hundreds of aberrant mRNA splicing events in Alzheimer's disease (AD) brains, associating dysregulated RNA splicing with disease. We previously identified a complex array of alternative splicing combinations across apolipoprotein E receptor 2 (APOER2), a transmembrane receptor that interacts with both the neuroprotective ligand Reelin and the AD-associated risk factor, APOE. Many of the human APOER2 isoforms, predominantly featuring cassette splicing events within functionally important domains, are critical for the receptor's function and ligand interaction. However, a comprehensive repertoire and the functional implications of APOER2 isoforms under both physiological and AD conditions are not fully understood. Here, we present an in-depth analysis of the splicing landscape of human APOER2 isoforms in normal and AD states. Using single-molecule, long-read sequencing, we profiled the entire APOER2 transcript from the parietal cortex and hippocampus of Braak stage IV AD brain tissues along with age-matched controls and investigated several functional properties of APOER2 isoforms. Our findings reveal diverse patterns of cassette exon skipping for APOER2 isoforms, with some showing region-specific expression and others unique to AD-affected brains. Notably, exon 15 of APOER2, which encodes the glycosylation domain, showed less inclusion in AD compared to control in the parietal cortex of females with an APOE ɛ3/ɛ3 genotype. Also, some of these APOER2 isoforms demonstrated changes in cell surface expression, APOE-mediated receptor processing, and synaptic number. These variations are likely critical in inducing synaptic alterations and may contribute to the neuronal dysfunction underlying AD pathogenesis.


Conflict of interest statement

The authors have declared that no competing interests exist.

Figures

Fig 1
Fig 1. APOER2 exhibits isoform diversity in the human parietal cortex.
(A) Post-mortem parietal cortex tissue sample characteristics that includes age, postmortem interval (PMI), plaques per mm2 and Braak stage. (B) DNA gel depicting APOER2 specific cDNA amplicons. Arrowhead indicates the expected size of full-length APOER2 transcripts. (C) Graph depicting the transcript length distribution and mean of detected isoforms in the parietal cortex in base pairs (bp). Length does not include the RT-PCR primer sequences. (D) Venn diagram of detected APOER2 isoforms in control and AD parietal cortex samples. (E) 209 unique APOER2 transcripts detected in the human parietal cortex. Left: Transcript matrix depicting 209 individual APOER2 isoforms as individual rows and exons as columns. Colored boxes indicate exon inclusion, while white boxes indicate exon exclusion. Isoforms are color coded based on whether they are common and shared to both control and AD (purple), specific to control (orange), or AD (navy blue). Transcripts that were also identified in the hippocampus (Fig 2) are indicated by a light blue coloring of constitutive exon 1. Middle: Bar plot indicating the log2FC (AD/control) of each corresponding transcript in the adjacent matrix. Right: Heat map indicating the log10 transformed number full-length (FL) reads per isoform for each sample.
Fig 2
Fig 2. APOER2 exhibits isoform diversity in the human hippocampus.
(A) Postmortem hippocampal tissue sample characteristics that includes age, postmortem interval (PMI), plaques per mm2 and Braak stage. Asterisks indicate samples common between the parietal cortex and hippocampus. (B) DNA gel depicting APOER2 specific cDNA amplicons. Arrowhead indicates the expected size of full-length APOER2 transcripts. (C) Graph depicting the transcript length distribution and mean of detected isoforms in the hippocampus in base pairs (bp). (D) Venn diagram of detected isoforms in control and AD hippocampal samples. (E) 249 unique APOER2 transcripts detected in the human hippocampus. Left: Transcript matrix depicting 249 individual APOER2 isoforms as individual rows and exons as columns. Colored boxes indicate exon inclusion, while white boxes indicate exon exclusion. Isoforms are color coded based on whether they are common to both control and AD (purple), specific to control (orange), or AD (navy blue). Transcripts that were also identified in the parietal cortex (Fig 1) are indicated by a light blue coloring of constitutive exon 1. Middle: Bar plot indicating the log2FC (AD/Control) of each corresponding transcript in the adjacent matrix. Right: Heat map indicating the log10 transformed number of full-length (FL) reads per isoform for each sample.
Fig 3
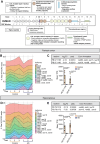
Fig 3. Top 10 expressed APOER2 isoforms in the parietal cortex and hippocampus.
(A) Human APOER2 exon structure and protein functional domains. (B) Stacked area chart depicting the percent of full-length APOER2 reads each of the top 10 isoforms per individual sample or across all samples (Total) make up in the parietal cortex. (C) Table showing adjusted p-value and exon annotation of APOER2 transcripts. Bar plot of the mean APOER2 TPM per group ± S.E.M. between control and AD. Statistical significance was calculated using DeSeq2, with an FDR of 0.1. (D) Stacked area chart depicting the percent of full-length APOER2 reads each of the top 10 isoforms per individual sample or across all samples (Total) make up in the hippocampus. (E) Table showing adjusted p-value and exon annotation of APOER2 transcripts. Bar plot of the mean APOER2 TPM per group ± S.E.M. between AD and control. Statistical significance was calculated using DeSeq2, with an FDR of 0.1.
Fig 4
Fig 4. Individual splicing of cassette exons in APOER2 is disrupted in AD.
(A) APOER2 ex15 inclusion is downregulated in the parietal cortex in AD compared to control. Bar graph depicting average frequency spliced in value for each exon in control and AD groups. (B) APOER2 ex5 inclusion is upregulated in the hippocampus in AD compared to control. Bar graph depicting average frequency spliced in value for each exon in control and AD. For A-B, data are expressed as mean ± S.E.M and significance was determined using a 2-way ANOVA with Sidak’s multiple comparisons correction with p-values listed above. (C) Schematic depicting human APOER2 protein domains and corresponding coding exons along with RT-PCR strategy. On the right is a gel depicting RT-PCR of mRNA from the human parietal cortex examining inclusion of APOER2 ex15. The PCR product was purified and sequenced, see S4 Fig. (D) Quantitative RT-PCR analysis of APOER2 ex15 inclusion of APOE ε3/ε3 control and AD parietal cortex samples. Mean ± S.E.M. is depicted and significance was determined using a Student’s t-test with p-values listed above. (E-F) Scatterplots of the ranked median APOER2 TPM for the (E) control or (F) AD samples in hippocampus versus parietal cortex. Only isoforms common between the two regions were graphed. (G) Scatterplot of the log2 fold change (L2FC) of AD/control APOER2 isoforms common to the parietal cortex and hippocampus. Numbering on the plot points indicates a transcript number randomly assigned and does not indicate the rank value. Transcript numbering is comparable between E, F & G.
Fig 5
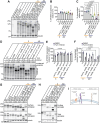
Fig 5. APOER2 isoforms exhibit specific changes in glycosylated receptor properties.
(A) Representative immunoblots of HEK293T cells expressing APOER2 isoforms of interest and probed for APOER2 and tubulin protein expression. Purple and yellow dots indicate the mature and immature glycosylated form of APOER2, respectively. (B) Quantification of total APOER2 protein normalized to tubulin and expressed as percentage of APOER2 full-length (FL) isoform. (C) Quantification of the glycosylated APOER2 (topmost band in each lane, indicated by purple dot in A) relative to total APOER2 protein and expressed as percentage of APOER2-FL isoform. (D) Furin inhibition does not rescue AD specific APOER2 isoform glycosylation levels. Representative immunoblots of cell lysate from HEK293T cells transfected with various APOER2 isoforms and treated with either vehicle or 15 μM furin inhibitor for 24 hours. Lysate was probed for APOER2 and tubulin protein. (E) Quantification of total APOER2 expression normalized to tubulin and expressed as percentage of APOER2-FL treated with DMSO. (F) Quantification of the glycosylated topmost APOER2 band in D denoted by purple dot relative to total APOER2 protein and expressed as a percentage of APOER2-FL treated with DMSO. Data are expressed as mean ± S.E.M. (n = 3 independent experiments). Statistical significance was determined using a one-way ANOVA with Dunnett’s multiple comparisons test with p-values are listed above each graph. (G) APOER2 ex6B isoforms demonstrate multiple forms at the cell surface. Representative immunoblots of total protein and surface protein from HEK293T cells transfected with APOER2 isoforms of interest for 24 hours and blotted for APOER2 and tubulin (n = 4 independent experiments). (H) APOER2 ex6B isoforms predominantly express the furin cleaved form of the receptor at the cell surface. Representative immunoblots of total protein and surface protein from Apoer2 knockout primary murine cortical neurons rescued with lentivirus expressing APOER2 isoforms of interest and blotted for APOER2 and tubulin (n = 3 independent experiments). (I) Schematic of APOER2 receptors at the cell surface with and without ex6B (Δex6B) inclusion. Created with biorender.com.
Fig 6
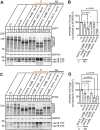
Fig 6. APOER2 isoforms exhibit differential APOE-mediated receptor cleavage.
(A) Representative immunoblots of APOER2 isoforms of interest expressed in HEK293T cells and treated with γ-secretase inhibitor DAPT for 24 hours to measure APOER2 CTF accumulation, indicated by yellow dot. (B) Quantification of APOER2-CTF normalized to each APOER2 variant (total) and expressed as a percentage of APOER2-FL treated with DAPT (n = 5 independent experiments). (C) Representative immunoblots of APOER2 isoforms of interest expressed in HEK293T cells and treated with APOE mimetic peptide for 30 minutes to measure APOER2 CTF accumulation, indicated by yellow dot. (D) Quantification of APOER2-CTF normalized to each APOER2 variant (total) and expressed as a percentage of APOER2-FL treated with APOE (n = 4–5 independent experiments). Data are expressed as mean ± S.E.M. Statistical significance was determined using a one-way ANOVA with Dunnett’s multiple comparisons test and p-values are listed above each graph.
Fig 7
Fig 7. APOER2 isoform unique to AD leads to a change in total synapse number.
(A) Representative images of hippocampal neuronal processes of Apoer2 homozygous mouse knockout neurons infected with human APOER2-FL, APOER2 Δex4-5 +ex6B Δex18, APOER2 +ex6B, Δex8, Δex18, APOER2 Δex4-5 +ex6B Δex15 or APOER2 +ex6B, Δex14, Δex18 lentivirus and stained with synapsin (green) and PSD95 (red) at 14 DIV. Scale bar, 5 μm. (B) Bar graph of quantification in the number of synapsin puncta. (C) Quantification of the number of PSD95 puncta. (D) Quantification of synapsin and PSD95 colocalization in neuronal processes depicting the number of total synapses. Each data point represents the average number of surface puncta greater than 10 voxels per region of interest for each captured neuron. N = 2 independent experiments. Data are expressed as mean ± S.E.M. Statistical significance was determined using a one-way ANOVA with Tukey’s multiple comparisons test and p-values are listed above each graph.

References

    1. Wang ET, Sandberg R, Luo S, Khrebtukova I, Zhang L, Mayr C, et al.. Alternative isoform regulation in human tissue transcriptomes. Nature. 2008;456(7221):470–6. doi: 10.1038/nature07509 ; PubMed Central PMCID: PMC2593745. - DOI - PMC - PubMed
    1. Krawczak M, Reiss J, Cooper DN. The mutational spectrum of single base-pair substitutions in mRNA splice junctions of human genes: Causes and consequences. Human Genetics. 1992;90(1):41–54. doi: 10.1007/BF00210743 - DOI - PubMed
    1. Krawczak M, Thomas NST, Hundrieser B, Mort M, Wittig M, Hampe J, et al.. Single base-pair substitutions in exon–intron junctions of human genes: nature, distribution, and consequences for mRNA splicing. Human Mutation. 2007;28(2):150–8. doi: 10.1002/humu.20400 - DOI - PubMed
    1. Yeo G, Holste D, Kreiman G, Burge CB. Variation in alternative splicing across human tissues. Genome Biology. 2004;5(10):R74. doi: 10.1186/gb-2004-5-10-r74 - DOI - PMC - PubMed
    1. Raj B, Blencowe Benjamin J. Alternative Splicing in the Mammalian Nervous System: Recent Insights into Mechanisms and Functional Roles. Neuron. 2015;87(1):14–27. doi: 10.1016/j.neuron.2015.05.004 - DOI - PubMed

MeSH terms