. 2024 Aug 1;128(30):7385-7400.
doi: 10.1021/acs.jpcb.4c01634. Epub 2024 Jul 22.

Quantifying Induced Dipole Effects in Small Molecule Permeation in a Model Phospholipid Bilayer

Affiliations

Quantifying Induced Dipole Effects in Small Molecule Permeation in a Model Phospholipid Bilayer

Julia M Montgomery et al. J Phys Chem B. .

Abstract

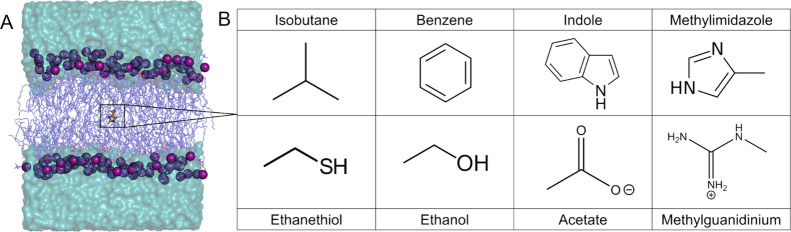
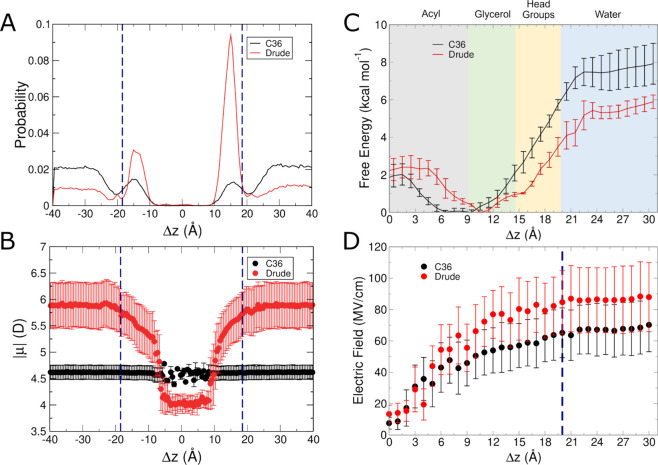
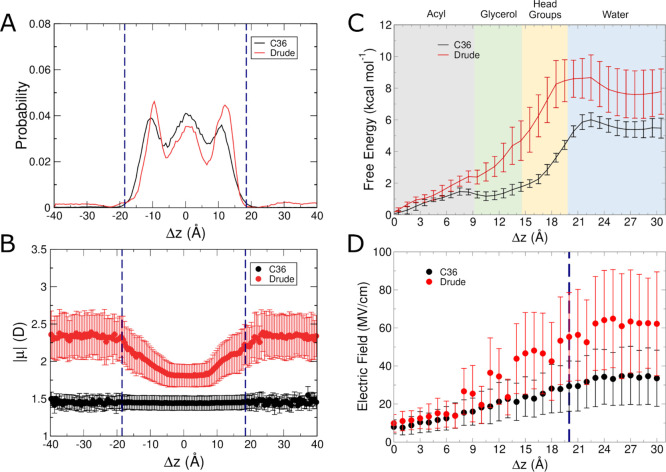
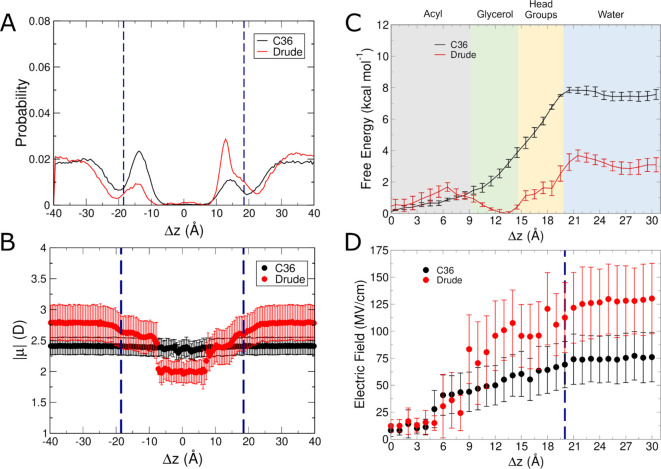
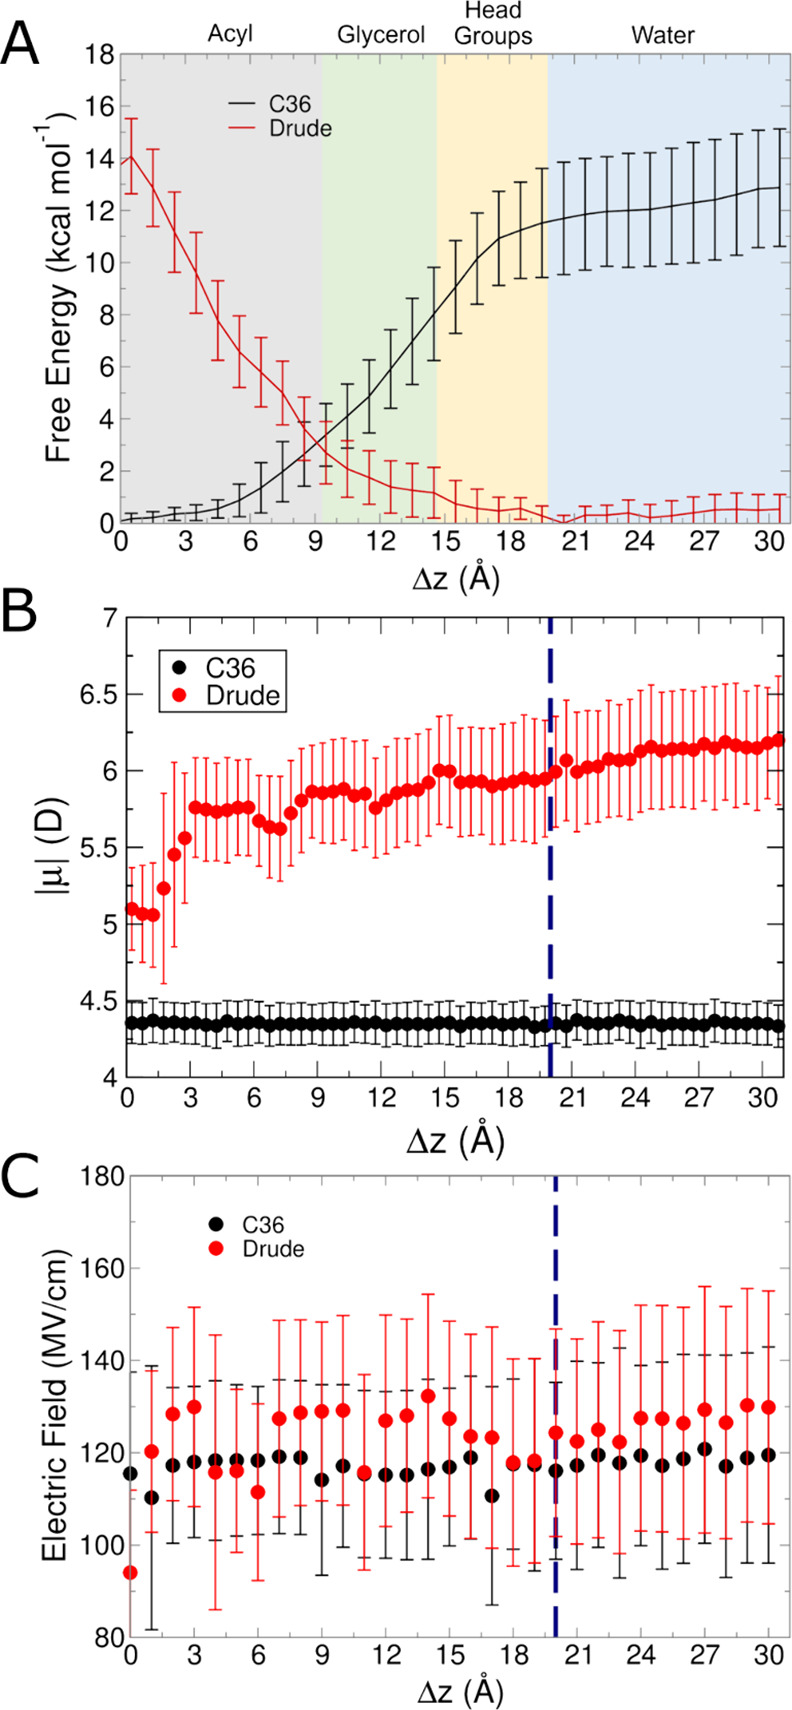
The cell membrane functions as a semipermeable barrier that governs the transport of materials into and out of cells. The bilayer features a distinct dielectric gradient due to the amphiphilic nature of its lipid components. This gradient influences various aspects of small molecule permeation and the folding and functioning of membrane proteins. Here, we employ polarizable molecular dynamics simulations to elucidate the impact of the electronic environment on the permeation process. We simulated eight distinct amino-acid side chain analogs within a 1-palmitoyl-2-oleoyl-sn-glycero-3-phosphocholine bilayer using the Drude polarizable force field (FF). Our approach includes both unbiased and umbrella sampling simulations. By using a polarizable FF, we sought to investigate explicit dipole responses in relation to local electric fields along the membrane normal. We evaluate molecular dipole moments, which exhibit variation based on their localization within the membrane, and compare the outcomes with analogous simulations using the nonpolarizable CHARMM36 FF. This comparative analysis aims to discern characteristic differences in the free energy surfaces of permeation for the various amino-acid analogs. Our results provide the first systematic quantification of the impact of employing an explicitly polarizable FF in this context compared to the fixed-charge convention inherent to nonpolarizable FFs, which may not fully capture the influence of the membrane dielectric gradient.


Conflict of interest statement

The authors declare no competing financial interest.

Figures

Figure 1
Figure 1
Schematic summary of systems. (A) Example of the initial configuration of each system. The small molecule inserted at the center of the bilayer is represented as orange ball-and-stick, lipids tails as dark blue sticks, phosphorus atoms as purple spheres, and water as cyan surface. (B) Structures and common names of each small-molecule side chain analog.
Figure 2
Figure 2
Results from C36 and Drude simulations of isobutane systems. (A) Normalized probability of localization of isobutane in unbiased simulations. (B) Molecular dipole moments as a function of position within the membrane in unbiased simulations. (C) Free energy surfaces from umbrella sampling simulations. (D) Average intrinsic electric field magnitude acting at the COG of isobutane in each umbrella sampling window. Blue dashed lines in panels (A, B, D) denote the average position of the phosphate groups.
Figure 3
Figure 3
Results from C36 and Drude simulations of benzene systems. (A) Normalized probability of localization of benzene in unbiased simulations. (B) Molecular dipole moments as a function of position within the membrane in unbiased simulations. (C) Free energy surfaces from umbrella sampling simulations. (D) Average intrinsic electric field magnitude acting at the COG of benzene in each umbrella sampling window. Blue dashed lines in panels (A, B, D) denote the average position of the phosphate groups.
Figure 4
Figure 4
Results from C36 and Drude simulations of indole systems. (A) Normalized probability of localization of indole in unbiased simulations. (B) Molecular dipole moments as a function of position within the membrane in unbiased simulations. (C) Free energy surfaces from umbrella sampling simulations. (D) Average intrinsic electric field magnitude acting at the COG of indole in each umbrella sampling window. Blue dashed lines in panels (A, B, D) denote the average position of the phosphate groups.
Figure 5
Figure 5
Results from C36 and Drude simulations of methylimidazole systems. (A) Normalized probability of localization of methylimidazole in unbiased simulations. (B) Molecular dipole moments as a function of position within the membrane in unbiased simulations. (C) Free energy surfaces from umbrella sampling simulations. (D) Average intrinsic electric field magnitude acting at the COG of methylimidazole in each umbrella sampling window. Blue dashed lines in panels (A, B, D) denote the average position of the phosphate groups.
Figure 6
Figure 6
Results from C36 and Drude simulations of ethanethiol systems. (A) Normalized probability of localization of ethanethiol in unbiased simulations. (B) Molecular dipole moments as a function of position within the membrane in unbiased simulations. (C) Free energy surfaces from umbrella sampling simulations. (D) Average intrinsic electric field magnitude acting at the COG of ethanethiol in each umbrella sampling window. Blue dashed lines in panels (A, B, D) denote the average position of the phosphate groups.
Figure 7
Figure 7
Results from C36 and Drude simulations of ethanol systems. (A) Normalized probability of localization of ethanol in unbiased simulations. (B) Molecular dipole moments as a function of position within the membrane in unbiased simulations. (C) Free energy surfaces from umbrella sampling simulations. (D) Average intrinsic electric field magnitude acting at the COG of ethanol in each umbrella sampling window. Blue dashed lines in panels (A, B, D) denote the average position of the phosphate groups.
Figure 8
Figure 8
Results from C36 and Drude simulations of acetate systems. (A) Free energy surfaces from umbrella sampling simulations. (B) Molecular dipole moments as a function of position within the membrane in unbiased simulations. (C) Average intrinsic electric field magnitude acting at the COG of acetate in each umbrella sampling window. Blue dashed lines in panels (B, C) denote the average position of the phosphate groups.
Figure 9
Figure 9
Hydration of acetate at Δz = 0 Å for the C36 (left, at 33 ns) and Drude FFs (right, at 38 ns). The acetate molecule inserted at the center of the bilayer is represented as orange ball-and-stick, lipids tails as dark blue sticks, phosphorus atoms as purple spheres, and water as cyan surface.
Figure 10
Figure 10
Acetate umbrella sampling results started from dehydrated coordinates compared to original starting coordinates (Drude only, Drude original repeated from Figure 8). (A) Free energy surfaces from umbrella sampling simulations. (B) Molecular dipole moments as a function of position within the membrane in unbiased simulations. (C) Average intrinsic electric field magnitude acting at the COG of acetate in each umbrella sampling window. Blue dashed lines in panels (B, C) denote the average position of the phosphate groups. Simulations ran for 70 ns to mirror original coordinates and achieved convergence with the same applied methodology.
Figure 11
Figure 11
Results from C36 and Drude simulations of methylguanidinium systems. (A) Free energy surfaces from umbrella sampling simulations. (B) Molecular dipole moments as a function of position within the membrane in unbiased simulations. (C) Average intrinsic electric field magnitude acting at the COG of methylguanidinium in each umbrella sampling window. Blue dashed lines in panels (B, C) denote the average position of the phosphate groups.
Figure 12
Figure 12
Representative snapshots from Drude simulations of methylguanidinium at Δz = 2 Å (left, at 45 ns) and at Δz = 26 Å (right, at 45 ns). The methylguanidinium molecule is represented as orange ball-and-stick, lipids tails as dark blue sticks, phosphorus atoms as purple spheres, and water as cyan surface.

Similar articles

References

    1. Overington J. P.; Al-Lazikani B.; Hopkins A. L. How Many Drug Targets Are There?. Nat. Rev. Drug Discovery 2006, 5 (12), 993–996. 10.1038/nrd2199. - DOI - PubMed
    1. Egberts E.; Berendsen H. J. C. Molecular Dynamics Simulation of a Smectic Liquid Crystal with Atomic Detail. J. Chem. Phys. 1988, 89 (6), 3718–3732. 10.1063/1.454893. - DOI
    1. Jönsson B.; Edholm O.; Teleman O. Molecular Dynamics Simulations of a Sodium Octanoate Micelle in Aqueous Solution. J. Chem. Phys. 1986, 85 (4), 2259–2271. 10.1063/1.451122. - DOI
    1. Goossens K.; De Winter H. Molecular Dynamics Simulations of Membrane Proteins: An Overview. J. Chem. Inf. Model. 2018, 58 (11), 2193–2202. 10.1021/acs.jcim.8b00639. - DOI - PubMed
    1. Tieleman D. P.; Sejdiu B. I.; Cino E. A.; Smith P.; Barreto-Ojeda E.; Khan H. M.; Corradi V. Insights into Lipid-Protein Interactions from Computer Simulations. Biophys. Rev. 2021, 13 (6), 1019–1027. 10.1007/s12551-021-00876-9. - DOI - PMC - PubMed

MeSH terms

LinkOut - more resources