. 2024 Nov;24(11):2045-2057.
doi: 10.1016/j.spinee.2024.07.002. Epub 2024 Jul 20.

Cervical spinal cord morphometrics in degenerative cervical myelopathy: quantification using semi-automated normalized technique and correlation with neurological dysfunctions

Affiliations

Cervical spinal cord morphometrics in degenerative cervical myelopathy: quantification using semi-automated normalized technique and correlation with neurological dysfunctions

Fauziyya Muhammad et al. Spine J. 2024 Nov.

Abstract

Background context: Degenerative cervical myelopathy (DCM) is characterized by spinal cord atrophy. Accurate estimation of spinal cord atrophy is key to the understanding of neurological diseases, including DCM. However, its clinical application is hampered by difficulties in its precise and consistent estimation due to significant variability in spinal cord morphometry along the cervical spine, both within and between individuals.

Purpose: To characterize morphometrics of the compressed spinal cord in DCM patients. We employed our semiautomated analysis framework that incorporates the Spinal Cord Toolbox (SCT) and a normalization approach to effectively address the challenges posed by cord compression in these patients. Additionally, we examined the clinical relevance of these morphometric measures to enhance our understanding of DCM pathophysiology.

Study design: Prospective study.

Patient sample: This study investigated 36 DCM patients and 31 healthy controls (HCs).

Outcome measures: Clinical scores including 9-hole peg test for hand dexterity, hand grip strength, balance, gait speed, modified Japanese Orthopaedic Association (mJOA) score, and imaging-based spinal cord morphometrics.

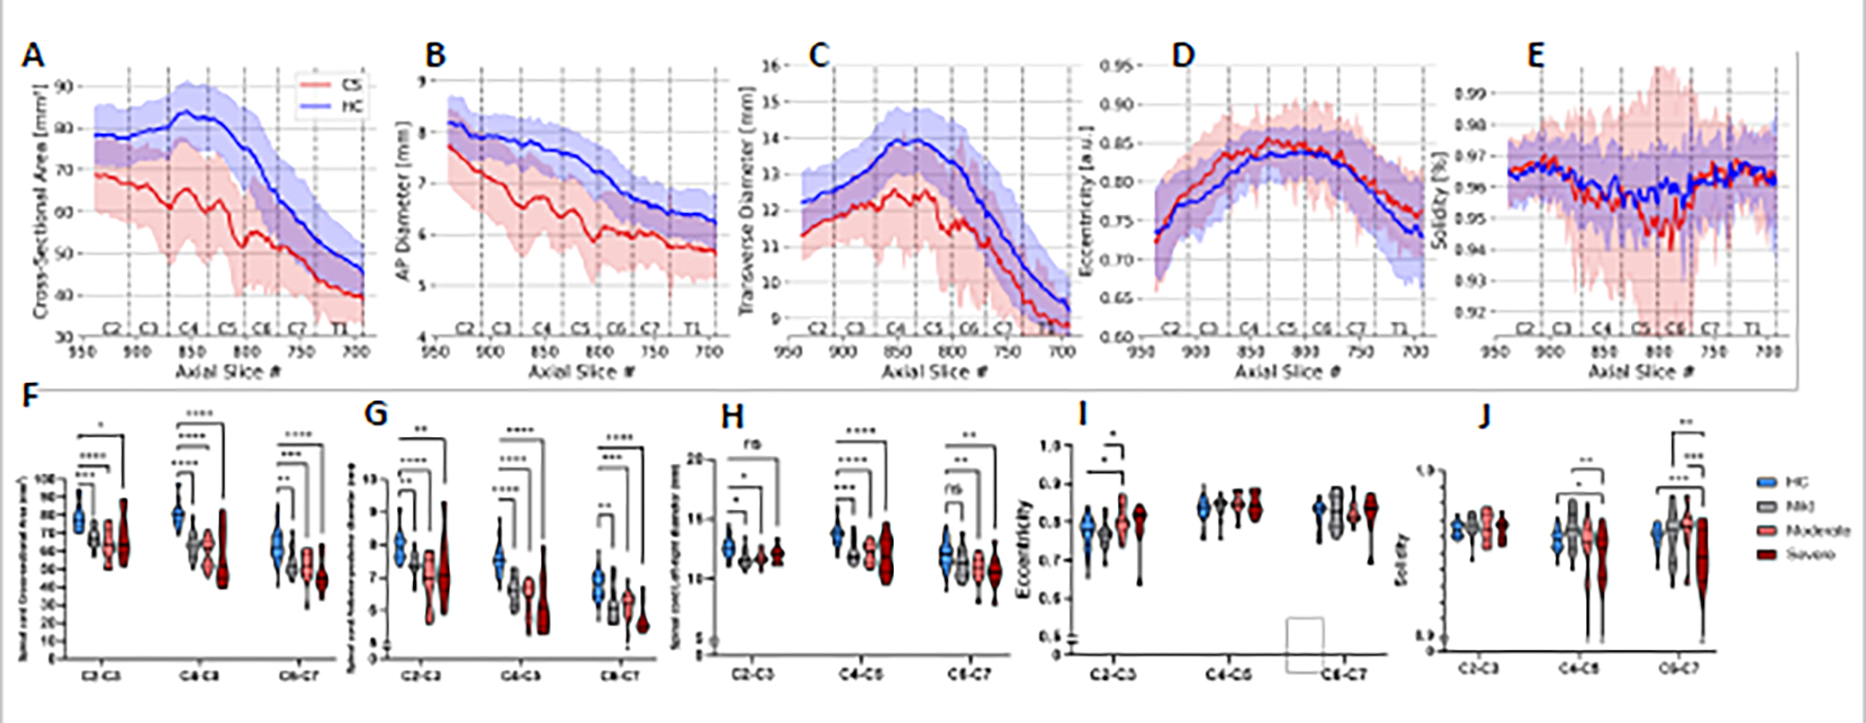
Method: Using the generic spine acquisition protocol and our semiautomated analysis pipeline, spinal cord morphometrics, including cross-sectional area (CSA), anterior-posterior (AP) and transverse (RL) diameters, eccentricity, and solidity, were estimated from sagittal T2w magnetic resonance imaging (MRI) images using the Spinal Cord Toolbox (SCT). Normalized metrics were extracted from the C1 to C7 vertebral levels and compared between DCM patients and HC. Morphometric data at regions of maximum spinal cord compression (MSCC) were correlated with the clinical scores. A subset of participants underwent follow-up scans at 6 months to monitor longitudinal changes in spinal cord atrophy.

Results: Spinal cord morphometric data were normalized against the healthy population morphometry (PAM50 database) and extracted for all participants. DCM patients showed a notable reduction in CSA, AP, and RL diameter across all vertebral levels compared to HC. MSCC metrics correlated significantly with clinical scores like dexterity, grip strength, and mJOA scores. Longitudinal analysis indicated a decrease in CSA and worsening clinical scores in DCM patients.

Conclusion: Our processing pipeline offers a reliable method for assessing spinal cord compression in DCM patients. Normalized spinal cord morphometrics, particularly the CSA could have potential for monitoring DCM disease severity and progression, guiding treatment decisions. Furthermore, to our knowledge our study is the first to apply the generic spinal cord acquisition protocol, ensuring consistent imaging across different MRI scanners and settings. Coupled with our semiautomated analysis pipeline, this protocol is key for the detailed morphometric characterization of compressed spinal cords in patients with DCM, a disease that is both complex and heterogenous. This study was funded by the National Institute of Neurological Disorders and Stroke (NINDS) (K23:NS091430) and (R01: NS129852-01A1).

Keywords: Atrophy; Degenerative cervical myelopathy; Generic spine protocol; MRI; Spinal Cord Toolbox; Spinal cord.


Conflict of interest statement

Declaration of competing interest One or more of the authors declare financial or professional relationships on ICMJE-TSJ disclosure forms.

Figures

Figure 1.
Figure 1.. Preprocessing pipeline for spinal cord morphometric estimation in a compressed spine in DCM.
(A) Spine generic protocol used to obtain T2w image in HC and DCM participants. (B) Automatic spinal cord segmentation using sct_deepseg-sc and manual correction (where necessary). (C) Vertebral labelling identified automatically using the sct_label vertebrae (D) Manual detection of region(s) of compression for computing the normalized spinal cord compression morphometrics (E) Computation of normalized maximum spinal cord compression (MSCC), this process involves estimation of the AP diameters at the MCL (red), 10mm above and below the MCL (green). These measures are normalized using an average value across healthy individuals to estimate MSCC (as described by Bedard et al 2023 (F) Illustrations of the morphometric measures extracted during this pipeline. Illustration adapted from the SCT website csa-and-other-shape-metrics.
Figure 2.
Figure 2.. Morphometric Analysis of the Cervical Spinal Cord in DCM and HC.
Plots show the computed morphometric measures for each axial slice of the cervical spinal cord, utilizing spinal cord segmentation masks. The morphometric data, including cross-sectional area (CSA), anteroposterior (AP) and transverse (RL) diameters, eccentricity, and solidity, were linearly interpolated and normalized to the PAM50 template space. This normalization accounts for variations due to age, sex, and intervertebral differences. The displayed results are averages across different slices from each vertebral level (C1-T1). (A-E) Comparison of mean and standard error of the mean (SEM) of the spinal cord CSA, AP, RL, eccentricity, and solidity between Healthy Controls (HC, blue) and DCM patients (red), across vertebral levels. The mean and SEM are plotted for each level. Non-overlapping confidence intervals indicate statistical significance between HC and DCM patients at specific vertebral levels. Troughs in the plots indicate more pronounced compression at intervertebral disc levels in DCM. Black and red dotted lines highlight the alignment in the changes of different morphometric measures at the same vertebral level. (F-J) The violin plots show the regional morphometric measures between HC and DCM patient severity groups, classified based on the mJOA score. The analysis utilized ANOVA followed by Tukey’s method for multiple comparisons. The asymmetry of the violin plots reflects the distribution of the measures within each group, indicating the morphometric variability between HCs and different patient severity groups. HC, healthy control, mild; mJOA (15–17), moderate (mJOA 12–14), and severe (mJOA 0–11).
Figure 3.
Figure 3.. Cervical spinal cord compression frequency and severity patterns illustrating the distribution and intensity of compression in DCM patients.
(A) The frequency distribution of spinal cord compression at each vertebral level. Bar graphs show a predominant frequency of compression at the C5 level, followed by C6, and then C4. Lower frequencies of compression observed at C3 and C7 levels. The frequency data is based on the actual count of compression levels per patient, and the aggregate data of the entire DCM cohort are displayed. (B) Violin plots show the severity of spinal cord compression (MSCC-CSA) across different cervical vertebral levels. The plots highlight that the greatest severity of compression is observed at C6, with a median MSCC-CSA=47.47mm2. The width of the plots at each level reflects the distribution of severity scores. MSCC, maximum spinal cord compression.
Figure 4.
Figure 4.. Correlation Between Maximum Spinal Cord Compression (MSCC) Measures and Clinical Scores in DCM.
Scatterplots illustrates the relationships between MSCC morphometric measures (cross-sectional area, CSA; anteroposterior (AP) diameter, and transverse (RL) diameter) and various clinical assessments. The scatter plots are organized as follows: (A) Dexterity Score, (B) Grip Strength, (C) Balance, (D) Gait Speed, and (E) mJOA scores. A significant negative correlation is observed between the MSCC (CSA) and dexterity scores in DCM patients. Grip strength shows a significant negative correlation with the MSCC (AP), and the mJOA scores negatively correlated with an increase in MSCC (CSA) measures.
Figure 5:
Figure 5:. Longitudinal Cohort Analysis:
Comparison of change in CSA in HC and DCM Patients (A) Longitudinal assessment of CSA in the HC cohort (n=4), evaluated at two time points - initial (baseline in black) and after a 6-month interval (blue). HC exhibited minimal variation in CSA values throughout the cervical spinal cord. (B) longitudinal CSA evaluations in the DCM patient cohort (n=7), conducted at baseline (black) and at a 6-month follow-up (red), revealed a progressive decrease in CSA, notable at the C4, C5, and C5-C6 levels. The bar graphs represent the mean CSA, with SEM across cervical vertebral levels in HC (C) and DCM (D) cohorts. (E) A plot showing the rate of CSA change within the cervical spinal cord for both HC (blue) and DCM (red). The rate was quantified as the annualized change (6-month follow-up CSA - baseline CSA) / 0.5 year), highlighting an accelerated decline in CSA among DCM patients (n=7) relative to HCs (n=4). (F) Bar graphs show the alteration in mJOA scores between baseline and the 6-month interval for both HC and DCM subjects, illustrating the clinical progression in DCM patients.

References

    1. Tetreault L, Kalsi-Ryan S, Benjamin D, et al. Degenerative Cervical Myelopathy: A Practical Approach to Diagnosis. Global Spine J. Oct 2022;12(8):1881–1893. doi: 10.1177/21925682211072847 - DOI - PMC - PubMed
    1. Tetreault L, Goldstein CL, Arnold P, et al. Degenerative Cervical Myelopathy: A Spectrum of Related Disorders Affecting the Aging Spine. Neurosurgery. Oct 2015;77 Suppl 4:S51–67. doi: 10.1227/neu.0000000000000951 - DOI - PubMed
    1. Tetreault L, Kopjar B, Nouri A, et al. The modified Japanese Orthopaedic Association scale: establishing criteria for mild, moderate and severe impairment in patients with degenerative cervical myelopathy. Eur Spine J. Jan 2017;26(1):78–84. doi: 10.1007/s00586-016-4660-8 - DOI - PubMed
    1. Martin AR, De Leener B, Cohen-Adad J, et al. Can microstructural MRI detect subclinical tissue injury in subjects with asymptomatic cervical spinal cord compression? A prospective cohort study. BMJ Open. Apr 13 2018;8(4):e019809. doi: 10.1136/bmjopen-2017-019809 - DOI - PMC - PubMed
    1. Cloney MB, Smith ZA, Weber KA 2nd, Parrish TB. Quantitative Magnetization Transfer MRI Measurements of the Anterior Spinal Cord Region are Associated With Clinical Outcomes in Cervical Spondylotic Myelopathy. Spine (Phila Pa 1976). May 15 2018;43(10):675–680. doi: 10.1097/brs.0000000000002470 - DOI - PMC - PubMed