. 2024 Oct;17(5):1029-1044.
doi: 10.1016/j.mucimm.2024.07.003. Epub 2024 Jul 20.

Inducible pluripotent stem cells to study human mast cell trajectories

Affiliations

Inducible pluripotent stem cells to study human mast cell trajectories

Gila Idelman et al. Mucosal Immunol. 2024 Oct.

Abstract

Mast cells (MCs) are derived from CD34+ hematopoietic progenitors, consist of different subtypes, and are involved in several inflammatory conditions. However, our understanding of human MC developmental trajectories and subtypes has been limited by a scarcity of suitable cellular model systems. Herein, we developed an in vitro model of human MC differentiation from induced pluripotent stem cells (iPSC) to study human MC differentiation trajectories. Flow cytometry characterization of hemopoietic cells derived from the myeloid cells-forming complex (MCFC) revealed an initial increase in Lin- CD34+ hematopoietic progenitors within Weeks 1-3, followed by an increase in CD34- CD45RA- SSClow and SSChigh hematopoietic cells. The Lin- CD34+ hematopoietic progenitors consisted of SSClow CD45RA- CD123± c-Kit+ FcεRI+ populations that were β7-integrinhigh CD203c+ and β7-integrinhigh CD203c- cells consistent with CMPFcεRI+ cells. Flow cytometry and cytologic analyses of the CD34- Lin- (SSClow) population revealed hypogranular cell populations, predominantly characterized by CD45RA- CD123± c-Kit+ FcεRI- β7-integrinlow and CD45RA- CD123± c-Kit- FcεRI+ β7-integrinMid cells. Analyses of hypergranular SSChigh cells identified Lin- CD34- CD45RA- c-Kit+ FcεRI- and Lin- CD34- CD45RA- c-Kit+ FcεRI+ cells. scRNA-seq analysis of the cells harvested at week 4 of the MCFC culture revealed the presence of monocyte and granulocyte progenitors (n = 547 cells, 26.7 %), Erythrocyte / unknown (n = 85, 4.1 %), neutrophils / myelocytes (n = 211 cells, 10.2 %), mast cell progenitor 1 (n = 599, 29.1 %), mast cell progenitor 2 (n = 152, 7.4 %), committed mast cell precursor (n = 113, 5.5 %), and MCs (n = 353, 17.1 %). In silico analyses of the MC precursor and mature MC populations revealed transcriptionally distinct MC precursor subtype and mature MC states (CMA1+ and CMA1- subtypes). Culturing MC precursor populations in MC maturation media (mast cell media II) led to homogenous mature MC populations as evidenced by high expression of high-affinity IgE receptor, metachromatic granules, presence of MC granule proteins (Tryptase and Chymase) and activation following substance P stimulation and FcεRI crosslinking. This human iPSC-based approach generates MC precursors and phenotypically mature and functional MC populations. This system will be a useful model to generate human MC populations and broaden our understanding of MC biology and transcriptional regulation of MC differentiation trajectories.

Keywords: Induced pluripotent stem cell; Mast cell; Mast cell precursors.


Conflict of interest statement

Declaration of Competing Interest The authors declare that they have no known competing financial interests or personal relationships that could have appeared to influence the work reported in this paper.

Figures
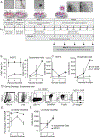
Fig. 1.
Fig. 1.. Five-step Differentiation Protocol for Human iPSC to Mast Cells.
A. Schematic representation of the five-step differentiation protocol. Step 1: human iPSCs were cultured on irradiated mouse CF-1 fibroblasts. Step 2: EB formation was prompted by culturing lifted colonies on an ultra-low attachment plate. Step 3: Formation of myeloid cells forming complex (MCFC). After five days, EBs were manually picked and transferred to the gelatin-coated plates (25–30 EBs per well) in Mast Media I supplemented with IL3 / SCF / IL6 / Flt3. Step 4: Generation of hematopoietic progenitors by MCFC complex. Step 5: Maturation of the cells harvested in step 4 in Mast Media II supplemented with SCF/IL-6. B and C. Percentage and total cell number of live cells and Lin- CD34+ progenitors retained within the MCFC and released suspended MCFC cells analyzed by flow cytometry during step 3. D. Gating strategy identifying Lin- CD34+ CD45RA- CD123−/+ hematopoietic stem cells (HSC), common myeloid progenitor cells (CMPs) and CMP FcεRI+ cells (Lin- CD34+ CD45RA- CD123−/+ c-Kit- FcεRI+, β7-integrinhigh CD203c+). E and F. Percentage and total cell number of Lin- CD34+ CD45RA- cells released from the MCFC and retained within MCFC during MCFC formation and maintenance. B, E and F. Data represent mean ± SD from n = 3–4 independent cultures. C. * P < 0.05 and ** P < 0.01.
Fig. 2.
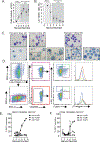
Fig. 2.. Flow cytometric characterization of cell populations within the MCFC culture in Mast Cell Media I.
(A.) Total cell numbers and (B.) percentage of Lin- CD34+ cells released from the MCFC from Harvests 1 – 6. Numbers represent number of cells per well from 2 to 3 independent experiments. C. Representative cytospin images of the cells harvested on Harvests 2 (Day 32), 4 (Day 45), and 7 (Day 67) stained with Diff Quick (Top panel) and Toluidine blue (bottom panel). Magnified images of cytospins stained with Toluidine Blue showing granules: black metachromatic granules indicate immature basophils (Day 45) and blue metachromatic granules indicate mast cells (Day 67). D. Gating strategy for identification of basophil / mast cell precursor and mature populations within the CD34- SSClow (pink box) or CD34- SSChigh (red box) populations within the suspended cells released from MCFC. Live CD34- SSClow (pink box) or CD34- SSChigh (red box) cells that were CD45RA- CD123+ were distinguished by c-Kit and FcεRI expression and level of β7 integrin expression determined on c-Kit+ FcεRI- (blue box), c-Kit+ FcεRI+ (green box) and c-Kit- FcεRI+ (brown box) populations. E and F. Quantification of the percentage (%) of Lin- CD34- CD45RA- CD123−/+ SSClow and Lin- CD34- CD45RA- CD123−/+ SSChigh cells that were c-Kit+ FcεRI-, c-Kit+ FcεRI+, c-Kit- FcεRI+ through the culture progression from Harvest 1–9. A and B Numbers represent (mean ± SD) number of cells per well from 2 to 3 independent experiments. E and F Data represents mean ± SD from n = 3–4 independent cultures.
Fig. 3.
Fig. 3.. Single-cell RNA sequencing analysis of MCFC-derived suspended cells and characterization of MC precursor populations.
A. UMAP representation of the mRNA expression of 2060 cells from the cell culture profiled with scRNA-seq. Cell populations were identified by Find Clusters function in Seurat (Represented in different colors). (B.) Heatmap showing differentially expressed hematopoietic transcripts by cell type identified through validated datasets (Immunological Genome Project (ImmGen) GSE37448 and PanglaoDB). Suspended cells from Harvest 4 in Mast Cell Media I were used for scRNA-seq analyses. (C.) UMAP plot showing basophilic (CLC, Il4, and CCR3) and MC lineage (GATA2, MS4A2, HDC, ITGB7, IL3RA, and CEBPA) and maturation (TPSAB1, CTSG, and HSPG2) markers on the seven clusters. (D.) Venn diagram representing common and unique expressed genes with raw count > 1 in MCp1 (blue; gene expression raw count > 1, pct1 > 0.50; 1266) and MCp2 (purple; gene expression raw count > 1, pct1 > 0.50; 977) clusters. (E). Heatmap of top 50 DEGs between MCp1 and MCp2 clusters (Wilcoxon Rank Sum Test pct1 > 0.25, Log2 FC > 1 and p adjusted value p < 0.05). (B and E). Color in the heatmap and UMAP plots represents expression intensity with yellow signifying higher expression in units of z-score.
Fig. 4.
Fig. 4.. Identification of CMA1+ and CMA1- MC states and differentiation and trajectory inference of MC clusters.
(A). UMAP representation of seven clusters and secondary subclustering identifying MC subcluster 1 (CMA1+) and MC subcluster 2 (CMA1-) MC states. (B). Venn diagram representing common and unique expressed genes with a raw count >1 in MC cluster 1 (green; gene expression raw count > 1, pct1 > 0.50; 3562) and MC subcluster 2 (blue; gene expression raw count > 1, pct1 > 0.50; 3310) states. C. Heatmap of Top 54 DEGs between MC subcluster 1 (CMA1+) and MC cluster 2 (CMA1-) states. (Wilcoxon Rank Sum Test pct1 > 0.25, Log2 FC > 1 and p adjusted value p < 0.05). D. Violin plots showing expression of basophil / MC specific genes (CLC, ITGB7, CTSG, TPSAB1, and CMA1) in MC progenitor 1, MC progenitor 2, committed MC precursor, CMA1+, and CMA1- MC states (log2 gene expression). (E). Visualization of pseudotime projected onto MC associated UMAP clusters and subclusters. Black lines indicate two trajectory inferences that we defined by their transcriptional end state, CMA1+ and CMA1-. Color in the heatmap represents pseudotime with the color yellow representing values later in pseudotime.. (F). Single-cell gene expression for KIT, FCER1A, MS4A2, CPA3, TPSAB1, CMA1, ALOX15, SOX4, and IL1R1) in CMA1+ and CMA1- MC trajectories across cell states along the pseudotime time by Tradeseq. Each dot represents a single cell within the defined UMAP clusters / subclusters: MC progenitor 1, MC progenitor 2, committed MC precursor, CMA1+ and CMA1- identified in (A). (C). Color in the heatmap represents expression intensity with yellow signifying higher expression in units of z-score. (F). Color coding of each dot represents cells predicted development along the CMA1+ and CMA1- MC developmental trajectory along pseudotime..
Fig. 5.
Fig. 5.
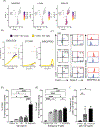
MC media II induced iPSC-derived MC maturation. A. Representative flow cytometry plots of c-Kit FcERI expression on CD45RA- SSChigh and CD45RA- SSClow cells at Harvest 6 in mast cell media I and Harvest 6 cells following 5 weeks in MC media II. B. % of c-Kit+ FcERI+ CD45RA- SSChigh and CD45RA- SSClow cells following 0–13-week culture in Mast Cell media II. C. Representative confocal images of cytospin preparations of cells suspended in MC media I from Harvests 4 & 7 and cells suspended in MC media II for 4 weeks (harvested at week 5). Samples were either co-stained for Tryptase and Chymase or histologically stained with H&E and Toluidine blue (MC media I – weeks 3 & 7 and MC media II – week 7). (Scale Bar indicates 20 μm). A. and C. representative of n = 3–4 independent cultures. B. Data represents mean ± SD from n = 3 independent cultures. D. and E. represents mean ± SD.
Fig. 6.
Fig. 6.. Expression of SIGLEC6, L1CAM and MRGPRX2 and IgE- and Substance P-induced degranulation of iPSC-derived MCs.
(A.) mRNA expression superimposed on the UMAP plot for SIGLEC6, L1CAM, and MRGPRX2. Color in the heatmap represents expression intensity with red signifying higher expression in units of z-score. (B). Gene expression of SIGLEC6, L1CAM, and MRGPRX2 in MC cluster 1 (CMA1+) and MC cluster 2 (CMA1-) trajectories across cell states along pseudotime. Each dot represents a single cell identified from clusters (MC progenitor 1, MC progenitor 2, committed MC precursor, CMA1+ and CMA1- MC states). Color coding of each dot represents a cell’s predicted gene expressionalong the CMA1+ and CMA1- MC developmental trajectory across pseudotime. (C). Gating strategy for identification of SIGLEC6, CD171, and MRGPRX2 expression on c-Kit+ FcεRI+ cells within the suspended cells released from MCFC. Live CD34- c-Kit+ FcεRI+ cells (black box) were distinguished by SIGLEC6 and CD171 expression, SIGLEC6+ CD171+ (red box) and SIGLEC6+ CD171- (blue box). Mean Fluorescence intensity level of MRGPRX2 expression was determined on SIGLEC6+ CD171+ cells (red histogram) and SIGLEC6+ CD171- (blue histogram).. Percentage of degranulation for iPSC-derived cells as determined by β-hexosaminidase release following Antigen-dependent (IgE) (D.) and Antigen-independent activation (Substance P) (E.) Percent degranulation is calculated as (D. and E.) fraction of β-hexosaminidase activity in supernatant from stimulated cell, as compared to total hexosaminidase activity from lysed cells and (F.) Percent frequency CD63+ CD107a+ MCs (SSChigh c-Kit+ FcERI+). IgE-dependent and independent degranulation assays were performed on iPSC-derived cells following 4 weeks of exposure to MC Media II. A. and C. representative of n = 3–4 independent cultures. B. Data represents mean ± SD from n = 3 independent cultures. D.- F. represents mean ± SD. Representative data from 6 experimental replicates across 4 different harvests (MM2) and 2 cell lines (D.) Representative data from 2 experimental replicates across 2 cell lines (E. & F.).

References

    1. Shah K, Ignacio A, McCoy KD, Harris NL. The emerging roles of eosinophils in mucosal homeostasis. Mucosal Immunol. 2020;13(4):574–583. - PubMed
    1. Eissmann MF, Buchert M, Ernst M. IL33 and Mast Cells-The Key Regulators of Immune Responses in Gastrointestinal Cancers? Front Immunol. 2020;11:1389. - PMC - PubMed
    1. Varricchi G, Marone G, Kovanen PT. Cardiac Mast Cells: Underappreciated Immune Cells in Cardiovascular Homeostasis and Disease. Trends Immunol. 2020;41(8): 734–746. - PubMed
    1. Rothenberg ME, Hogan SP. The eosinophil. Annu Rev Immunol. 2006;24:147–174. - PubMed
    1. Méndez-Enríquez E, Hallgren J. Mast Cells and Their Progenitors in Allergic Asthma. Front Immunol. 2019;10:821. - PMC - PubMed