. 2024 Jul 22;15(1):6012.
doi: 10.1038/s41467-024-49963-x.

Methanogenic patterns in the gut microbiome are associated with survival in a population of feral horses

Affiliations

Methanogenic patterns in the gut microbiome are associated with survival in a population of feral horses

Mason R Stothart et al. Nat Commun. .

Abstract

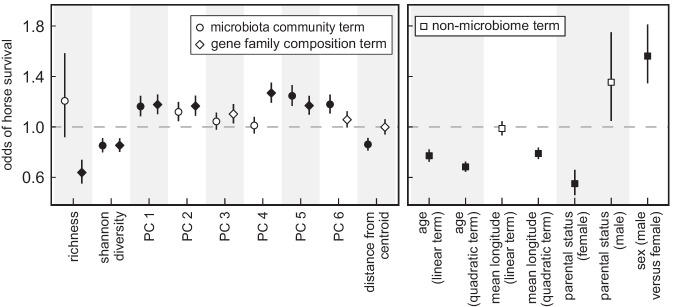
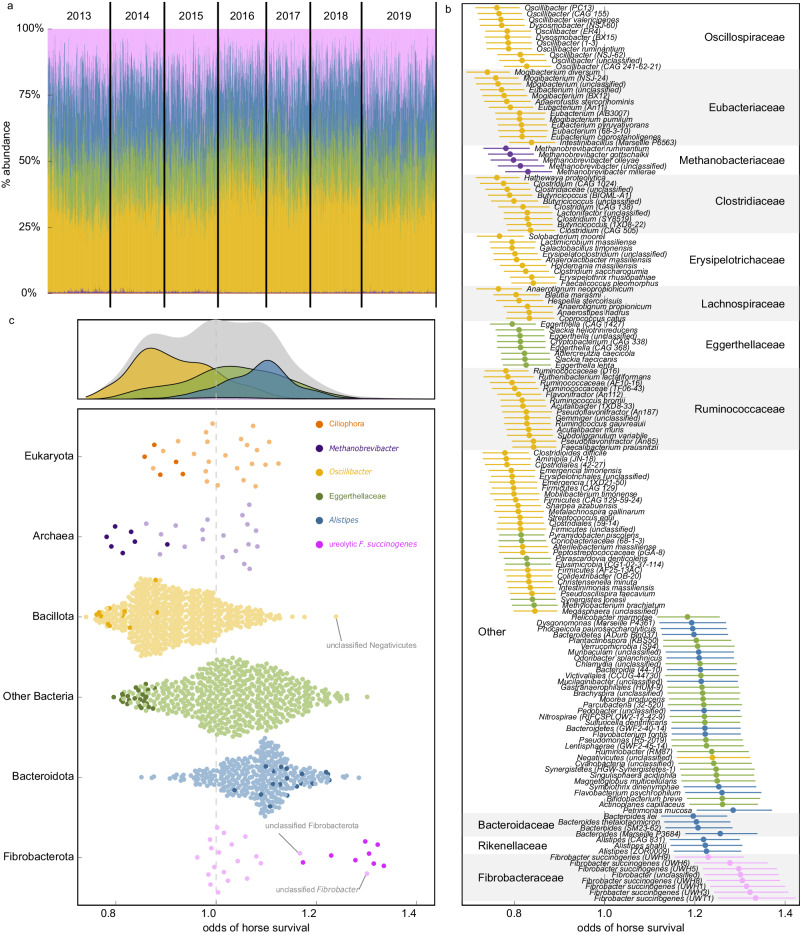
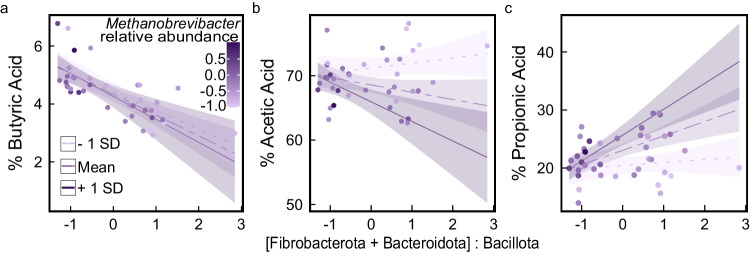
Gut microbiomes are widely hypothesised to influence host fitness and have been experimentally shown to affect host health and phenotypes under laboratory conditions. However, the extent to which they do so in free-living animal populations and the proximate mechanisms involved remain open questions. In this study, using long-term, individual-based life history and shallow shotgun metagenomic sequencing data (2394 fecal samples from 794 individuals collected between 2013-2019), we quantify relationships between gut microbiome variation and survival in a feral population of horses under natural food limitation (Sable Island, Canada), and test metagenome-derived predictions using short-chain fatty acid data. We report detailed evidence that variation in the gut microbiome is associated with a host fitness proxy in nature and outline hypotheses of pathogenesis and methanogenesis as key causal mechanisms which may underlie such patterns in feral horses, and perhaps, wild herbivores more generally.


Conflict of interest statement

The authors declare no competing interests.

Figures

Fig. 1
Fig. 1. A map of Sable Island (Nova Scotia, Canada) with representative photographs of the landscape.
Sample collection locations marked with orange points and a dashed vertical line indicated the easternmost portion of Sable Island which has been submerged since 2017. Photos © Mason R. Stothart. Source data are provided as a Source Data file.
Fig. 2
Fig. 2. Relationships between Sable Island horse survival and composite fecal microbiome, life history, or environmental terms.
Points denote effect estimates from generalized linear mixed models ( ± standard error bars) and describe relationships between the odds of overwinter survival and categorical variables, or the expected effect of a one standard deviation increase in the magnitude of continuous variables. Principal components (PCs) obtained from Aitchison distance ordinations. Distance from centroid denotes the Aitchison distance separating samples from the within-year centroid. Closed points denote statistically significant effects among models which included 2394 samples from 794 individuals. Source data are provided as a Source Data file.
Fig. 3
Fig. 3. Fecal microbiome associations with Sable Island horse survival.
a Stacked bar plot in ascending order of collection date and colored by coarse taxonomic groupings described in panel ‘c’, b Generalized linear mixed model estimated effects of a one standard deviation increase in the centered log ratio (CLR) transformed abundance of microbiota on the odds of horse overwinter survival, colored by taxonomic groupings presented in panel ‘c’. Points denote microbiota-specific estimates ± standard error bars estimated from analysis of 2394 samples from 794 individuals. Only significant effects after FDR adjustment displayed, c Generalized linear mixed model estimated effects of a one standard deviation increase in the CLR-transformed abundance of microbiota on the odds of horse overwinter survival, with points representing microbiota-specific estimates. Source data are provided as a Source Data file.
Fig. 4
Fig. 4. Percent short-chain fatty acid contents relative to an interaction between Methanobrevibacter and the ratio of Fibrobacterota and Bacteroidota to Bacillota relative abundance.
[Fibrobacterota + Bacteroidota]:Bacillota versus (a) % butyric acid, (b) % acetic acid, and (c) % propionic acid, including interactions with Methanobrevibacter relative abundance (log-transformed, centered and variance standardized). Model predicted lines denote the effect that the mean (purple irregular dashed line), one standard deviation (SD) decrease (light purple dotted line), or one SD increase (dark purple solid line) in Methanobrevibacter log-transformed relative abundance has on the relationship between [Fibrobacterota + Bacteroidota]:Bacillota and % SCFA with 95% confidence interval shading. Source data are provided as a Source Data file.
Fig. 5
Fig. 5. Relationships between ureolytic Fibrobacter succinogenes strains, select microbial gene families, and short-chain fatty acid (SCFA) content within the Sable Island horse fecal microbiome.
Fibrobacter relative abundance versus (a) cellulase, (b) urease, (c) phosphoenolpyruvate carboxykinase, (d) phosphate acetyltransferase, and e methane monooxygenase gene hit relative abundance (centered and variance standardized) with dashed 1:1 line. Points colored by the % of reads mapped to F. succinogenes that belonged to ureolytic strains. f Proportion of Fibrobacter reads mapped to ureolytic strains of F. succinogenes versus total SCFA concentration within fecal samples. Solid line denotes the line of best fit with 95% confidence interval shading, omitting a statistically significant outlier with abnormally low Fibrobacter relative abundance (<2%; outlier point shown). Points colored by log-transformed Fibrobacter relative abundance. Source data are provided as a Source Data file.
Fig. 6
Fig. 6. Total short-chain fatty acid (SCFA) concentration in the Sable Island horse fecal microbiome modeled as a response to an interaction between Methanobrevibacter and phosphate acetyltransferase gene hit abundance.
Methanobrevibacter relative abundance estimates were log-transformed, centered, and variance standardized. Model predicted lines denote the effect that the mean (brown irregular dashed line) and a one standard deviation (SD) decrease (green dotted line) or increase (magenta solid line) in phosphate acetyltransferase gene relative abundance has on the relationship between Methanobrevibacter relative abundance and total SCFA content, with 95% confidence interval shading. Source data are provided as a Source Data file.
Fig. 7
Fig. 7. Patterns of repeatability and multi-year change in the Sable Island horse fecal microbiome in the years preceding horse death.
a Within-individual repeatability of microbe centered log ratio (CLR) transformed abundance estimates relative to the estimated effect of a one standard deviation increase in the CLR-transformed abundance of microbiota on the odds of overwinter survival. Points denote taxa-specific model estimates and the solid black line shows the best fit quadratic relationship with 95% confidence interval shading. b Residual Clostridium, Methanobrevibacter, Methanomethylophilus alvus, and Ciliophora centered and variance standardized CLR-transformed abundance in the years preceding horse death. Points denote the mean value ± standard error bars. Residual abundance estimates derived from general linear mixed models containing 1127 fecal samples from 418 individuals that died over winter between 2013 and 2022, and terms for age (2nd order polynomial), longitude of sample collection (2nd order polynomial), date, sex, and a sex × parental status interaction as fixed effects, as well as year and horse identity as random effects. Source data are provided as a Source Data file.

References

    1. Lynch, J. B. & Hsiao, E. Y. Microbiomes as sources of emergent host phenotypes. Science365, 1405–1409 (2019). 10.1126/science.aay0240 - DOI - PubMed
    1. Kohl, K. D. & Carey, H. V. A place for host-microbe symbiosis in the comparative physiologist’s toolbox. J. Exp. Biol.219, 3496–3504 (2016). 10.1242/jeb.136325 - DOI - PubMed
    1. Alberdi, A., Aizpurua, O., Bohmann, K., Zepeda-Mendoza, M. L. & Gilbert, M. T. P. Do vertebrate gut metagenomes confer rapid ecological adaptation? Trends Ecol. Evol.31, 689–699 (2016). 10.1016/j.tree.2016.06.008 - DOI - PubMed
    1. Zaneveld, J. R., McMinds, R. & Vega Thurber, R. Stress and stability: Applying the Anna Karenina principle to animal microbiomes. Nat. Microbiol2, 1–8 (2017). 10.1038/nmicrobiol.2017.121 - DOI - PubMed
    1. Henry, L. P., Bruijning, M., Forsberg, S. K. G. & Ayroles, J. F. The microbiome extends host evolutionary potential. Nat. Commun.12, 1–13 (2021). 10.1038/s41467-021-25315-x - DOI - PMC - PubMed

LinkOut - more resources