. 2024 Jul 22;15(1):6162.
doi: 10.1038/s41467-024-50441-7.

Senescent cancer-associated fibroblasts in pancreatic adenocarcinoma restrict CD8+ T cell activation and limit responsiveness to immunotherapy in mice

Affiliations

Senescent cancer-associated fibroblasts in pancreatic adenocarcinoma restrict CD8+ T cell activation and limit responsiveness to immunotherapy in mice

Benjamin Assouline et al. Nat Commun. .

Abstract

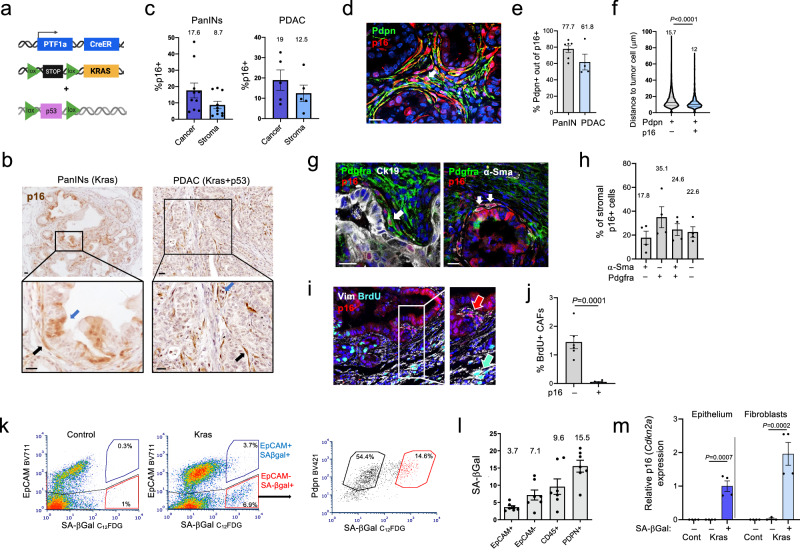
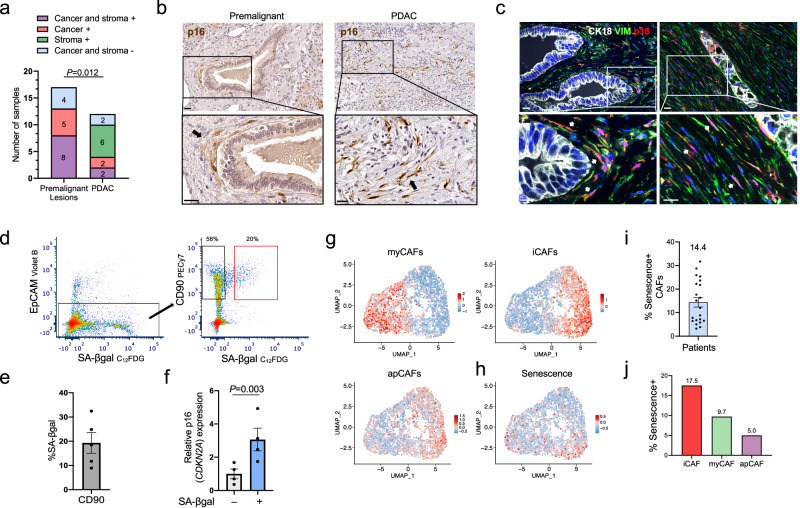
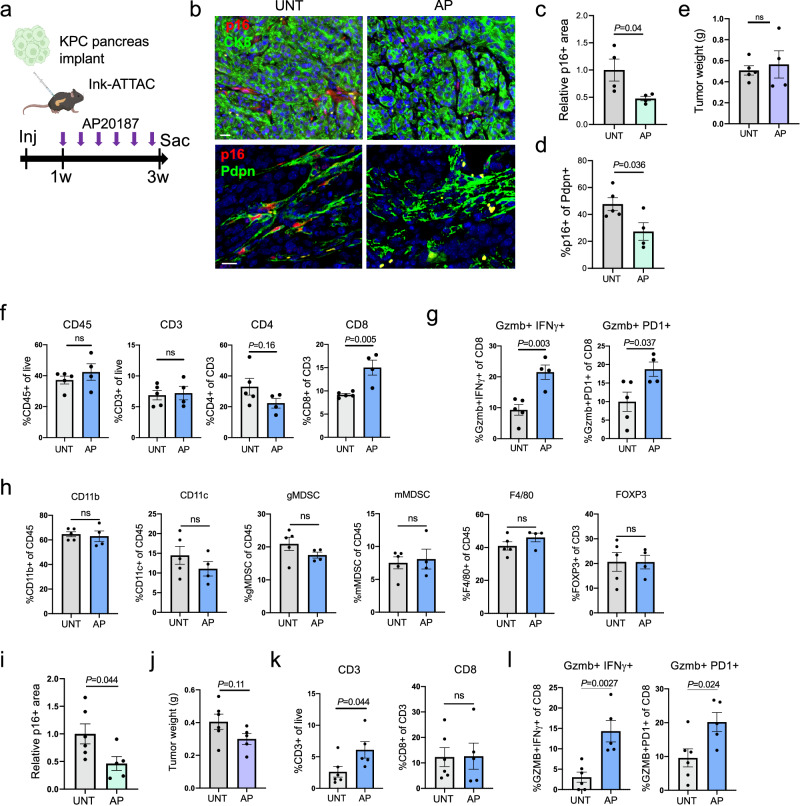
Senescent cells within tumors and their stroma exert complex pro- and anti-tumorigenic functions. However, the identities and traits of these cells, and the potential for improving cancer therapy through their targeting, remain poorly characterized. Here, we identify a senescent subset within previously-defined cancer-associated fibroblasts (CAFs) in pancreatic ductal adenocarcinomas (PDAC) and in premalignant lesions in mice and humans. Senescent CAFs isolated from mouse and humans expressed elevated levels of immune-regulatory genes. Depletion of senescent CAFs, either genetically or using the Bcl-2 inhibitor ABT-199 (venetoclax), increased the proportion of activated CD8+ T cells in mouse pancreatic carcinomas, whereas induction of CAF senescence had the opposite effect. Combining ABT-199 with an immune checkpoint therapy regimen significantly reduced mouse tumor burden. These results indicate that senescent CAFs in PDAC stroma limit the numbers of activated cytotoxic CD8+ T cells, and suggest that their targeted elimination through senolytic treatment may enhance immunotherapy.


Conflict of interest statement

B.Z.S. receives sponsored research support from Boehringer-Ingelheim and Revolution Medicines and holds equity in iTeos Therapeutics. T.G. Receives research support from Astra Zeneca, Abbvie honoraria, consultation fees from Abbvie and MSD Merck, royalties and consultant fees from Curesponse, and speaker fees from Abbvie and ClearNote Health. The remaining authors declare no competing interests.

Figures

Fig. 1
Fig. 1. Senescent CAFs are present in mouse pancreatic cancer lesions.
a Diagram of mouse lines used for the generation of premalignant and malignant pancreatic carcinomas. b Stain for the senescence marker p16 in sections of PanIN lesions and PDAC from the indicated mice. Blue arrows indicate p16+ epithelial cells, black arrows indicate p16+ stromal CAFs. c Percentages of p16+ cells in epithelial (cancer) and stromal compartments of pancreatic lesions in Kras and Kras+p53 mice (PanINs and PDAC respectively), measured by image analysis. n = 10 PanIN, n = 5 PDAC individual lesions. d Co-stain of pancreatic lesions from Kras-activated mice for p16 and Pdpn, which marks stromal CAFs. e Percentages of Pdpn+ cells out of stromal p16+ cells in PanIN (n = 6) and PDAC (n = 4) lesions. f Distances of p16-negative (n = 6811) and p16+ (n = 898) Pdpn+ CAFs to nearest cancer cell in three mouse tumors. Numbers indicate means, lines indicate median and quartiles. t test. g Co-stains of pancreatic lesions from Kras-activated mice for p16, Pdgfra, α-Sma and CK19 marking epithelial cells, as indicated. Arrows indicate examples of p16+ Pdgfra+ CAFs and α-Sma+ CAFs. h Percentages of cells expressing Pdgfra, α-Sma, both, or neither, out of stromal p16+ cells in Kras-driven lesions. n = 4 tumors. i Co-stain of pancreatic lesions for vimentin (Vim), marking fibroblasts, with p16 and BrdU, labeling proliferating cells. Cyan and red arrows indicate proliferating p16- CAFs and non-proliferating p16+ CAFs, respectively. j Percentage of BrdU+ cells among p16-negative and p16+ CAFs, identified by Pdpn stain. n = 4 tumors. k FACS analysis of dissociated pancreatic lesions from Kras-activated mice. Left panels show stain for the senescence marker SA-βGal and the epithelial marker EpCAM, in control and in Kras-activated mice (Kras). Gates indicate %SA-βGal+ of EpCAM+ and EpCAM- fractions. Panel on right shows SA-βGal stain of Pdpn+ CAFs (EpCAM-, CD45-, CD31-). Values indicate percentage of SA-βGal- and SA-βGal+ cells out of Pdpn+ cells. l Percentages of SA-βGal+ cells within indicated cell fractions from Kras mouse pancreata, analyzed by FACS. n = 7 mice. m mRNA levels of p16 (Cdkn2a) measured by qRT-PCR in SA-βGal- and SA-βGal+ cell fractions of epithelial and fibroblast cells isolated from Kras-activated or control (Cont) mice. n = 4 samples from two mice. t test. Scale bars = 20 μm. In fluorescent images blue labels DNA. Graphs in (c, e, h, j, l, m) indicate mean ± SEM.
Fig. 2
Fig. 2. Senescent CAFs are present in human pancreatic cancer lesions.
a Numbers of human premalignant lesions and PDACs in which p16+ cells were detected in the tumor or stromal compartments, in both, or in neither, as indicated. P value, Chi-squared, refers to the difference in distribution between the lesion types. b Sections of human premalignant (low grade PanIN) (left) and PDAC (right) samples, stained for p16, as scored in panel a. Black arrows indicate p16+ CAFs. c Co-stain of human PDAC sections for p16, the epithelial marker CK18, and vimentin (VIM), as scored in (a). Arrows indicate p16+ CAFs. d FACS isolation of SA-βGal- and SA-βGal+ CAFs from a representative human PDAC sample. CD90 marks fibroblasts. Plot on right is gated for EpCAM-CD45- cells. Gate values are calculated out of CD90+ fraction. e Average percentage of SA-βGal+ cells in CAFs from different patients. Mean of n = 5 tumors ± SEM. f Levels of p16 (CDKN2A) mRNA in matched SA-βGal- and SA-βGal+ CAFs isolated from human PDAC patients. Mean of n = 4 tumors ± SEM. t test. g UMAPs showing a scRNA-seq cluster of 3492 individual PDAC CAFs from 21 patients, obtained from ref. . Red color indicates the relative scores of iCAF, myCAF and apCAF expression signatures in individual CAFs. h UMAP of same CAFs, indicating relative expression score of the senescence signature. i Percentage of CAFs scoring positive for the senescence signature in each of the individual subjects included in the scRNA-Seq analysis. Mean of n = 21 patients ± SEM. j Percentages of CAFs classified to the indicated subtypes which score positive for the senescence signature. Scale bars = 20 μm.
Fig. 3
Fig. 3. Senescent CAFs express elevated levels of immune regulatory genes.
a Gene sets up- and down-regulated in SA-βGal+ CAFs isolated from Kras-activated mouse pancreata, compared to matched SA-βGal- CAFs, as measured by mRNA-seq. x axis indicates -Log10 Padj values, calculated by Metascape with Bonferroni method multiple hypothesis correction. b Selected upregulated genes in the same SA-βGal+ CAFs. y axis indicates fold change relative to SA-βGal- CAFs, as measured by mRNA-seq. Mean of n = 5 tumors ± SEM, differences for all are under a threshold of Padj < 0.1 calculated by DESeq2 (Benjamini-Hochberg FDR correction). c Gene sets upregulated in SA-βGal+ CAFs isolated from human subjects, relative to matched SA-βGal- CAFs. x axis indicates −Log10 Padj values, calculated by Metascape with Bonferroni method multiple hypothesis correction. d SA-βGal staining marking senescence of primary cultured human PDAC CAFs following activation of CreER by 4-OHT (TAM) to eliminate hTERT and LT expression. Scale bar = 20 μm. e Percentage of SA-βGal+ cells in cultured mouse and human CAFs treated or untreated with TAM. Mean of n = 3 replicates ± SEM. t test. f Gene sets enriched in five analyzed datasets comparing senescent to non-senescent CAFs: cells isolated directly from Kras-induced mice, from Kras+p53 mice, or from human patients, and mouse and human CAFs induced to undergo senescence in culture. Colors indicate normalized enrichment scores calculated by GSEA, with positive values indicating increased expression in senescent CAFs. Shown are sets with Padj < 0.25 (Benjamini-Hochberg FDR correction) in at least 3 out of the 5 datasets. NES normalized enrichment score. g Gene sets upregulated in CAFs within the scRNA-seq dataset which score positive for the senescence signature. x axis indicates −Log10 Padj values, calculated by Metascape with Bonferroni method multiple hypothesis correction.
Fig. 4
Fig. 4. CAF senescence correlates with reduced T cell presence in mouse and human PDACs.
a Co-staining of 6422c1 KPC xenograft tumors for p16 together with either Pdpn, marking CAFs, CD31 marking endothelial cells, CD45 marking immune cells, and Mac2, marking macrophages. Images show examples of double-positive cells of each type. b Percentages of cells expressing the indicated lineage markers out of p16+ stromal cells in the 6422c1 KPC xenografts, as shown in panel a. Mean of n = 2–4 tumors as indicated ± SEM. c Sections of tumors that developed from different KPC PDAC lines that were injected into mouse pancreata, stained for p16 (top), or co-stained for p16, CD3, marking T cells, and YFP, marking the cancer cells (bottom). Tumors on left, which developed from the 6555c3 line, show low levels of p16+ CAFs and high T cell numbers, whereas tumors on right, which developed from the 6422c1 and 6499c3 lines, show high levels of p16+ CAFs and low T cell numbers. d Correlation between percentage of p16+ cells out of CAFs, and CD3+ T cell numbers per mm2, in individual tumors grown from distinct KPC lines, quantified by image analysis. R value indicates Pearson correlation with calculated P value, with line indicating linear regression. n = 9 tumors. e Correlation between percentage of Pdpn+ CAFs out of stromal area, and CD3+ T cell numbers per mm2 tumor, in same tumors as in (d). n = 9 tumors. f Images of regions in human PDACs co-stained for p16, CD3, and CK18 marking tumor cells (top) or for CD8 and GZMB (bottom, same regions in sequential sections). Left images show region with low p16+ CAF content and high CD3+ , CD8+ and GZMB+ CD8+ cell numbers; right images show region with high p16+ CAF content and low T cell numbers. Quantifications are provided in (g). g Correlation between percentages of p16+ cells out of VIM+ CAFs in 57 tumor regions in 11 human PDACs, and T cell numbers in same regions, scored by image analysis. y axes in graphs indicate numbers CD3+ , CD8+ or GZMB+ CD8+ T cells per mm2 as indicated; bottom right graph shows percentage of GZMB+ out of CD8+ T cells in y axis. R values indicate Spearman correlation with calculated P value. Scale bars = 20 μm.
Fig. 5
Fig. 5. Induction of CAF senescence reduces rates of activated CD8+ T cells.
a Diagram of experimental procedure: mScarlet-expressing mouse CAFs were co-injected into mouse pancreata with 6555c3 KPC tumor cells. Senescence was induced in CAFs in half of the mice through tamoxifen (TAM) treatment one and three days later, and tissues were collected one week after cell transplantation. b Lesion sections from untreated (-TAM) and tamoxifen-treated ( + TAM) mice, further analyzed in panels c-g, 1 week after co-injection, stained for mScarlet marking the injected CAFs, and for CK8 marking the co-injected KPC cells. c Lesion sections from control and tamoxifen-treated mice stained for CD8. d Quantification of CD8+ T cells in lesions from untreated and tamoxifen treated mice. Values were measured by image analysis and are presented relative to mean of control mice. n = 4 tumors. e Lesion sections from untreated and tamoxifen-treated mice co-stained for CD8 (green) and Gzmb (red). f Percentages of Gzmb+ cells out of CD8+ T cells in lesions from untreated and tamoxifen-treated mice, scored by image analysis. n = 5 tumors. g Quantification of total T cells (CD3+), regulatory T cells (FoxP3+), and monocytes (CD11b+) in same lesions. Values were measured by image analysis and are presented relative to mean of control mice. n = 5 tumors. h Percentage of IFNγ+ and GZMB+ human CD8+ T cells following treatment with conditioned media from non-senescent (Non-sen) or senescent (Sen) human PDAC CAFs, measured by FACS. n = 8 replicates from two experiments. i IFNγ levels secreted by human T cells following treatment with conditioned media from non-senescent or senescent human CAFs, measured by ELISA. n = 4 replicates. j Percentage IFNγ+ Gzmb+ mouse CD8+ T cells following treatment with conditioned media from non-senescent or senescent mouse CAFs, measured by FACS. Where indicated, CAFs were pretreated with IFNγ for 48 h prior to conditioned media collection. n = 3 replicates. All values represent mean ± SEM. Pairwise two-tailed t tests compare senescence to non-senescence in all graphs. Scale bars = 20 μm.
Fig. 6
Fig. 6. Genetic elimination of senescent CAFs in transplanted PDACs leads to increased rates of activated CD8+ T cells.
a Diagram of experimental design. 6422c1 KPC cells, which generate tumors with high endogenous p16+ CAF content, were injected into the pancreata of Ink-ATTAC mice. Mice were treated with AP20187 three times a week during tumor growth. b Sections of tumors formed by KPC cells in mice either untreated (UNT) or treated with AP, co-stained for p16 and with CK8 (top), marking epithelial cells or with Pdpn (bottom), marking CAFs. c Relative stromal p16+ area in tumors formed by the KPC cells, with or without AP treatment. Values were measured by image analysis and normalized to mean of controls. n = 4 tumors, >1 mm2/tumor. d Percentage of p16+ cells out of Pdpn+ CAFs in same samples, scored by image analysis. n = 5,4 tumors. e Tumor weights upon sacrifice, in mice treated with AP or untreated. n = 5,4 tumors. f Quantification of indicated immune cell populations in tumors formed in control and AP-treated mice, scored by FACS. n = 5,4 tumors. g Percentages of activated CD8+ T cells in same mice, scored with indicated markers by FACS. h Quantification of additional indicated immune cell populations in tumors formed in control and AP-treated mice, scored by FACS. n = 5,4 tumors. CD11b and CD11c mark monocytic populations, gMDSC – granulocytic myeloid-derived suppressor cells (Ly6G+Ly6Clow), mMDSC – monocytic myeloid-derived suppressor cells (Ly6G-Ly6Chigh), F4/80 marks macrophages, FoxP3 marks regulatory T cells. i Relative stromal p16+ area in tumors formed by FC1199 KPC cells, with or without AP treatment, measured by image analysis. n = 6,5 tumors, >1 mm2/tumor. j Tumor weights upon sacrifice, in mice transplanted with FC1199 KPC cells treated with AP or untreated. n = 6,5 tumors. k, l Quantification of indicated T cell populations in FC1199 tumors formed in control and AP-treated mice, scored by FACS. n = 6,5 tumors. All values indicate mean ± SEM. t test. Scale bars = 20 μm.
Fig. 7
Fig. 7. Elimination of senescent CAFs in transplanted PDACs using ABT-199 increases activated CD8+ T cell rates.
a Diagram of experimental design. 6422c1 KPC cells were injected into wt mouse pancreata. Mice were treated with ABT-199 three times a week during tumor growth. b Sections of tumors formed by KPC cells in mice either untreated or treated with ABT-199, co-stained for p16 and for YFP (top), marking epithelial cells, or Pdpn (bottom) marking CAFs. c Relative stromal p16+ area in tumors with or without ABT-199 treatment. Values were measured by image analysis and normalized to mean of controls. n = 7 UNT, n = 6 ABT-199, >1 mm2/tumor. d Percentage of p16+ cells out of Pdpn+ CAFs in same samples, scored by image analysis. e Tumor weights upon sacrifice, in mice treated with ABT-199 or untreated. f Quantification of indicated immune cell populations in tumors formed in untreated and in ABT-199-treated mice, scored by FACS. g Percentages of activated CD8+ T cells in same mice, scored with indicated markers by FACS. h Quantification of indicated additional immune cell populations in tumors formed in untreated and in ABT-199-treated mice, scored by FACS. n = 7,6 tumors in (ch). All values indicate mean ± SEM. t test. Scale bars = 20 μm.
Fig. 8
Fig. 8. Senolytic treatment enhances the response to immune checkpoint therapy.
a Diagram of experimental design. 6422c1 KPC tumor cells were injected into mouse pancreata. Mice were treated with ABT-199, with ICT including αCTLA4, αPD1 and αCD40, or with both treatment types. b H&E-stained images of representative pancreatic tissues in mice treated with the different protocols. Dark regions represent remaining normal acinar tissue (white arrows). Tumor lesions in ABT + ICT mice are indicated by black arrows. Scale bar = 1 mm. c Pancreatic tissue weights upon mouse sacrifice in the different treatment mouse groups. Note that weights in ICT and ABT + ICT groups include some remaining normal tissue. n = 10 UNT, n = 6 ABT, n = 11 ICT, n = 12 ABT + ICT. d Higher magnification of H&E-stained tumor regions shown in (b). Dashed line indicates necrotic region in ABT + ICT-treated tumor. Scale bar = 100 μm. e Percentage of necrotic area out of tumor lesion area in the different treatment groups. Tissues that did not contain any remaining tumor lesions were not included. n = 10 UNT, n = 5 ABT, n = 9 ICT, n = 8 ABT + ICT. f Stain of tumor lesions for YFP in same, marking carcinoma cells with lesions. Scale bar = 100 μm. g Percentage of lesion area stained for YFP, indicating carcinoma cells, in the different treatment groups. n = 8 UNT, n = 6 ABT, n = 9 ICT, n = 8 ABT + ICT. All values indicate mean ± SEM. P values were calculated with Brown-Forsythe ANOVA test and Benjamini-Hochberg false discovery rate correction.

References

    1. He, S. & Sharpless, N. E. Senescence in health and disease. Cell169, 1000–1011 (2017). 10.1016/j.cell.2017.05.015 - DOI - PMC - PubMed
    1. Gorgoulis, V. et al. Cellular senescence: defining a path forward. Cell179, 813–827 (2019). 10.1016/j.cell.2019.10.005 - DOI - PubMed
    1. Di Micco, R., Krizhanovsky, V., Baker, D. & d’Adda di Fagagna, F. Cellular senescence in ageing: from mechanisms to therapeutic opportunities. Nat. Rev. Mol. Cell Biol.22, 75–95 (2021). 10.1038/s41580-020-00314-w - DOI - PMC - PubMed
    1. Collado, M. & Serrano, M. Senescence in tumours: evidence from mice and humans. Nat. Rev. Cancer10, 51–57 (2009).10.1038/nrc2772 - DOI - PMC - PubMed
    1. Perez-Mancera, P. A., Young, A. R. & Narita, M. Inside and out: the activities of senescence in cancer. Nat. Rev. Cancer14, 547–558 (2014). 10.1038/nrc3773 - DOI - PubMed

MeSH terms