. 2024 Jul 22;15(1):6172.
doi: 10.1038/s41467-024-50031-7.

Targeted degradation of extracellular mitochondrial aspartyl-tRNA synthetase modulates immune responses

Affiliations

Targeted degradation of extracellular mitochondrial aspartyl-tRNA synthetase modulates immune responses

Benjamin S Johnson et al. Nat Commun. .

Abstract

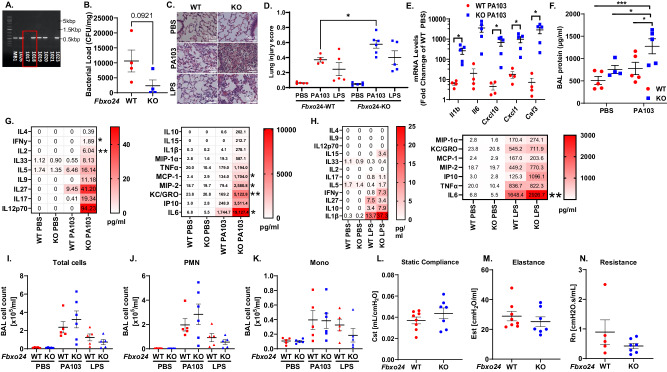
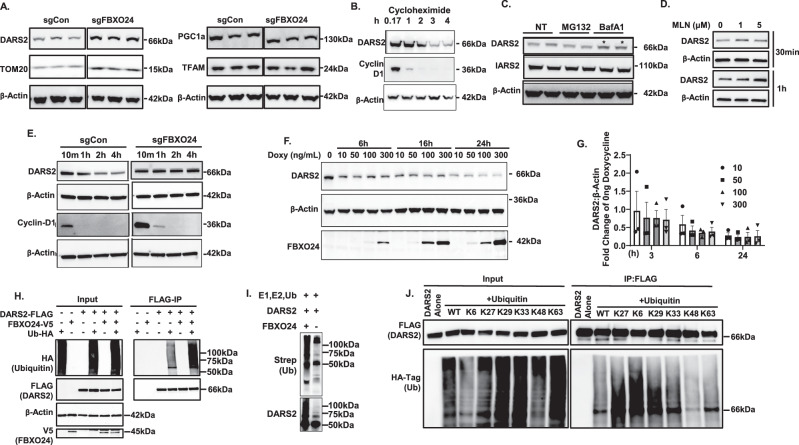
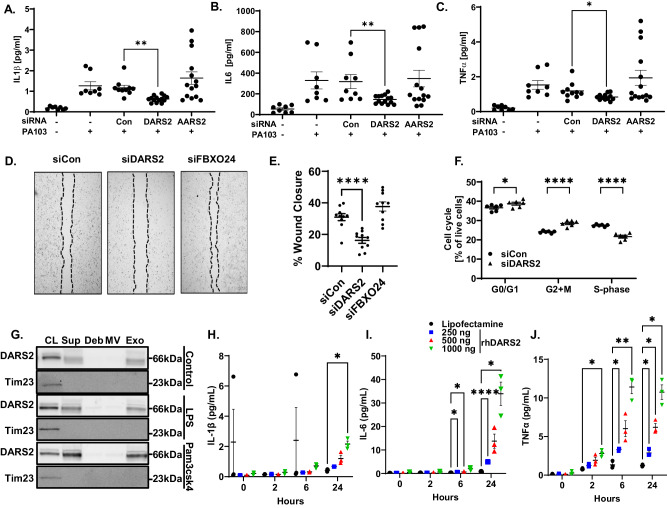
The severity of bacterial pneumonia can be worsened by impaired innate immunity resulting in ineffective pathogen clearance. We describe a mitochondrial protein, aspartyl-tRNA synthetase (DARS2), which is released in circulation during bacterial pneumonia in humans and displays intrinsic innate immune properties and cellular repair properties. DARS2 interacts with a bacterial-induced ubiquitin E3 ligase subunit, FBXO24, which targets the synthetase for ubiquitylation and degradation, a process that is inhibited by DARS2 acetylation. During experimental pneumonia, Fbxo24 knockout mice exhibit elevated DARS2 levels with an increase in pulmonary cellular and cytokine levels. In silico modeling identified an FBXO24 inhibitory compound with immunostimulatory properties which extended DARS2 lifespan in cells. Here, we show a unique biological role for an extracellular, mitochondrially derived enzyme and its molecular control by the ubiquitin apparatus, which may serve as a mechanistic platform to enhance protective host immunity through small molecule discovery.


Conflict of interest statement

The authors declare no competing interests.

Figures

Fig. 1
Fig. 1. FBXO24 is induced by bacterial infection.
A mRNA expression of FBXO24 in infected (confirmed by positive culture) transplant rejected human lung tissue measured by RT-qPCR, n = 4-5 patient samples (p < 0.0001) and (B) levels of FBXO24 protein quantitated in infected vs. uninfected tissue n = 5 patient samples/group, (p = 0.0434). C Representative immunoblots showing changes in F-box proteins from transplant rejected human lung tissue. D, E Representative immunoblots of FBXO24 protein levels in A549 (D) and BEAS2B (E) cells 6 h after infection with PA103. F Quantification by densitometry of panel (E) and additional samples (p = 0.0024) n = 6 biologically independent samples. G mRNA levels of FBXO24 in BEAS2B cells after 6 h PA103 infection, n = 8-9 samples/group, (p = 0.0095). H Shown are levels of related F-box proteins in BEAS2B cells after 6 h PA103 infection. I FBXO24 protein following 6 h Klebsiella pneumoniae or Staphylococcus aureus infection in BEAS-2B (top blot) and Streptococcus peumoniae at 3 or 6 h. J Quantification of FBXO24 protein in BEAS-2B infected with Klebsiella pneumoniae from panel (I) and additional samples. n = 4 biologically independent samples, (p = 0.0029). A, B, F, G, and J data are presented as mean values +/- SEM. A, B, F Unpaired student’s t-test, two tailed. G, J One-way ANOVA with multiple comparisons. Source data are provided as a Source Data file.
Fig. 2
Fig. 2. Fbxo24 genetic ablation in mice increases innate immunity.
A Detection of Fbxo24 gene deletion via qPCR in founder mice. BD Wild-type (WT) littermates or Fbxo24 KO mice were given PA103 (5×10⁵ cfu/mouse or LPS (3 mg/kg) intranasally (i.n.) and 24 h later mice were euthanized, lungs lavaged, lung tissue harvested for analysis of bacterial load B, lung histology C and lung injury score, (p = 0.0192) D. E Lung tissue cytokine mRNA analysis via RT-qPCR from PA103 (5 × 105 cfu/mouse) infected WT vs. Fbxo24 KO mice (Il1b p = 0.0434, Cxcl10 p = 0.0467, Cxcl1 p = 0.0401, Csf3 p = 0.0495). F BAL protein from PA103 infected WT vs. Fbxo24 KO mice (from top p = 0.0018, p = 0.0395, p = 0.037). G, H Cytokine levels in the BAL of WT vs. Fbxo24 KO mice infected with PA103 (IFNy p = 0.0154, IL-2 p = 0.0094, MCP-1 p = 0.0157, MIP-2 p = 0.0089, KC/GRO p = 0.0149, IL-6 p = 0.01 for WT PA103 vs. KO PA103) G or treated with LPS (IL-6 p < 0.0001 for WT PA103 vs. KO PA103) H and PBS controls assayed via multiplex ELISA. I BAL total cell counts, J PMN and K mononuclear (Mono) cell levels from PA103 infected and LPS treated WT vs. Fbxo24 KO mice. LN WT and Fbxo24 KO mice given PA103 (1 × 105 cfu/mouse) i.n. were analyzed for lung mechanics showing no change in compliance L, elastance M, or resistance N. B n = 4 mice/group and DK n = 4–6 mice/group. LN n = 7 (KO) and 8 (WT)/group. B, D–F, I–N data are presented as mean values ± SEM. B, D, E Unpaired student’s t-test, two-tailed. F One-way ANOVA with Dunnett’s multiple comparison test. G One-way ANOVA with Tukey’s multiple comparison test used for statistical analysis, applied to each cytokine’s data individually. H P-values derived multiple unpaired two-tailed student’s t-tests. Source data are provided as a Source Data file.
Fig. 3
Fig. 3. FBXO24 impairs mitochondrial respiration.
A A549 cells were transfected with V5-Tagged FBXO24 and stained for V5, MitoTracker Deep Red, and DAPI showing sub-cellar localization. B, C Representative images of A549 cells transfected with control or FBXO24 siRNA and stained for TOM20 and DAPI showing increased TOM20 suggestive of increased mitochondrial signals as seen in C, (p = 0.0003, n = 4–6 biologically independent samples/group). DF BEAS-2B cells transfected with 10 nM control RNA or FBXO24 siRNA for 48 h and oxygen consumption ratio (OCR) D, maximal respiration, (p = 0.0014) E, and spare respiratory capacity, (p < 0.0001), F was assayed using a Seashore XFe96 Analyzer. n = 11 biologically independent samples/group; repeated 3 times and representative experiment shown. G Confirmation of FBXO24 induction using varying doxycycline (Doxy) concentrations in BEAS2B-Tet-FBXO24 cells (Tet-O24). Representative plots in oxygen consumption H Tet-O24 cells or a control cell line (Tet-Luc, [luciferase]) in I where Beas2Bs-Tet-Luc cells were treated with vehicle, 150 ng/ml or 300 ng/mL doxy overnight. Tet-O24 cells demonstrated dose dependent changes in J basal respiration, (p = 0.0163,), K maximal respiration, (0.0012,), L spare respiratory capacity, (p = 0.0009), and M ATP production, (p = 0.0059). N = 10–11 biological replicates per group; repeated 2 times, representative data shown. N A549 cells stably over-expressing FBXO24-Wt MiniTurboID or FBXO24-LPAA-MiniTurboID were treated with biotin (4 h) prior to lysis. Biotinylated proteins were captured using streptavidin beads and submitted for mass spectrometry. Shown are peptides that were significantly upregulated in FBXO24 and FBXO24-LP/AA mutant cells vs. mNEON controls. We compared peptides significantly upregulated after inactivation of the FBXO24 activity by measuring peptide abundance in FBXO24 vs. FBXO24-LP/AA expressing cells. Green > 1-fold change vs. FBXO24. Red <1 fold change vs. FBXO24 (n = 5 biologically independent samples/group). O Shown is subcellular localization of ectopically expressed Flag-Tagged-DARS2 and V5-tagged-FBXO24 in A549 cells infected with PA103 or uninfected. Scale bar=20 μm. Representative immunofluorescence images and quantification (p = 0.0447, n = 10 biological replicates/group) of DARS2-FBXO24 colocalization (arrows) are shown below. C–F, H–M and O data are presented as mean values±SEM. C, E, F, O p-values derived from unpaired student’s t-test. JM Analyzed with One-way ANOVA with multiple comparisons. Source data are provided as a Source Data file.
Fig. 4
Fig. 4. FBXO24 binds and mediates DARS2 ubiquitylation and degradation.
A Levels of mitochondrial biogenesis proteins in a CRISPR generated FBXO24 KO BEAS-2B cell line, and a control cell line, where higher levels of DARS2 and TOM20 proteins are shown (n = 2). Each lane shown is a separate sample. B DARS2 t ½ determined using cycloheximide (CHX) (40μg/mL) treatment for various times in BEAS-2B cells. Shown is a representative immunoblot using cyclin D as a control. C DARS2 and IARS2 levels by immunoblotting in BEAS-2B cells treated with MG-132 [10 μM] proteasome inhibitor or bafilomycin A1 (BafA1)[100 nM] lysosome inhibitor (n = 3). D Immunoreactive DARS2 levels in BEAS2B cells treated with vehicle (0), or a pan ubiquitination inhibitor MLN (1 or 5 μM) for 30 min or 1 h (n = 3). E DARS2 t ½ in sgControl or sgFBXO24 BEAS-2B cells treated with CHX up to 4 h with a representative immunoblot (n = 3). F Effect of overexpressed FBXO24 on endogenous DARS2 levels in doxy-inducible FBXO24 BEAS-2B cells, representative immunoblot and G quantification (repeated n = 3 times) Data are presented as mean values±SEM. H Polyubiquitylation levels of ectopically expressed Flag-tagged-DARS2 in the presence or absence of FBXO24-V5 or HA-tagged-ubiquitin (Ub). Cells were transfected with plasmids and processed for immunoprecipitation (IP) and immunoblotting (n = 3). I In vitro ubiquitination reaction of DARS2 with or without FBXO24 showing polyubiquitylated DARS2 (n = 1). J IP of ectopically expressed Flag-DARS2 co-transfected with WT or RK HA-ubiquitin constructs to identify primary ubiquitin linkages (n = 3). Representative immunoblots of input proteins (left) and after Flag pull-down of ectopically expressed DARS2 (right) are shown. Source data are provided as a Source Data file.
Fig. 5
Fig. 5. Molecular signatures impact DARS2 stability.
A Structural map showing regions of DARS2 essential to its stability with indicated sequential, cumulative deletions of the carboxyl-terminus and deletion of its NH2-terminal mitochondrial targeting sequence (MTS) and candidate point mutants at lysine residues. The span of residues from deletion mutants is shown in the Methods. B Transient over-expression of deletion mutants in HEK293T cells and treatment with CHX (40μg/mL) for 10 min, up to 6 h to assess construct stability with representative immunoblots and quantification of t ½ by densitometry C (n = 3). D IP of ectopically expressed empty vector (EV) or DARS2 in HEK293T cells shows a ~ 66 kDa band processed for Mass Spectrometry (MS) (n = 3 biologically independent samples). E Graphical representation of ubiquitylated lysine residues shared in separate experiments from DARS2 IP replicates showing one of the validated MS spectra below. F Ubiquitylated DARS2-WT and KR DARS2 variants after transient overexpression of plasmids in HEK293T cells and IP with Flag-antibody conjugated magnetic beads. Shown is a representative immunoblot (n = 3). G Transient over-expression of KR DARS2 mutants in HEK293T cells and treatment with CHX for 10 min up to 24 h is shown to assess t ½. Shown are representative immunoblots and densitometric analysis of decay in H (n = 3). I Immunoblot of IP with anti-Flag beads to measure the effect of FBXO24 plasmid transfection (1 μg) on polyubiquitylation levels of DARS KR mutants or DARS2 WT (n = 3). J Acetylation levels of Flag-DARS2-WT or DARS2 K368R plasmid co-expressed in HEK293 cells with FBXO24 (1 μg) or a control plasmid. Cells were processed for Flag IP and immunoblotted with acetyl-Lys antibody and a representative immunoblot shown with and quantification below (n = 2). K Mitochondrial function was assayed using a Seahorse XFe96 analyzer to determine behavior of DARS2 mutant plasmid overexpression (n = 9 biologically independent samples per group). Basal Respiration (K153R p = 0.0095, K368R p = 0.0019, K377R p = 0.0081), ATP Production (K153R p = 0.0298, K368R p = 0.0027, K377R p = 0.0133) P-values determined by individual two-tailed Student’s t-tests. C, H and K data are presented as mean values ± SEM. Source data are provided as a Source Data file.
Fig. 6
Fig. 6. DARS2 is a secreted immunostimulatory protein.
AC BEAS-2B were transfected with control RNA, DARS2 siRNA, or siRNA targeting AARS2 for 72 h, then infected with PA103 (MOI 10 for 6 h); supernatant was collected and assayed for cytokine levels (n = 8-14 biologically independent samples/group across n = 3 experiments, IL-1β p = 0.0096, IL-6 p = 0.0049, TNFα p = 0.028). D Representative images and quantification of BEAS-2B cells treated with 10 nM control RNA, DARS2 siRNA or FBXO24 siRNA and wound healing tested by a scratch assay and results quantitated E. (p < 0.0001), (n = 10 biologically independent samples from 2 repeats). F Cell cycle analysis via BrdU incorporation and flow cytometry of BEAS-2B treated with 10 nM control RNA or DARS2 siRNA. (G0/G1 p = 0.05, G2 + M p < 0.0001, S p < 0.0001, by student’s t-test) (n = 6 biologically independent samples from 2 repeats). G Shown are effects of LPS (500 ng/ml) or Pam3CSK4 (200 ng/ml) on DARS2 protein within cell lysates (CL) or secreted into supernatants (Sup), debris (Deb), macro vesicles (MV) and exosomes (Exo) by BEAS-2B cells (n = 3). HJ Shown are IL-1β, (p = 0.0187), H, IL-6, (6 h: 250 ng p = 0.0208, 500 ng p = 0.0161, 24 h: 250 ng p < 0.0001, 1000 ng p = 0.0413), I, and J TNFα, (2 h 1000 ng p = 0.0237, 6 h 250 ng p = 0.0204, 1000 ng p = 0.0084, 24 h 250 ng p = 0.0351, 500 ng p = 0.0161, 1000 ng p = 0.0179), levels in the supernatants of differentiated CD14+ cell cultures treated with increasing amounts of recombinant human DARS2. n = 3 biologically independent samples. AC, E, F, HJ data are presented as mean values ± SEM. AC, E, F p-values derived from unpaired Student’s t-test two-tailed between noted groups. HJ Two-way ANOVA with Dunnett’s multiple comparisons test. Source data are provided as a Source Data file.
Fig. 7
Fig. 7. Extracelluar DARS2 stimulates innate immune responses in vivo.
A Total cell counts in BAL of mice analyzed either 4 h or 24 h after i.t. treatment with vehicle (protein transfection reagent), recombinant human DARS2 (5 μg), or recombinant AARS2 (5 μg) packaged in lipid vesicles (n = 5–9/group) (4 h Veh-DARS2 p = 0.0402, 24 h Veh-DARS2 p = 0.0122, DARS2 4 vs.24 h p = 0.0119). B, C Shown are PMNs (p < 0.0001) B and mononuclear cells (p = 0.0003) C levels in BAL of mice from the 24 h cohort. D BAL cytokines in mice given recombinant DARS2 (5 μg i.t.,) and analysis at 4 h post-treatment (n = 3-6/group), (IL-6 p = 0.0388, IP-10 p = 0.0331, KC p = 0.0403, MIP2 p = 0.0326, IFNy p = 0.0298, IL-1β p = 0.0373, IL-5 p = 0.0247, MCP-1 p = 0.0071). E Lung histology and F lung injury score (p < 0.0001) in mice treated with vehicle or recombinant DARS2 (5 μg i.t.) from the 24 h cohort (n = 8-9 animals/group). G, H Shown are peritoneal fluid (PF) (p = 0.0051) G or BAL (p < 0.0001) H cell counts of mice injected with vehicle or recombinant DARS2 (5 μg i.p.) analyzed 24 h after injection (n = 5-8/group). I Relative DARS2 protein abundance was assayed from plasma of critically ill patients at multiple time points during ICU stay (days 1, 7, 21) and control patients without critical illness (Day 1 p = 0.019, 7 p = 0.014, 21 p = 0.021). J Among critically ill patients, relative DARS2 protein levels increased over time compared to controls (left) with subgroup analysis demonstrating DARS2 abundance in patients with and without P. aeruginosa infection (p = 0.034), n = 50. AC, FH data are presented as mean values ± SEM. AC p-values derived from Welch’s ANOVA with Dunnett’s T3 multiple comparisons. D, FH Analyzed with unpaired Student’s t-test, two-tailed. I, J Mann-Whittley two-tailed test used for analysis and data presented as IQR for minima and maxima, mean as center and whiskers 1.5xIQR range. Source data are provided as a Source Data file.
Fig. 8
Fig. 8. A FBXO24 inhibitor stabilizes DARS2 and triggers immune responses.
A Predicted crystal structure of FBXO24 beta-propeller domain. B BC-1293 chemical structure. C In silico docking model of potential ligand binding to FBXO24 β-propeller domain. D 2D diagram showing key interacting residues of FBXO24 with ligand. E A representative immunoblot of recombinant DARS2 binding with exogenous FBXO24 from IP from HEK293 cells incubated with increasing concentrations of BC-1293 or a specificity control BC-1395 (n = 3). Below, DARS1 was not detected in IP, with rhDAR1 as a loading control. F DARS2 and t ½ in cells treated with DMSO or BC-1293 (n = 3). G, H DARS2 levels in control cells (sgCon) or FBXO24 depleted (sgO24) BEAS-2B cells treated with Pam3CSK4 and BC1293 (0.1-20 μM) or vehicle control (DMSO) with PamCSK4 (n = 3) H Densitometric analysis from G (p = 0.038). I Endogenous (top blot) or ectopically expressed Flag-DARS2 secretion (lower blot) from BEAS-2B cells or HEK293T cells, respectively, into supernatants with inclusion of Pam3CSK4 and BC-1293. Control cells were exposed to DMSO with Pam3CSK4 (n = 3) JL IL-6, TNFα, or IL-1β secretion from BEAS-2B (top p = 0.0029, lower p = 0.0024,) J CD14+ (from top p < 0.0001, p < 0.0001, p = 0.0117, p < 0.0001) K, or THP-1 (p = 0.0438) L cells, respectively, in cells treated with BC-1293 or vehicle (veh) in the absence or presence of Pam3CSK4 (1 μg/ml)(n = 3). MP Mice treated with DMSO control or BC1293 (2 μg or 5 μg i.t.) for 24 h (n = 5/group) were analyzed for BAL total cell counts (p = 0.0016) M, mononuclear (top p = 0.0027, lower p = 0.0159) N, polymorphonuclear cells O and P cytokines (n = 5/group) (IL-1β, DMSO-2μg, p = 0.0261; IL-9, DMSO-5μg, p = 0.0261; MIP-2 DMSO-2μg, p = 0.0469; TNFα, DMSO-2 μg, p = 0.0422). Q, R IL-6 in culture medium from precision cut lung slices from Fbxo24 WT (p = 0.0145) Q or Fbxo24 heterozygous (Fbxo24+/-) mice R co-treated with Pam3CSK4 (5 μg) and increasing doses of BC1293 (24 h). n = 5–6 lung slices/group. H, JO and Q, R data are presented as mean values ± SEM. JO and Q, R Ordinary one-way ANOVA with Tukey’s J, M, N or Dunnett’s K, L multiple comparisons, P Ordinary Student’s t-test two-way. G Two-way ANOVA with Tukey’s multiple comparisons test. Source data are provided as a Source Data file.

References

    1. Gierse, L. C. et al. Impact of pneumococcal and viral pneumonia on the respiratory and intestinal tract microbiomes of mice. Microbiol. Spectr.11, e0344722 (2023). 10.1128/spectrum.03447-22 - DOI - PMC - PubMed
    1. Hotchkiss, R. S., Monneret, G. & Payen, D. Immunosuppression in sepsis: a novel understanding of the disorder and a new therapeutic approach. Lancet Infect. Dis.13, 260–268 (2013). 10.1016/S1473-3099(13)70001-X - DOI - PMC - PubMed
    1. Calfee, C. S. et al. Subphenotypes in acute respiratory distress syndrome: latent class analysis of data from two randomised controlled trials. Lancet Respir. Med2, 611–620 (2014). 10.1016/S2213-2600(14)70097-9 - DOI - PMC - PubMed
    1. Brands, X. et al. Concurrent immune suppression and hyperinflammation in patients with community-acquired pneumonia. Front Immunol.11, 796 (2020). 10.3389/fimmu.2020.00796 - DOI - PMC - PubMed
    1. Bonnefond, L. et al. Toward the full set of human mitochondrial aminoacyl-tRNA synthetases: characterization of AspRS and TyrRS. Biochemistry44, 4805–4816 (2005). 10.1021/bi047527z - DOI - PubMed

MeSH terms