. 2024 Oct;19(10):1532-1543.
doi: 10.1038/s41565-024-01725-y. Epub 2024 Jul 22.

Magnetic-field-driven targeting of exosomes modulates immune and metabolic changes in dystrophic muscle

Affiliations

Magnetic-field-driven targeting of exosomes modulates immune and metabolic changes in dystrophic muscle

Chiara Villa et al. Nat Nanotechnol. 2024 Oct.

Abstract

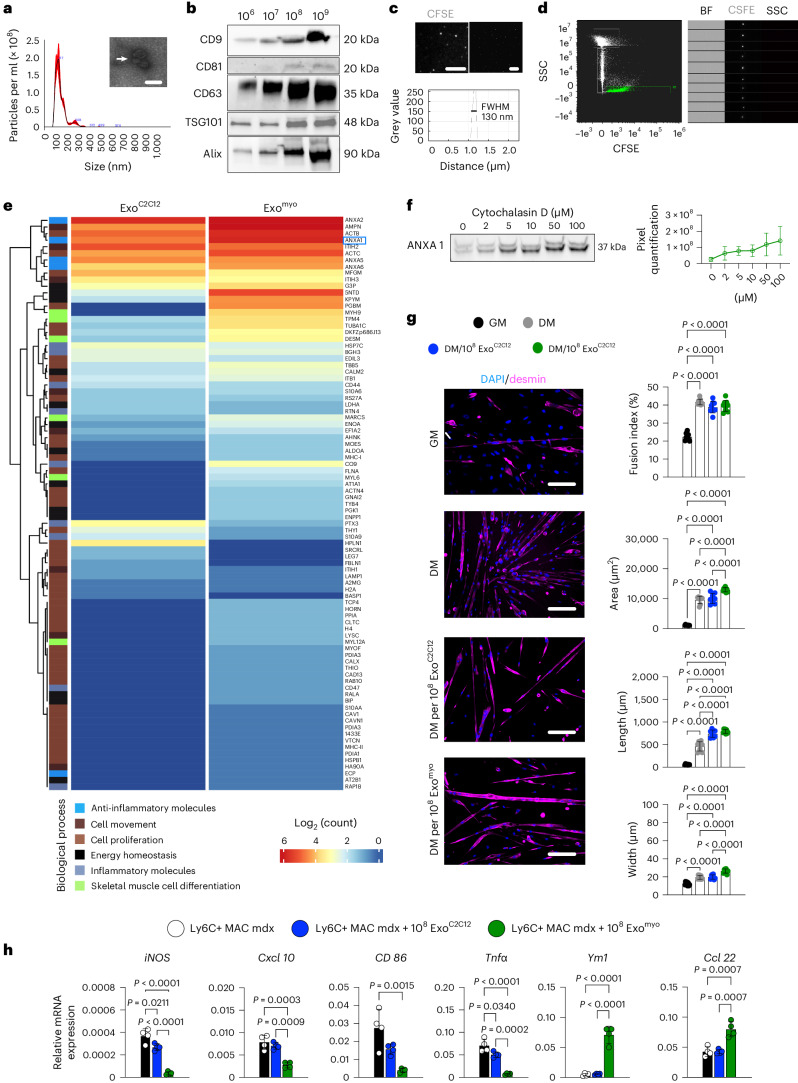
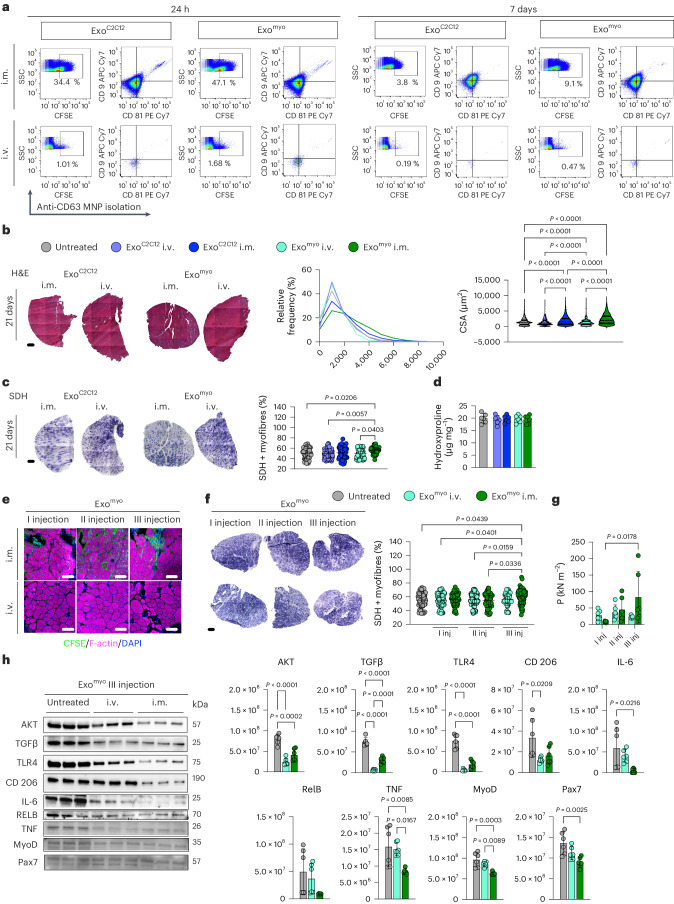
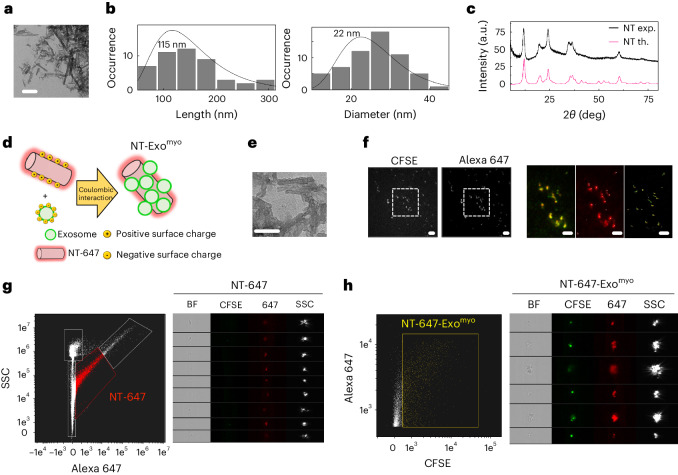
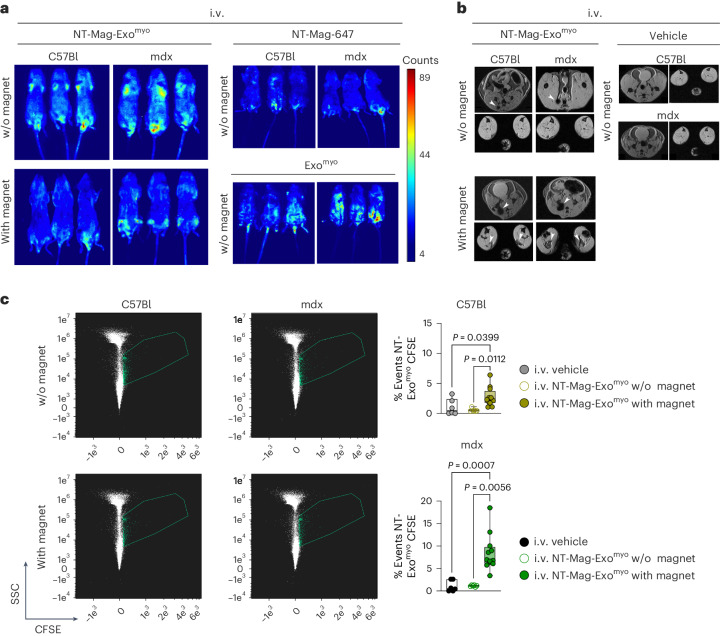
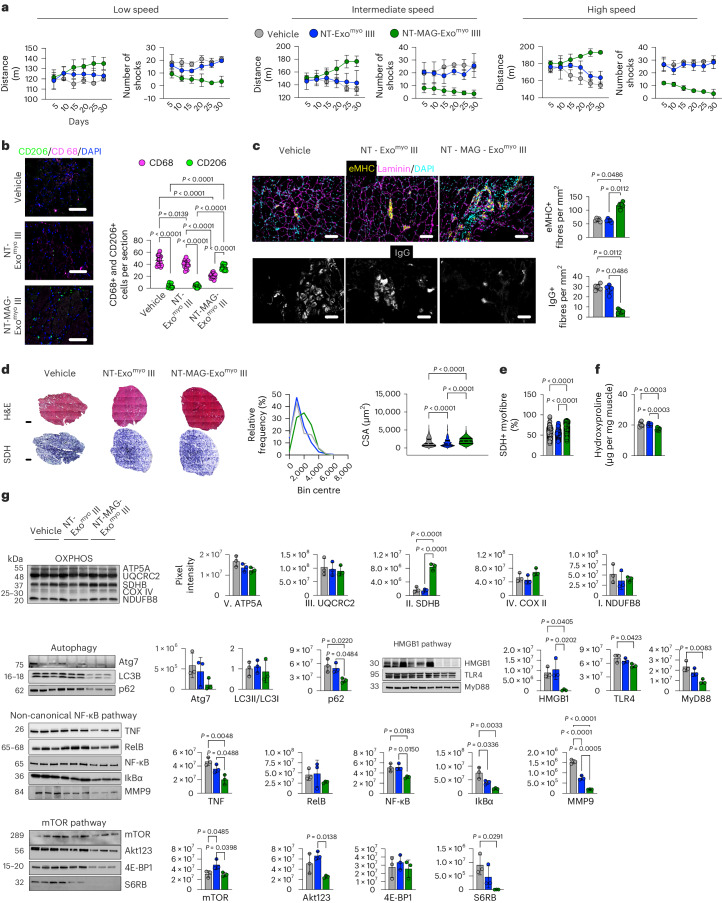
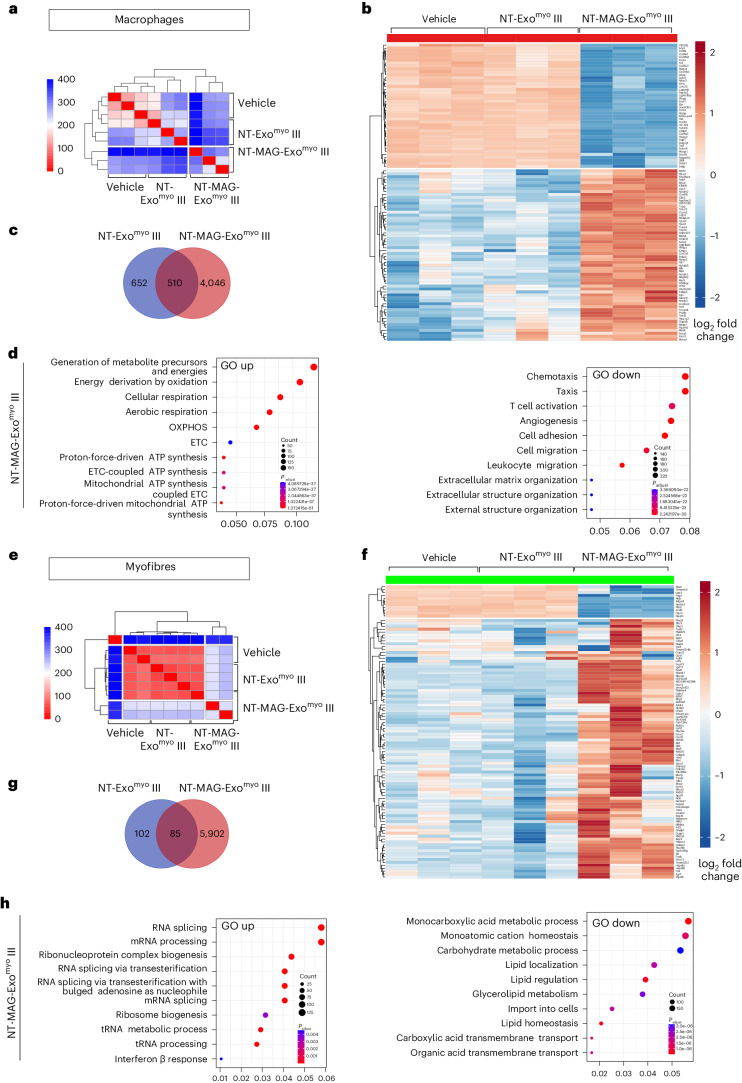
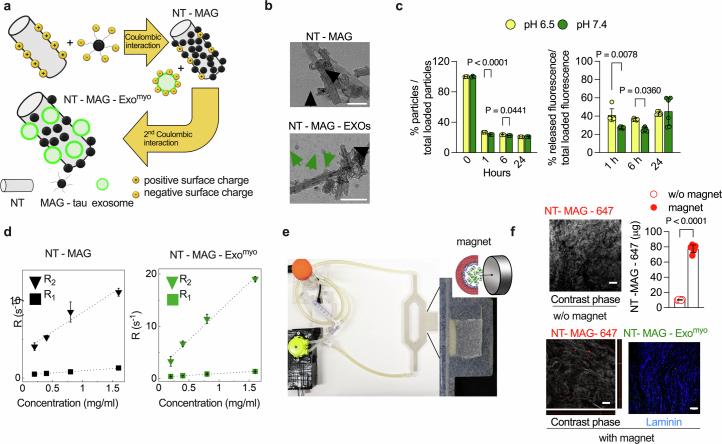
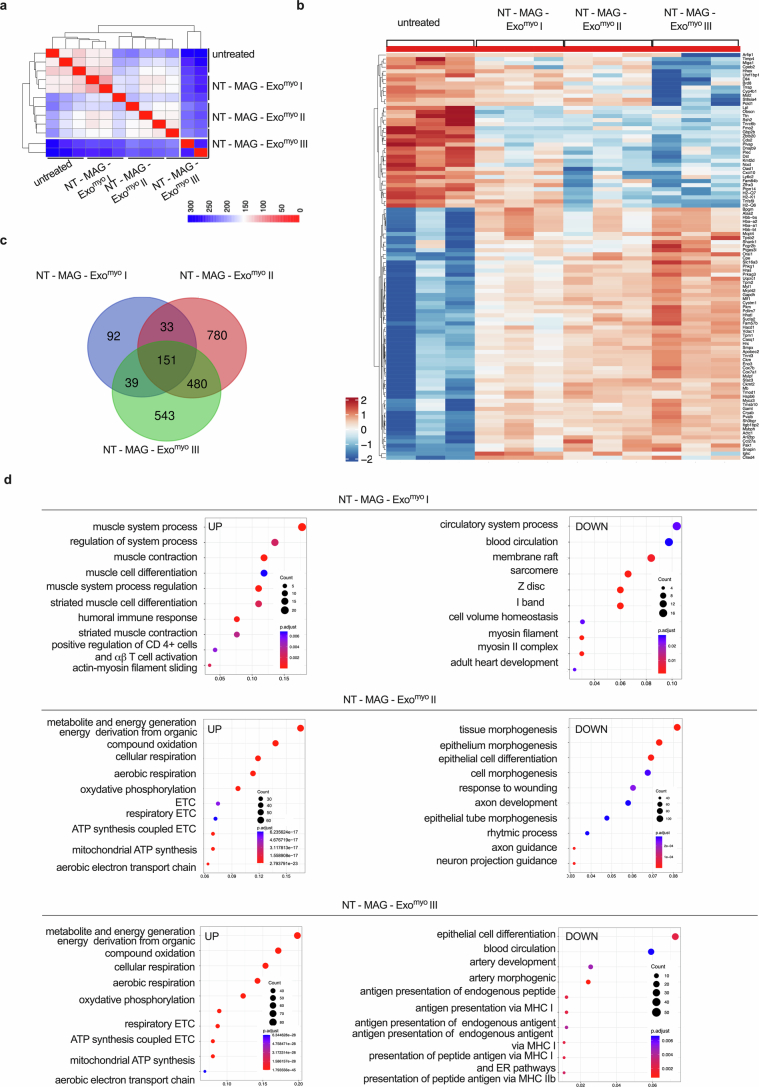
Exosomes are promising therapeutics for tissue repair and regeneration to induce and guide appropriate immune responses in dystrophic pathologies. However, manipulating exosomes to control their biodistribution and targeting them in vivo to achieve adequate therapeutic benefits still poses a major challenge. Here we overcome this limitation by developing an externally controlled delivery system for primed annexin A1 myo-exosomes (Exomyo). Effective nanocarriers are realized by immobilizing the Exomyo onto ferromagnetic nanotubes to achieve controlled delivery and localization of Exomyo to skeletal muscles by systemic injection using an external magnetic field. Quantitative muscle-level analyses revealed that macrophages dominate the uptake of Exomyo from these ferromagnetic nanotubes in vivo to synergistically promote beneficial muscle responses in a murine animal model of Duchenne muscular dystrophy. Our findings provide insights into the development of exosome-based therapies for muscle diseases and, in general, highlight the formulation of effective functional nanocarriers aimed at optimizing exosome biodistribution.


Conflict of interest statement

The authors declare no competing interests.

Figures

Fig. 1
Fig. 1. Exomyo enhances myogenesis and switches macrophages to an anti-inflammatory state.
a, NTA and TEM (inset; the arrow indicates exosomes) were performed on ExoC2C12 obtained through differential ultracentrifugation (average diameter, 137.5 nm; mode, 116 nm; s.d., 56.2 nm). Scale bar, 200 nm. b, Western blot of CD9, CD81, CD63, TSG101 and Alix in 106, 107, 108 and 109 ExoC2C12 samples. c, Representative super-resolution dSTORM reconstructed image showing CFSE-labelled exosomes from C2C12 (upper left panel) and the FWHM of the fluorescence intensity distribution (lower panel) obtained from dSTORM imaging (upper right panel). Scale bars, 10 μm (left) and 1 μm (right). d, Representative Amnis ImageStream of CFSE-labelled ExoC2C12 showing the scatter plot of SSC versus CFSE intensity, which resolves three discrete populations (SpeedBeads (SB); Background (BG); Exosomes (R1), 0–200 nm) (left panel). CFSE staining is evident only in the R1 ExoC2C12 population as confirmed by CFSE, SSC and bright-field (BF) imagery (right panel). In ad representative images from n = 3 independent experiments are shown. e, Heatmap of the top 100 differentially expressed proteins between the ExoC2C12 and Exomyo groups. n = 3 samples per group. f, Western blotting (left panels) and quantification (right panels) of ANXA1 expression in exosomes isolated from cytochalasin D-primed C2C12 cells. Cells were primed with escalating cytochalasin D doses (0, 2, 5, 10, 50, 100 μM). Blots are representative of n = 3 independent experiments; data are presented as mean ± s.d. of n = 3 independent experiments. g, Myogenic commitment of desmin-positive mdx SCs cultured for 24 h in growth medium and for 7 days in differentiation medium (DM), DM supplemented with 108 ExoC2C12 or DM supplemented with 108 ExoMyo. Scale bars, 75 μm. Graphs show quantification of the fusion index and myotube area, length and width. Data are presented as mean ± s.d.; n = 2 or 3 independent experiments, for each experiment n = 3 or 4 images per group were quantified; ordinary one-way ANOVA followed by post hoc Tukey multiple-comparison test. h, Quantitative reverse-transcription PCR transcript levels of the indicated genes were quantified from freshly purified (by FACS) circulating macrophages (iMACs) and iMACs cultured for 24 h in the presence of 108 ExoC2C12 or 108 Exomyo. Data are presented as mean ± s.d.; n = 4 independent experiments; ordinary one-way ANOVA followed by post hoc Tukey multiple-comparison test. Source data
Fig. 2
Fig. 2. Repeated intramuscular injection of Exomyo improves muscle function in mdx mice.
Mdx mice were injected intramuscularly (i.m.) or intravenously (i.v.) with 109 ExoC2C12 or 109 Exomyo. The TA was assessed 24 h, 7 days and 21 days after treatment. For each administration route, n = 6 mice per ExoC2C12 or Exomyo were used for each time point; n = 6 untreated mice were used as controls. a, Exosomes were immunomagnetically isolated from dissociated muscle tissues using anti-CD63 MNP. Isolated CD63+ exosomes were characterized by FACS for the expression of exosomal markers. Left, Representative FACS dot-plots show the proportion of muscle-isolated CFSE+ exosomes in both ExoC2C12- and Exomyo-injected mice. Right, Representative FACS dot-plots show the coexpression of CD9 and CD81 within the CFSE+ ExoC2C12 and Exomyo populations. FACS was performed on n = 3 mice per group (pooled muscles) in n = 2 independent experiments. b, Representative H&E and SDH staining images from the TA muscles of mdx mice 21 days after intramuscular and intravenous injection of ExoC2C12 or Exomyo. Scale bars, 200 μm. c, Quantification of the myofibre area and relative frequency distribution of the myofibre CSA in the TA 21 days after intramuscular and intravenous administration of ExoC2C12 or Exomyo. For each group, H&E images were counted from n = 5 mice per group: n = 5,677 myofibres for untreated mdx (median, 1,301.56 μm2; 25th percentile, 702.46 μm2; 75th percentile, 2,074.69 μm2); n = 5,562 for intramuscular ExoC2C12 (median, 1,535.042 μm2; 25th percentile, 781.50 μm2; 75th percentile, 2,574.76 μm2) and n = 4,581 for intravenous ExoC2C12 (median, 1,156.076 μm2; 25th percentile, 719.19 μm2; 75th percentile, 2,074.90 μm2); n = 5,455 for intramuscular Exomyo (median, 2,057.711 μm2; 25th percentile, 1,052.32 μm2; 75th percentile, 3,356.76 μm2) and n = 5,326 for intravenous Exomyo (median, 1,116.286 μm2; 25th percentile, 658.91 μm2; 75th percentile, 1,765.78 μm2). For morphometric analysis, images were quantified using ImageJ software. Violin plots showing CSA median (dotted lines) and quartiles (solid lines); Kruskal–Wallis with Dunn’s multiple-comparison test. c, Representative SDH staining and quantification of the percentage of SDH+ myofibres in the TA 21 days after intramuscular and intravenous administration of ExoC2C12 or ExoMyo. n = 4 mice per group, n = 16 slices per mouse. Scatter dot-plots showing SDH+ fibre percentage as mean ± s.d.; Kruskal–Wallis with Dunn’s multiple-comparison test. d, Fibrosis was quantified in TA by the hydroxyproline assay 21 days after intramuscular and intravenous administration of ExoC2C12 or Exomyo. Data are presented as mean ± s.d. of n = 3 samples per group in two independent experiments; one-way ANOVA followed by post hoc Tukey multiple-comparison test. e, Three-month-old mdx mice were treated with one (I), two (II) or three (III) 109 Exomyo intramuscular (n = 12 mice) and intravenous (n = 6 mice) injections, once a week. A control untreated group was used as control (n = 6 mice). Mice were killed 30 days after the first injection. Representative images of F-actin+ muscle cells (red) with Exomyo (green). Scale bars, 50 μm. f, Representative images of SDH staining and quantification of SDH+ myofibres. Scale bars, 200 μm. Scatter dot-plots showing mean ± s.d. of n = 4 mice per group, n = 16 slice per mouse; Kruskal–Wallis with Dunn’s multiple-comparison test. g, Tetanic force of TA muscles from mdx mice injected intramuscularly and intravenously with the three different Exomyo doses, 30 days after the first injection. Data are presented as mean ± s.d. of n = 6 mice per group; two-way ANOVA followed by post hoc Tukey multiple-comparison test. h, Cropped representative images of Western blots showing the expression of proteins involved in inflammation and fibrosis in TA muscles from mdx mice treated with three (III) injections of Exomyo. Data are presented as mean ± s.d. n = 3 mice per group in two independent experiments; one-way ANOVA followed by post hoc Tukey multiple-comparison test. Source data
Fig. 3
Fig. 3. Fabrication of exosome nanocarriers.
a, TEM of bare NTs. Scale bar, 200 nm. b, Size distribution of NT length (left) and diameter (right) obtained from the analysis of TEM images. The solid line is the fit of the size distribution with a log-normal distribution of the indicated average value. c, Powder X-ray diffraction patterns of bare NTs (exp.) and simulated crystalline chrysotile NTs (th.). d, Sketch of the ionic self-assembly mechanism exploited to attach the conjugated dye Alexa Fluor 647 to the surface of NTs decorated with CFSE + Exomyo. e, TEM of NTs decorated with exosomes. Scale bar, 200 nm. f, Representative 100× magnification of NT-647 labelled with Exomyo. Scale bars, 1 μm. Dotted areas were analysed by dSTORM (left image for NT-647-Exomyo; middle image for Exomyo, right image for the dSTORM reconstruction). Scale bar, 1 μm. g, Amnis ImageStream of NT-647 showing the scatter plot of SSC versus Alexa 647 intensity, which resolves four discrete populations (SpeedBeads (SB); Background (BG); NT-647; NT-647 aggregates) (left panel) and representative Amnis flow cytometry image gallery of NT-647 (red) (right panel). h, Amnis ImageStream of dual-functionalized NT-647-Exomyo (yellow) showing the scatter plot of CFSE versus Alexa 647 intensity (left panel) and representative Amnis imaging flow cytometry image gallery of NT-647-Exomyo.
Fig. 4
Fig. 4. Short- and long-term in vivo biodistribution of NT-MAG-Exomyo.
a,b, Optical bioluminescence (a) and MRI imaging (b) of 3-month-old C57Bl and mdx mice intravenously injected with NT-MAG-Exomyo in the presence or absence of the magnet (n = 3 C57Bl and n = 3 mdx mice per condition) and analysed 24 h later. Intravenous injection of Exomyo and NT-MAG-647 (n = 3 per animal model) without magnet placement were used as controls for bioluminescence. Intravenous injection of PBS (vehicle) was used as a control for MRI. The arrowheads in b indicate the predicted MRI signal of NT-MAG-Exomyo. c, Amnis ImageStream of NT-MAG-Exomyo (left panel, in the scatter dot plot outlined areas) and quantification (right panel) of NT-MAG-Exomyo in the hind limb muscles (quadriceps muscle, TA, gluteus, gastrocnemius) of 3-month-old C57Bl and mdx mice 30 days after intravenous injection of NT-MAG-Exomyo (with or without magnet). Vehicle injection was used as control in both animal models; n = 3–6 mice per group in two independent experiments. Box plots show median, minimum to maximum values. C57Bl vehicle: median, 0.50; minimum, 0.00; maximum, 3.24; 25th percentile, 0.00; 75th percentile, 2.38; C57Bl Exomyo without magnet: median, 0.43; minimum, 0.36; maximum, 1.10; 25th percentile, 0.37; 75th percentile, 0.66; C57Bl Exomyo with magnet: median, 2.28; minimum, 1.05; maximum, 6.39; 25th percentile, 1.77; 75th percentile, 3.72; mdx vehicle: median, 0.54; minimum, 0.00; maximum, 2.62; 25th percentile, 0.00; 75th percentile, 2.62; mdx Exomyo without magnet: median, 1.16, mininum, 0.85; maximum, 1.32; 25th percentile, 0.98; 75th percentile, 1.32; mdx Exomyo with magnet: median, 6.86, minimum, 3.43; maximum, 18.51; 25th percentile, 6.14; 75th percentile, 18.51. Statistical analysis was performed using Kruskal–Wallis with Dunn’s multiple-comparison test. Source data
Fig. 5
Fig. 5. Magnetic delivery of NT-MAG-Exomyo improves muscle function in mdx mice.
Three-month-old mdx mice were intravenously injected with three doses, once per week, of NT-MAG-Exomyo (NT-MAG-Exomyo III) delivered through magnet positioning around murine muscles (n = 8 mdx mice). Mice intravenously injected with three doses of non-magnetic NT-Exomyo (NT-Exomyo III) delivered through magnet positioning and mice receiving three intravenous injections of vehicle (that is, PBS) once a week were used as controls (n = 8 mdx mice per group). All mice were killed 30 days after the first injection. a, Treadmill performance of mice injected with NT-MAG-Exomyo III, NT-Exomyo III and vehicle. Data were recorded at 20 cm s−1 (low intensity), 25 cm s−1 (intermediate intensity) and 30 cm s−1 (high intensity). Results from the first injection to the day on which the mice were killed are expressed as average distance and number of shocks ± s.d.; two-way ANOVA followed by post hoc Tukey multiple-comparison test. n = 3 mice per group. *P < 0.05, **P < 0.01, ***P < 0.001 and ****P < 0.0001 for comparison between NT-MAG-Exomyo III and NT-Exomyo III; exact P values are reported for vehicle compared to NT-MAG-Exomyo III-administered mice. b, Immunofluorescent staining of NT-MAG-Exomyo III- and non-magnetic NT-Exomyo III-injected muscle tissue. Infiltration of proinflammatory and anti-inflammatory macrophages was detected and quantified using CD68 (magenta) and CD206 (green) immunoreactivity, respectively. Scale bars, 50 μm. Immunoreactivity was quantified by ImageJ software. Data are presented as mean ± s.d.; n = 3 mice per group, n = 5 slides per mouse. Statistical analyses were performed using one-way ANOVA followed by post hoc Tukey multiple-comparison test. c, Regenerating and necrotic myofibres in NT-MAG-Exomyo III- and non-magnetic NT-Exomyo III-injected muscle tissue were stained with embryonic myosin (eMHC, yellow) and laminin (magenta), or with goat anti-mouse IgG (grey). Scale bars, 50 μm. Immunoreactive fibres were quantified per mm2 using ImageJ software; n = 5 mice per group. Data are presented as mean ± s.d. Statistical analyses were performed using Kruskal–Wallis with Dunn’s multiple-comparison test. d, Representative images of muscle tissue stained with H&E with quantification of the myofibre cross-sectional area. Scale bars for H&E, 200 μm. For each group, H&E images were counted from n = 4 mice: n = 3,287 myofibres for vehicle-treated mdx (median, 1,200.087 μm2; 25th percentile, 1,200.08 μm2; 75th percentile, 2,420.57 μm2), n = 4,553 myofibres (median, 1,144.176 μm2; 25th percentile, 639.52 μm2; 75th percentile, 2,013.52 μm2) for non-magnetic NT-MAG-Exomyo III; n = 3,294 myofibres (median, 1,947.214 μm2; 25th percentile, 1,260.30 μm2; 75% percentile, 2,682.62 μm2) for NT-MAG-Exomyo III. Violin plots showing CSA median (dotted lines) and quartiles (solid lines); Kruskal–Wallis with Dunn’s multiple-comparison test. e, Representative SDH staining and quantification of the percentage of SDH+ myofibres. n = 5 mice per group; n = 24–26 slices per mouse. Data are presented as mean ± s.d.; Kruskal–Wallis with Dunn’s multiple-comparison test. f, Fibrosis was quantified using the hydroxyproline assay and muscle tissue isolated from NT-MAG-Exomyo III- and non-magnetic NT-Exomyo III-injected mice. n = 3 mice per group in two independent experiments; data are presented as mean ± s.d. Statistical analysis was performed using one-way ANOVA followed by post hoc Tukey multiple-comparison test. g. Cropped representative images of the Western blot showing the expression of proteins involved in OXPHOS complexes, autophagy mechanisms and inflammation (HMGB, non-canonical NF-κB and mTOR pathways) in muscle tissue from mdx mice treated with PBS (Vehicle), non-magnetic NT-MAG-Exomyo III and NT-MAG-Exomyo III. Bands were normalized for total protein loading (visualized by stain-free technology, in the Chemidoc system). Data are presented as mean ± s.d.; n = 3 mice per group; one-way ANOVA followed by post hoc Tukey multiple-comparison test. Source data
Fig. 6
Fig. 6. Magnetic delivery of NT-MAG-Exomyo determines anti-inflammatory polarization of muscle-infiltrating macrophages and muscle reprogramming in mdx mice.
Transcriptomic analysis of freshly FACS-purified circulating macrophages that infiltrated hind limb muscle tissues and entrapped CFSE+ exosomes (Ly6ChiCFSEhi; iMAC) in non-magnetic NT-Exomyo III (n = 3) and magnetic NT-MAG-Exomyo III (n = 3) mice (upper panel, ad). Transcriptomic analysis of single muscle fibres (MS) from the hind limb muscle tissues from non-magnetic NT-Exomyo III (n = 3), and magnetic NT-MAG-Exomyo III (n = 3) mice (bottom panel, eh). Mdx mice systemically injected with PBS were used as controls (vehicle, n = 3). a,e, Heatmap of Euclidean distances between log2 counts per million gene expression values across all macrophage samples (a) and myofibres (e). The colour scale ranges from 0 (indicating identical gene expression) in red to 400 (indicating the highest distance) in blue. b,f, Heatmap of log CPM expression values for the top 100 differentially expressed genes (DEGs) between groups, for muscle infiltrating macrophages (b) and myofibres (f). The colour scale ranges from low expression (blue) to high expression (red). Expression values were standardized. c,g, Venn diagram of the shared DEGs between groups, for muscle infiltrating macrophages (c) and myofibres (g). d,h, GO pathway analysis of upregulated (left) and downregulated (right) genes in muscle infiltrating macrophages (d) and myofibres (h). A one-sided version of Fisher’s exact test was used to determine whether known biological functions or processes are overrepresented in the list of differentially expressed genes. The P values are adjusted according to the Benjamini–Hochberg method. P value and q value cut-offs are 0.01 and 0.05, respectively. The size of each dot is proportional to the number of genes in the corresponding category. The colour scale represents the significance of the analysis for each category: red denotes higher significance; blue denotes lower significance.
Extended Data Fig. 1
Extended Data Fig. 1. Magnetic targeting ability of exosome nanocarriers in vitro.
a, Schematic of the two-step ionic self-assembly mechanism exploited to attach ferromagnetic nanoparticles (MAG-tau) and ExoMyo to the surface of nanotubes (NTs) to obtain multifunctional nanocarriers (NT-MAG-Exomyo). b, Transmission electronic microscopy (TEM) images of NTs functionalized with MAG-tau (top, NT-MAG, scale bar = 50 nm) and of NT-MAG-Exomyo (bottom, scale bar = 100 nm). Black and green arrows indicate the MAG-tau nanoparticles and exosomes, respectively. c, Exomyo release dynamic as a function of the environmental pH in buffer solution. Data are shown as mean ± SD; n = 3 independent experiments; two-way ANOVA followed by the post hoc Tukey multiple comparison test. d, Measurement of the magnetic relaxation rates, R2 and R1, as a function of the concentration of NT-MAG (left) and NT-MAG-Exomyo (right) in aqueous suspension. e, Digital image of the artificial circulatory system model exploited to investigate the effect of an external magnetic field on the diffusion of NT-MAG-647 and NT-MAG-Exomyo in the blood flux and across a biological tissue barrier. Schematic figure illustrating the arterial wall of C57Bl mice leaned against the reservoir. For magnetic delivery, a 0.5 Tesla ring magnet was applied to the reservoir. f, Confocal microscope images showing the localization of NT- MAG- 647 within the arterial elastic lamina (grey for contrast phase image) with and without magnet placement; confocal microscope image of NT-MAG-Exomyo (green) accumulating within the arterial elastic lamina (grey for contrast phase image, blue pseudocolor for laminin staining) 30 min after magnetic targeting. The amount of collected NT-MAG in the reservoir was calculated from the percentage of relative fluorescence. Scale bars = 20 μm. Data are presented as mean ± SD; n = 3 samples per group in two independent experiments; two-tailed unpaired t-test. Source data
Extended Data Fig. 2
Extended Data Fig. 2. Transcriptomic profiling of muscle iMAC isolated from mdx mice treated with NT-MAG-Exomyo III.
Transcriptomic analysis of freshly FACS-purified circulating macrophages that infiltrate hind limb muscle tissues and entrapped CFSE+ exosomes (Ly6ChiCFSEhi; iMAC) in NT-MAG-Exomyo I (n = 3), NT-MAG-Exomyo II (n = 3) and NT-MAG-Exomyo III (n = 3). Mdx mice systemically injected with PBS was used as control (vehicle, n = 3). a, Heatmap representation of Euclidean distances between log2 counts per million gene expression values across all samples. The colour scale represents the distance values, ranging from 0 (indicating identical gene expression) in red to 300 (indicating the highest distance) in blue. The heatmap provides a visual representation of the similarity or dissimilarity of gene expression patterns among samples. b, Heatmap representation of log CPM expression values for the top 100 differentially expressed genes between groups. The colour scale ranges from blue (indicating low expression) to red (indicating high expression). Expression values have been standardized. c, The Venn diagram representation of the shared DEGs between groups. d, Gene Ontology (GO) pathway analysis of up- and downregulated genes. One-sided version of Fisher’s exact test used to determine whether known biological functions or processes are overrepresented in the list of differentially expressed genes. The p-values are adjusted according to Benjamini–Hochberg method. P-value and q-value cutoff are 0.01 and 0.05, respectively. The size of each dot is proportional to the number of genes in the corresponding category. The colour scale represents the significance of the analysis for each category: red denotes higher significance; blue denotes lower significance.
Extended Data Fig. 3
Extended Data Fig. 3. Transcriptomic profiling of muscle fibres isolated from mdx mice treated with NT-MAG-Exomyo III.
Transcriptomic analysis of single muscle fibres (MS) of hind limb muscle tissues of mdx vehicle (n = 3), NT-MAG-Exomyo I (n = 3), NT-MAG-Exomyo II (n = 3) and NT-MAG-Exomyo III. a, Heatmap representation of Euclidean distances between log2 counts per million gene expression values across all samples. The colour scale represents the distance values, ranging from 0 (indicating identical gene expression) in red to 300 (indicating the highest distance) in blue. The heatmap provides a visual representation of the similarity or dissimilarity of gene expression patterns among samples. b, Heatmap representation of log CPM expression values for the top 100 differentially expressed genes between groups. The colour scale ranges from blue (indicating low expression) to red (indicating high expression). Expression values have been standardized. c, The Venn diagram representation of the shared DEGs between groups. d, Gene Ontology (GO) pathway analysis of up- and downregulated genes. One-sided version of Fisher’s exact test used to determine whether known biological functions or processes are overrepresented in the list of differentially expressed genes. The p-values are adjusted according to Benjamini–Hochberg method. P-value and q-value cutoff are 0.01 and 0.05, respectively. The size of each dot is proportional to the number of genes in the corresponding category. The colour scale represents the significance of the analysis for each category: red denotes higher significance; blue denotes lower significance.

References

    1. Raposo, G. & Stoorvogel, W. Extracellular vesicles: exosomes, microvesicles, and friends. J. Cell Biol.200, 373–383 (2013). - PMC - PubMed
    1. Jeppesen, D. K. et al. Reassessment of exosome composition. Cell177, 428–445 e418 (2019). - PMC - PubMed
    1. Monguio-Tortajada, M., Galvez-Monton, C., Bayes-Genis, A., Roura, S. & Borras, F. E. Extracellular vesicle isolation methods: rising impact of size-exclusion chromatography. Cell. Mol. Life Sci.76, 2369–2382 (2019). - PMC - PubMed
    1. Gartz, M., Darlington, A., Afzal, M. Z. & Strande, J. L. Exosomes exert cardioprotection in dystrophin-deficient cardiomyocytes via ERK1/2-p38/MAPK signaling. Sci. Rep.8, 16519 (2018). - PMC - PubMed
    1. Yanez-Mo, M. et al. Biological properties of extracellular vesicles and their physiological functions. J. Extracell. Vesicles4, 27066 (2015). - PMC - PubMed