. 2024 Aug;25(8):3651-3677.
doi: 10.1038/s44319-024-00213-7. Epub 2024 Jul 22.

Fam134c and Fam134b shape axonal endoplasmic reticulum architecture in vivo

Affiliations

Fam134c and Fam134b shape axonal endoplasmic reticulum architecture in vivo

Francescopaolo Iavarone et al. EMBO Rep. 2024 Aug.

Abstract

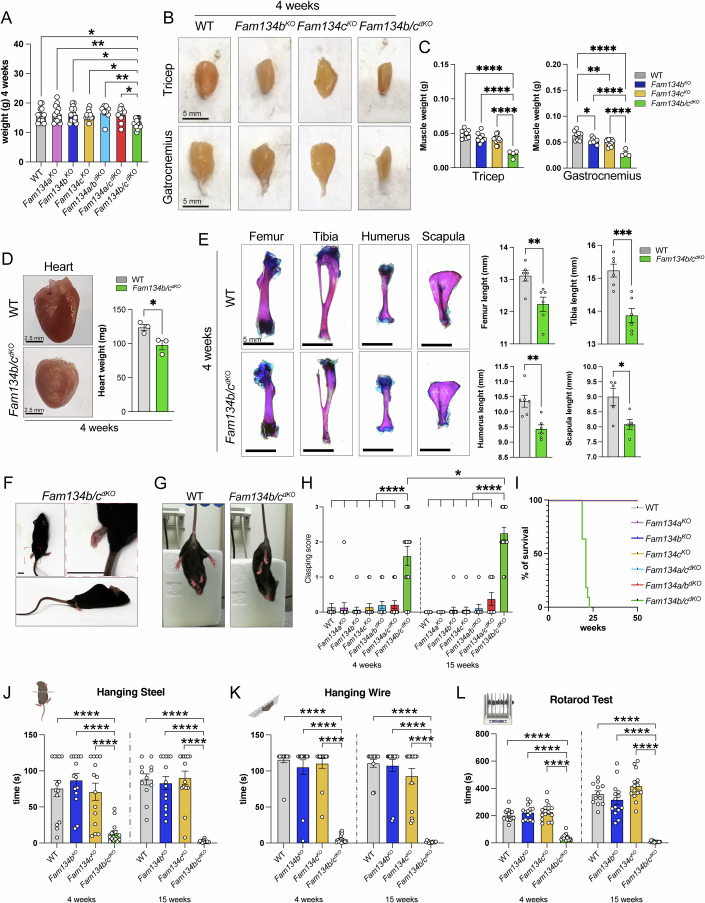
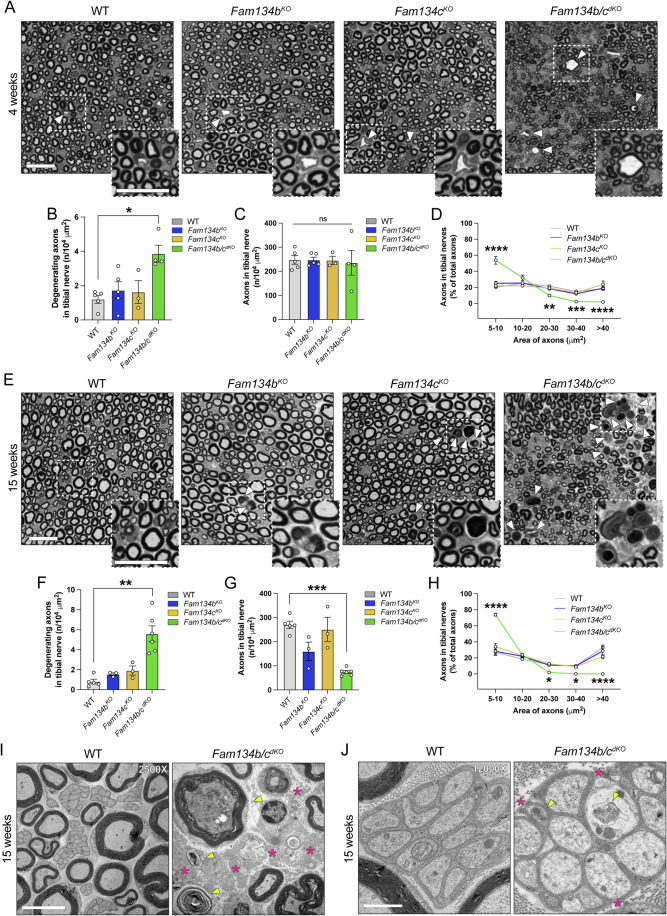
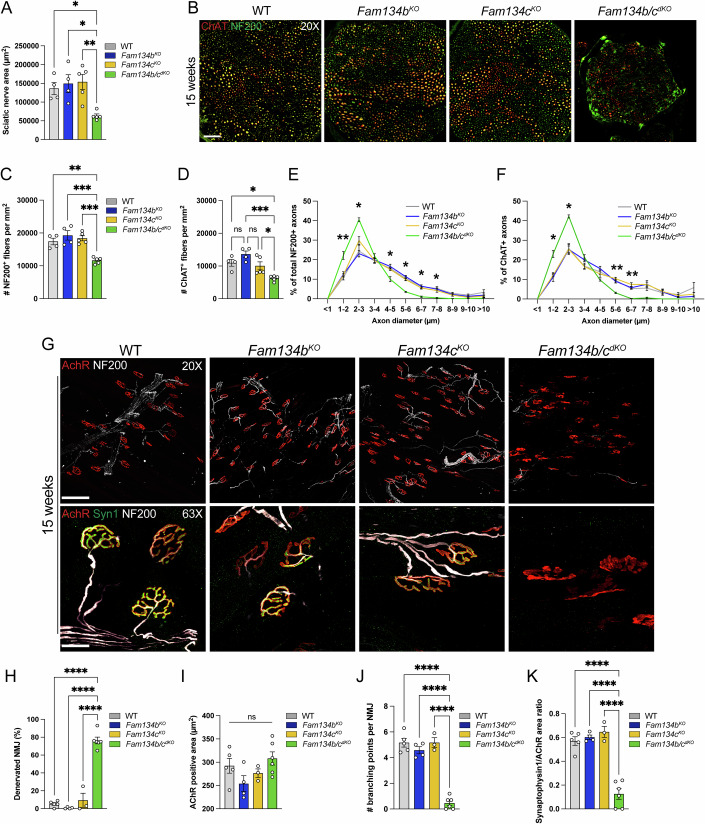
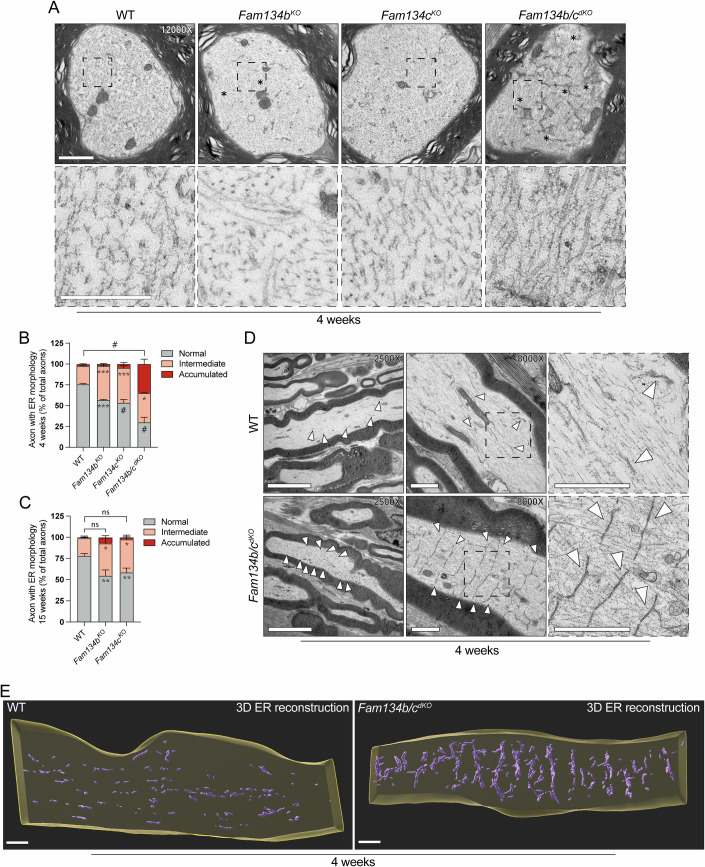
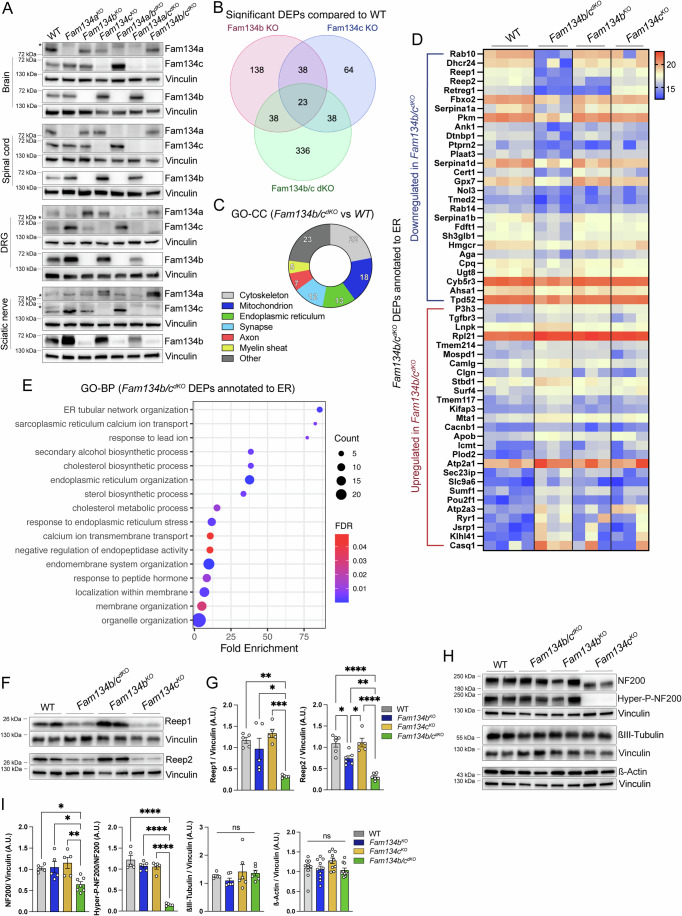
Endoplasmic reticulum (ER) remodeling is vital for cellular organization. ER-phagy, a selective autophagy targeting ER, plays an important role in maintaining ER morphology and function. The FAM134 protein family, including FAM134A, FAM134B, and FAM134C, mediates ER-phagy. While FAM134B mutations are linked to hereditary sensory and autonomic neuropathy in humans, the physiological role of the other FAM134 proteins remains unknown. To address this, we investigate the roles of FAM134 proteins using single and combined knockouts (KOs) in mice. Single KOs in young mice show no major phenotypes; however, combined Fam134b and Fam134c deletion (Fam134b/cdKO), but not the combination including Fam134a deletion, leads to rapid neuromuscular and somatosensory degeneration, resulting in premature death. Fam134b/cdKO mice show rapid loss of motor and sensory axons in the peripheral nervous system. Long axons from Fam134b/cdKO mice exhibit expanded tubular ER with a transverse ladder-like appearance, whereas no obvious abnormalities are present in cortical ER. Our study unveils the critical roles of FAM134C and FAM134B in the formation of tubular ER network in axons of both motor and sensory neurons.

Keywords: Axon; Endoplasmic Reticulum; FAM134B; FAM134C.


Conflict of interest statement

The authors declare no competing interests.

Figures

Figure 1
Figure 1. Fam134b/c double KO mice exhibit defective growth and neurological impairment.
(A) Fam134b/c double KO (Fam134b/cdKO) mice show reduced body weight at 4 weeks of age, as compared to the other Fam134 mutant mice. n ≥ 8 animals/group. Statistical significance was determined by one-way ANOVA followed by Tukey’s multiple comparisons test. Data represent mean ± SEM. *P < 0.05, **P < 0.01. (B) Representative images of tricep and gastrocnemius muscles from WT, Fam134bKO, Fam134cKO and Fam134b/cdKO mice aged 4 weeks. Scale bar, 5 mm. (C) The weight of tricep and gastrocnemius muscles are massively reduced in Fam134b/cdKO mice. n ≥ 4 animals/group. Statistical significance was determined by one-way ANOVA followed by Tukey’s multiple comparisons test. Data represent mean ± SEM. *P < 0.05, **P < 0.01, ****P < 0.0001. (D) Representative images of cardiac muscle from WT and Fam134b/cdKO mice aged 4 weeks, showing a reduced weight in Fam134b/cdKO compared with WT. n = 3 animals/group. Statistical significance was determined by Student’s t-test. Data represent mean ± SEM. *P = 0.0348. (E) Representative images of the femur, tibia, humerus, and scapula from WT and Fam134b/cdKO mice aged 4 weeks, showing decreased length in Fam134b/cdKO compared with WT mice. Scale bar, 5 mm. n ≥ 5 animals/group. Statistical significance was determined by Student’s t-test. Data represent mean ± SEM. *P = 0.0235, **P = 0.0034 (humerus), **P = 0.0094 (femur), ***P = 0.0009. (F) Representative images of aching posture and loss of hindlimb mobility in Fam134b/cdKO mice. Scale bars, 1 cm. (G) Representative images of 4-week-old Fam134b/cdKO and WT mice showing hindlimb clasping in Fam134b/cdKO mice while they are suspended by the tail. (H) Clasping test scores in 4-week-old and 15-week-old mice with the indicated genotypes displaying an early-onset and progressive increase of the clasping sign in Fam134b/cdKO mice compared with the other indicated genotypes. The score assigned ranges from 0 (no alterations) to 3 (severe alterations). n ≥ 12 animals/group. Statistical significance was determined by one-way ANOVA, followed by Tukey’s multiple comparisons test. Data represent mean ± SEM. *P < 0.05, ****P < 0.0001. (I) Kaplan–Meier survival curves relative to all the indicated mouse models showing a reduced lifespan of Fam134b/cdKO mice. n ≥ 5 animals/group. (JL) Evaluation of motor activity showing Fam134b/cdKO mice fail to complete hanging steel (J), hanging wire (K), and rotarod (L) test at both time points analyzed, compared with Fam134bKO, Fam134cKO, and WT mice. n ≥ 12 animals/group. Statistical significance was determined by one-way ANOVA, followed by Tukey’s multiple comparisons test. ****P < 0.0001. Data information: Statistical analysis and exact P values are included in the source data files. Images of behavioral tests were generated using Biorender. Source data are available online for this figure.
Figure 2
Figure 2. Fam134b/cdKO sciatic nerves show progressive degeneration.
(A) Representative toluidine staining of tibial nerves of WT, Fam134bKO, Fam134cKO, and Fam134b/cdKO mice aged 4 weeks. White arrowheads indicate degenerating axons. Scale bar, 20 µm. (BD) Fam134b/cdKO mice show a mild degeneration of axons in tibial nerves (B, C) and an increased number of axons with small diameter (D) respect with WT, Fam134bKO, and Fam134cKO mice aged 4 weeks. (E) Representative toluidine staining of tibial nerves of WT, Fam134bKO, Fam134cKO, and Fam134b/cdKO mice aged 15 weeks. White arrowheads indicate degenerating axons. Scale bar, 20 µm. (FH) Fam134b/cdKO mice show increased degeneration of axons in tibial nerves (F), a reduction of axons (G), and an increased number of axons with small diameter (H) compared with WT, Fam134bKO, and Fam134cKO mice. (I) Representative electron micrographs showing degenerating axons accumulating organelles and cytoskeletal components (yellow arrows) in sciatic nerves of WT and Fam134b/cdKO mice aged 15 weeks. Collagen areas are indicated by magenta asterisks. Scale bar, 5 µm. (J) Unmyelinated axons exhibit accumulation of material (yellow arrows) and incomplete wrapping by Schwann cells (magenta asterisks) in tibial nerves of Fam134b/cdKO aged 15 weeks. Scale bar, 1 µm. Data information: n ≥ 3 animals/group in all experiments. Statistical significance was determined by one-way ANOVA (B, C, F, G) followed by Dunn’s multiple comparison test (B) or Dunnett’s T3 multiple comparisons test (C, F, G); or two-way ANOVA (D, H) followed by Sidak’s multiple comparisons test. Data represent mean ± SEM. ns P > 0.05, *P < 0.05, **P < 0.01, ***P < 0.001, ****P < 0.0001. Statistical analysis and exact P values are included in the source data files. Source data are available online for this figure.
Figure 3
Figure 3. Fam134b/cdKO leads to axonal neurodegeneration and denervation of neuromuscular junctions.
(A) Area quantification of tibial sciatic nerve showing a significant decrease in Fam134b/cdKO compared with the other genotypes. (B) Representative immunofluorescence staining of ChAT (red) and NF200 (green) in tibial sciatic nerve sections from WT, Fam134bKO, Fam134cKO, and Fam134b/cdKO mice aged 15 weeks. Scale bar, 50 µm. (C, D) Number of NF200+ (C) or ChAT+ (D) axons per mm2 indicating a decreased density in Fam134b/cdKO compared with the other genotypes. (E, F) Diameter distribution of NF200+ (E) or ChAT+ (F) axons showing accumulation of smaller sized axons in Fam134b/cdKO compared to the other genotypes. (G) Representative immunofluorescence staining of AchR (red), NF200 (gray), and Syn1 (green) in EDL muscle of WT, Fam134bKO, Fam134cKO, and Fam134b/cdKO mice aged 15 weeks. Scale bars, 100 µm and 25 µm, respectively, in the ×20 and ×63 magnification. (H) Fam134b/cdKO muscles show an increased percentage of denervated neuromuscular junctions (NMJs) compared with the other genotypes. (I) AchR mean positive area showed there were no significant changes among the different genotypes. (J) Fam134b/cdKO NMJs show a decreased number of branches compared with the other genotypes. (K) The ratio between Syn1 and AChR positive area is reduced in Fam134b/cdKO NMJs compared with the other genotypes. Data information: n ≥ 4 animals/group in all experiments. Statistical significance was determined by one-way ANOVA (A, C, D, HK) or two-way ANOVA (E, F) followed by Tukey’s multiple comparisons test. Data represent mean ± SEM. ns P > 0.05, *P < 0.05, **P < 0.01, ***P < 0.001, ****P < 0.0001. Statistical analysis and exact P values are included in the source data files. Source data are available online for this figure.
Figure 4
Figure 4. Early accumulation of ladder-like ER in Fam134b/cdKO sciatic nerve axons.
(A) Representative electron micrographs of ER in tibial nerves axons from WT, Fam134bKO, Fam134cKO, and Fam134b/cdKO mice aged 4 weeks. Alterations of the cytoskeleton are highlighted with asterisks. Scale bar, 1 µm or 500 nm in the insets. (B, C) Analysis of accumulated ER showing a high accumulation in Fam134b/cdKO axons at 4 weeks (B), whereas Fam134bKO and Fam134cKO axons exhibit an intermediate accumulation that is constant at 4 and 15 weeks of age (B, C). Fam134b/cdKO axons are not represented in (C) because they were degenerating and thus not analyzed. n = 3 animals/group. Statistical significance was determined by two-way ANOVA followed by Tukey’s multiple comparisons test. Data represent mean ± SEM. Statistics indicate comparison with WT. ns P > 0.05, *P < 0.05, **P < 0.01, ***P < 0.001, #P < 0.0001. Statistical analysis and exact P values are included in the source data files. (D) Representative electron micrographs of longitudinal axon tomograms from WT and Fam134b/cdKO mice aged 4 weeks. ER membranes are indicated with white arrowheads. Scale bar, 5 µm (×2500 magnifications) and 1 µm (×8000 magnifications and their enlargements). (E) 3D reconstruction of the tomogram in (D) showing ER segmented of WT and Fam134b/cdKO mice aged 4 weeks. Scale bar, 0.5 µm. Source data are available online for this figure.
Figure 5
Figure 5. Proteins related to the organization of tubular ER and cytoskeleton are reduced in Fam134b/cdKO sciatic nerves.
(A) Western blot analysis showing protein expression of Fam134 proteins in brain, lumbar spinal cord, lumbar DRG, and sciatic nerve of 2-week-old mice with the indicated genotypes. Asterisks indicate a specific band. (B) Venn diagram showing significant differentially expressed proteins (DEPs) in sciatic nerves of Fam134bKO, Fam134cKO, and Fam134b/cdKO compared with WT. (C) Cellular components gene ontology enrichment in Fam134b/cdKO DEPs are represented as a percentage of total Fam134b/cdKO DEPs. (D) Heatmap based on significant Fam134b/cdKO DEPs annotated to ER and comparing WT, Fam134bKO, and Fam134cKO, and Fam134b/cdKO protein intensity values. The protein abundance scale is depicted on the top right. (E) Most relevant terms from Gene Ontology Biological Process (GO-BP) of Fam134b/cdKO DEPs annotated to ER are represented by dot plots indicating FDR, DEP count, and fold enrichment. n ≥ 3 animals/group. FDR < 0.05. (F) Western blot analysis showing Reep1 and Reep2 protein levels in the sciatic nerve of 2-week-old mice with the indicated genotypes. (G) Quantification of Reep1 and Reep2 protein levels normalized to vinculin. n ≥ 5 animals/group. (H) Western blot analysis showing total and hyperphospho- neurofilament heavy chain (NF200), beta-III-Tubulin, and beta-Actin protein levels in the sciatic nerve of 2-week-old mice with the indicated genotypes. (I) Protein quantification relative to (H) normalized to vinculin, or to total NF200 in the case of Hyperphospho-NF200. n ≥ 5 animals/group. Data information: Statistical significance was determined by one-way ANOVA (G, I) followed by Tukey’s multiple comparisons test. Data represent mean ± SEM. ns P > 0.05, *P < 0.05, **P < 0.01, ***P < 0.001, ****P < 0.0001. Statistical analysis and exact P values are included in the source data files. Source data are available online for this figure.
Figure EV1
Figure EV1. Fam134b/c combined deletion determines a progressive neurological impairment.
(A) Fam134b/cdKO mice show reduced body weight at 15 weeks of age, as compared with the other Fam134 mutant mice. n ≥ 7 animals/group. (B) Representative images of tricep and gastrocnemius muscles from WT, Fam134bKO, Fam134cKO, and Fam134b/cdKO mice aged 15 weeks. Scale bar, 5 mm. (C) The weight of tricep and gastrocnemius muscles are massively reduced in Fam134b/cdKO mice. n ≥ 4 animals/group. (D) Representative images of 4-week-old mice with the indicated genotypes showing hindlimb clasping of Fam134b/cdKO mice while they are suspended by the tail. The images relative to WT and Fam134b/cdKO mice are also shown in Fig. 1G. (E, F) Open field test scores relative to total distance (E) and maximum speed (F) performed by WT, Fam134bKO, and Fam134cKO, and Fam134b/cdKO mice aged 4 or 15 weeks, indicating a worsening of performance in 15-week-old Fam134b/cdKO mice compared with the other genotypes. n ≥ 12 animals/group. (G) Track plot relative to the exploration of WT, Fam134bKO, Fam134cKO, and Fam134b/cdKO mice during the open field test at the indicated age, showing a dramatic decrease of Fam134b/cdKO mice movement at 15 weeks of age. (H) Hot plate test indicating increased latency (s) of first hind paw pain response in Fam134b/cdKO mice aged 4 and 15 weeks respect with the indicated genotypes. n ≥ 12 animals/group. (IK) Extracellular single-unit in vivo recordings of spinal nociceptive neurons in 4-week-old mice, measuring the spontaneous activity or firing rate (I), the activity evoked by mechanical stimulation (J), as well as the duration of evoked activity (K). Fam134b/cdKO and, at a lower extent, Fam134cKO mice exhibit an increase in all the parameters analyzed compared with the other genotypes. n ≥ 3 animals/group. Data information: Statistical significance was determined by one-way ANOVA (A, C, E, F, HK) followed by Tukey’s multiple comparisons test. Data represent mean ± SEM. ns P > 0.05, *P < 0.05, **P < 0.01, ***P < 0.001, ****P < 0.0001. Statistical analysis and exact P values are included in the source data files. Images of behavioral tests were generated using Biorender. Source data are available online for this figure.
Figure EV2
Figure EV2. Early onset of axonal neurodegeneration and denervation of neuromuscular junctions in Fam134b/cdKO.
(A) Quantification of the tibial sciatic nerve area shows a significant decrease in Fam134b/cdKO compared with the other genotypes. (B) Representative immunofluorescence staining of ChAT (red) and NF200 (green) in tibial sciatic nerve sections from 4-weeks-old WT, Fam134bKO, Fam134cKO and Fam134b/cdKO mice. Scale bar, 50 µm. (C, D) Number of NF200+ (C) or ChAT+ (D) axons per mm2 showing no difference among genotypes. (E, F) Diameter distribution of NF200+ (E) or ChAT+ (F) axons showing accumulation of smaller sized axons in Fam134b/cdKO compared with the other genotypes. (G) Representative immunofluorescence staining of AchR (red), NF200 (gray), and Syn1 (green) in EDL muscle from 4-weeks-old WT, Fam134bKO, Fam134cKO, and Fam134b/cdKO mice. Scale bars, 100 µm and 25 µm, respectively, in the ×20 and ×63 magnification. (H) Fam134b/cdKO muscles show an increased percentage of denervated neuromuscular junctions (NMJs) compared with the other genotypes. (I) AchR mean positive area indicates no main changes among the different genotypes. (J) Fam134b/cdKO NMJs show a decreased number of branches compared with the other genotypes. (K) The ratio between the Syn1 and AChR positive area is reduced in Fam134b/cdKO NMJs compared to the other genotypes. Data information: n ≥ 4 animals/group in all experiments. Statistical significance was determined by one-way ANOVA (A, C, D, HK) or two-way ANOVA (E, F), followed by Tukey’s multiple comparisons test. Data represent mean ± SEM. ns P > 0.05, *P < 0.05, **P < 0.01, ***P < 0.001, ****P < 0.0001. Statistical analysis and exact P values are included in the source data files. Source data are available online for this figure.
Figure EV3
Figure EV3. Schwann cell, motoneuron, and sensory neuron soma show no ultrastructural alteration in Fam134b/cdKO mice.
(A, B) Quantification of the g-ratio of WT, Fam134bKO, Fam134cKO, and Fam134b/cdKO myelinated axons from tibial nerves aged 4 (A) and 15 (B) weeks. n = 3 animals/group. Data represent mean ± SEM. (C) Representative electron micrographs showing Schwann cells in WT and Fam134b/cdKO sciatic nerve aged 4 weeks. Scale bar, 2 µm. (D) Representative electron micrographs of motoneurons in the ventral horn of the lumbar spinal cord from WT and Fam134b/cdKO mice aged 4 weeks. (E) Representative electron micrographs of neurons in lumbar DRG from WT and Fam134b/cdKO mice aged 4 weeks. Scale bars, 1000 nm or 500 nm in the insets. Source data are available online for this figure.
Figure EV4
Figure EV4. Autophagy and histology of sciatic nerve show no major alterations in 2-week-old Fam134b/cdKO mice.
(A) Western blot analysis showing protein expression of autophagy markers (Sqstm1/p62 and Lc3b), the ER marker Calnexin, and ER-phagy receptors (Atl3, Tex264, Ccpg1, and Rtn3) in sciatic nerve of 2-week-old mice with the indicated genotypes. (BD) Protein level quantification of autophagy markers (B), Calnexin (C), and ER-phagy receptors (D). Normalized to vinculin. n ≥ 4 animals/group. (E) Representative immunofluorescence staining of ChAT (red) and NF200 (green) in tibial sciatic nerve sections of WT and Fam134b/cdKO mice aged 2 weeks. Scale bar, 50 µm. (F) Quantification of the tibial sciatic nerve area showing no difference between WT and Fam134b/cdKO mice. (GJ) Morphometric analysis of axons shows no alterations between WT and Fam134b/cdKO mice either in both the number of NF200+ (G) and ChAT+ axons (H) or in their diameter distribution (I, J). n = 3 animals/group. Data information: Statistical significance was determined by one-way ANOVA (BD) followed by Tukey’s multiple comparisons test or Student’s t-test (FH). Data represent mean ± SEM. ns P > 0.05, *P < 0.05, **P < 0.01. Statistical analysis and exact p-values are included in the source data files. Source data are available online for this figure.
Figure EV5
Figure EV5. Altered lipidome profile in Fam134b/cdKO sciatic nerve.
(A) Heatmap reporting the top 50 statistically significant lipids and comparing WT, Fam134bKO, Fam134cKO, and Fam134b/cdKO. The log2 relative lipid quantity scale is depicted on the top right. (B) Lipid concentration in WT, Fam134bKO, Fam134cKO, and Fam134b/cdKO sciatic nerves grouped in lipid subclasses. Lipid quantity is expressed in pmol and normalized to µg of total protein. n = 5 animals/group, 2 replicates/animal. Statistical significance was determined by one-way ANOVA followed by Tukey’s multiple comparisons test. Data represent mean ± SEM. ns P > 0.05, *P < 0.05, **P < 0.01, ***P < 0.001, ****P < 0.0001. Statistical analysis and exact P values are included in the source data files. Source data are available online for this figure.

References

    1. Beetz C, Koch N, Khundadze M, Zimmer G, Nietzsche S, Hertel N, Huebner AK, Mumtaz R, Schweizer M, Dirren E et al (2013) A spastic paraplegia mouse model reveals REEP1-dependent ER shaping. J Clin Invest 123:4273–4282 10.1172/JCI65665 - DOI - PMC - PubMed
    1. Beetz C, Pieber TR, Hertel N, Schabhuttl M, Fischer C, Trajanoski S, Graf E, Keiner S, Kurth I, Wieland T et al (2012) Exome sequencing identifies a REEP1 mutation involved in distal hereditary motor neuropathy type V. Am J Hum Genet 91:139–145 10.1016/j.ajhg.2012.05.007 - DOI - PMC - PubMed
    1. Belevich I, Joensuu M, Kumar D, Vihinen H, Jokitalo E (2016) Microscopy image browser: a platform for segmentation and analysis of multidimensional datasets. PLoS Biol 14:e1002340 10.1371/journal.pbio.1002340 - DOI - PMC - PubMed
    1. Berkane R, Ho-Xuan H, Glogger M, Sanz-Martinez P, Brunello L, Glaesner T, Kuncha SK, Holzhuter K, Cano-Franco S, Buonomo V et al (2023) The function of ER-phagy receptors is regulated through phosphorylation-dependent ubiquitination pathways. Nat Commun 14:8364 10.1038/s41467-023-44101-5 - DOI - PMC - PubMed
    1. Bhaskara RM, Grumati P, Garcia-Pardo J, Kalayil S, Covarrubias-Pinto A, Chen W, Kudryashev M, Dikic I, Hummer G (2019) Curvature induction and membrane remodeling by FAM134B reticulon homology domain assist selective ER-phagy. Nat Commun 10:2370 10.1038/s41467-019-10345-3 - DOI - PMC - PubMed