. 2024 Jul 22;22(1):674.
doi: 10.1186/s12967-024-05505-z.

Upregulation of Siglec-6 induces mitochondrial dysfunction by promoting GPR20 expression in early-onset preeclampsia

Affiliations

Upregulation of Siglec-6 induces mitochondrial dysfunction by promoting GPR20 expression in early-onset preeclampsia

Yuanhui Jia et al. J Transl Med. .

Abstract

Background: Preeclampsia, especially early-onset preeclampsia (EO-PE), is a pregnancy complication that has serious consequences for the health of both the mother and the fetus. Although abnormal placentation due to mitochondrial dysfunction is speculated to contribute to the development of EO-PE, the underlying mechanisms have yet to be fully elucidated.

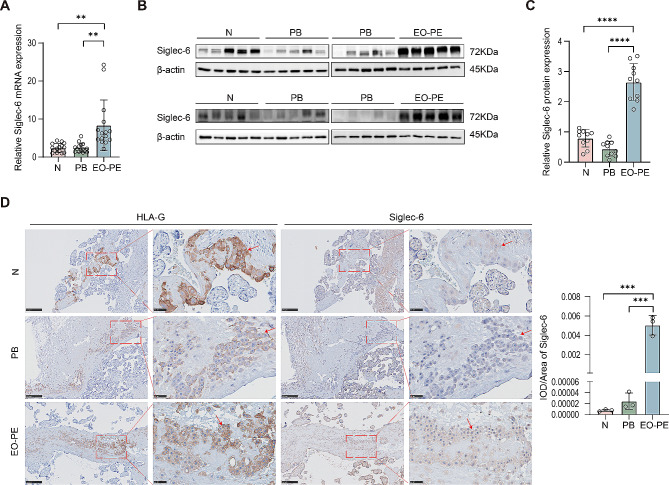
Methods: The expression and localization of Siglec-6 in the placenta from normal pregnancies, preterm birth and EO-PE patients were examined by RT-qPCR, Western blot and IHC. Transwell assays were performed to evaluate the effect of Siglec-6 on trophoblast cell migration and invasion. Seahorse experiments were conducted to assess the impact of disrupting Siglec-6 expression on mitochondrial function. Co-IP assay was used to examine the interaction of Siglec-6 with SHP1/SHP2. RNA-seq was employed to investigate the mechanism by which Siglec-6 inhibits mitochondrial function in trophoblast cells.

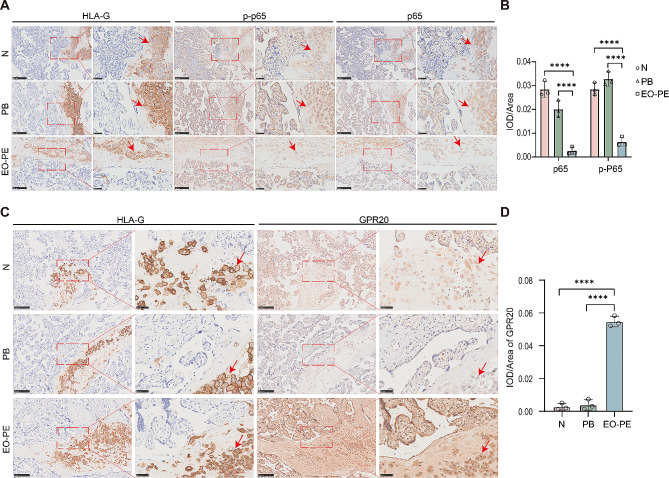
Results: The expression of Siglec-6 in extravillous trophoblasts is increased in placental tissues from EO-PE patients. Siglec-6 inhibits trophoblast cell migration and invasion and impairs mitochondrial function. Mechanismly, Siglec-6 inhibits the activation of NF-κB by recruiting SHP1/SHP2, leading to increased expression of GPR20. Notably, the importance of GPR20 function downstream of Siglec-6 in trophoblasts is supported by the observation that GPR20 downregulation rescues defects caused by Siglec-6 overexpression. Finally, overexpression of Siglec-6 in the placenta induces a preeclampsia-like phenotype in a pregnant mouse model.

Conclusions: This study indicates that the regulatory pathway Siglec-6/GPR20 has a crucial role in regulating trophoblast mitochondrial function, and we suggest that Siglec-6 and GPR20 could serve as potential markers and targets for the clinical diagnosis and therapy of EO-PE.

Keywords: Early-onset preeclampsia; Extravillous trophoblast; GPR20; Mitochondria; Preeclampsia; Siglec-6.


Conflict of interest statement

The authors declare no conflict of interests.

Figures

Fig. 1
Fig. 1
Aberrant expression of Siglec-6 is found in early-onset preeclamptic placenta. (A) qRT-PCR analysis of the Siglec-6 mRNA level in the placentas from full term pregnancies (n = 15), preterm birth (n = 15) and EO-PE (n = 15) patients. (B) Western blot analysis of Siglec-6 mRNA and protein levels in the placentas from full term pregnancies (n = 10), preterm birth (n = 10) and EO-PE (n = 10) patients. (C) Statistical analysis of protein densitometry quantification in Western blot (B). (D) Representative images of Siglec-6 expression and localization in the clinical samples (n = 3) by IHC analysis. Measurement of the IOD/area of immunohistochemical staining of Siglec-6. Red arrows point to EVTs (original magnification, 100×, scale bar = 250 μm; 400×, scale bar = 50 μm). N: normal pregnancy, PB: preterm birth, EO-PE: early-onset preeclampsia, HLA-G: human leucocyte antigen-G. All the statistical data were analyzed by Student’s t-test. All data are means ± SEM. **p<0.01, ***p<0.001, ****p<0.0001
Fig. 2
Fig. 2
Siglec-6 is essential for trophoblast cell migration and invasion. (A) Western blot analysis of Siglec-6 protein levels in the stable HTR-8/SVneo cell line over-expressing Siglec-6. (B) Migration and invasion of stable HTR-8/SVneo cell line over-expressing Siglec-6 were determined by transwell assay. Representative images are shown. (C, D) The number of migrated and invaded HTR-8/SVneo cell line over-expressing Siglec-6 was counted. (E) Western blot analysis of the Siglec-6 protein level in HTR-8/SVneo cells transfected with siNC or siSiglec-6. (F) Migration and invasion of HTR-8/SVneo cells transfected with siNC or siSiglec-6 were determined by transwell assay. Representative images are shown. (G, H) The number of migrated and invaded HTR-8/SVneo cells transfected with siNC or siSiglec-6 was counted. All the statistical data were analyzed by Student’s t-test (two groups) or one-way ANOVA (above two groups). All data are means ± SEM of three independent experiments performed in triplicate. **p < 0.01; ****p < 0.0001
Fig. 3
Fig. 3
Effects of Siglec-6 on mitochondrial morphology and function in trophoblast cells. (A) TEM of the stable HTR-8/SVneo cell line over-expressing Siglec-6. N, nucleus; M, mitochondria; ASS, autophagy lysosome; AP, autophagic vesicle. (TEM, original magnification, 10,000×, scale bar = 1 μm; 20,000×, scale bar = 0.5 μm). (B) Mitochondrial surface area was measured. The activities of mitochondrial complex III (C) and IV (D) of the stable HTR-8/SVneo cell line over-expressing Siglec-6 and HTR-8/SVneo cells transfected with siNC or siSiglec-6 were measured. (E) ROS levels of the stable HTR-8/SVneo cell line over-expressing Siglec-6 and HTR-8/SVneo cells transfected with siNC or siSiglec-6 were measured. Flow cytometry was used to determine changes in mitochondrial membrane potential in in the stable HTR-8/SVneo cell line overexpressing Siglec-6, and in HTR-8/SVneo cells transfected with either siNC or siSiglec-6, using TMRE as the fluorescent probe. (F) Quantification of results shown in E. Western blot analysis of protein levels of PINK1 (G), PARKIN (H) or LC3B-II/ LC3B-I (I) in the stable HTR-8/SVneo cell line over-expressing Siglec-6, and quantified respectively. All protein levels are normalized to β-actin. (J, Q) Mitochondrial oxygen consumption rate (OCR) was recorded using Seahorse analyzer. Basal oxygen consumption (K, R), maximal respiration capacity (L, S), non-mitochondrial oxygen consumption (M, T), spare respiratory capacity (N, U), proton leak (O, V) and ATP production (P, W) were determined by using the Seahorse analyzer in the stable HTR-8/SVneo cell line over-expressing Siglec-6 and HTR-8/SVneo cells transfected with siNC or siSiglec-6. Results are shown as mean ± SEM. All the statistical data were analyzed by Student’s t-test (B, G-I, K-P) or one-way ANOVA (C-F, R-W). *p<0.05, **p<0.01, ***p<0.001, ****p<0.0001
Fig. 4
Fig. 4
Siglec-6 upregulates GPR20 expression through SHP1/SHP2-NF-κB pathway in trophoblast cells. Heatmap (A) and volcano plot (B) of differentially expressed genes between the vector and the Siglec-6 overexpression group. (C) qRT-PCR analysis of the GPR20 mRNA level in the stable HTR-8/SVneo cell line over-expressing Siglec-6. Data are the mean ± SEM (n = 3). Statistical data were analyzed by Student’s t-test. *p < 0.05. (D) Western blot analysis of Siglec-6 and GPR20 protein levels in the stable HTR-8/SVneo cell line over-expressing Siglec-6. Stable HTR-8/SVneo cell lysis was incubated with anti-Flag or anti-SHP1/SHP2, then analyzed by western blot using specific antibody to SHP1 (E)/SHP2 (F) or Flag. (G) Western blot analysis of protein levels of pSer536-p65 or p65 in the stable HTR-8/SVneo cell line over-expressing Siglec-6. (H) Quantification of the expression of the pSer536-p65 protein in Western blot G. Data are the mean ± SEM (n = 3). Statistical data were analyzed by Student’s t-test. ****p < 0.0001. (I) The GPR20 promoter was detected with ChIP assays with anti-NF-κB/p65 antibody, and then analyzed by quantitative PCR. The value represents the effect of the NF-κB/p65 occupancies at the promoter of GPR20. Data are the mean ± SEM (n = 3). Statistical data were analyzed by Student’s t-test. **p < 0.01. (J) 293T cells were transfected with NF-κB/p65 overexpression plasmid or vector control for 48 h, after which the transfected cells were co-transfected with a wild-type GPR20-luciferase transcriptional reporter. Data are expressed as mean fold induction ± SEM of luciferase activity relative to controls (n = 3). Statistical data were analyzed by two-way ANOVA. **p < 0.01
Fig. 5
Fig. 5
GPR20 acts as a key factor downstream of Siglec-6 to regulate the function of mitochondria in trophoblast cells. (A) Western blot analysis of GPR20 protein levels in HTR-8/SVneo cells transfected with siNC or siGPR20. (B) TEM of the stable cell lines. N, nucleus. M, mitochondria. (C) Mitochondrial surface area was measured. The activities of mitochondrial complex III (D) and IV (E) of the stable cell lines were measured. (F) ROS levels of the stable cell lines were measured. (G) Flow cytometric determination of mitochondrial membrane potential changes in the stable cell lines by TMRE. (H) Mitochondrial OCR was recorded using Seahorse analyzer. Basal oxygen consumption (I), maximal respiration capacity (J), non-mitochondrial oxygen consumption (K), ATP production (L), proton leak (M), and spare respiratory capacity (N) were determined by using the Seahorse analyzer in the stable cell lines. (O) Migration and invasion of the stable cell lines were determined by transwell assay. (P) The number of migrated and invaded cells was counted. (Q) c-AMP levels of the stable cell lines were measured. (R-T) Western blot analysis of protein levels of pThr197-PKA, PKA, pThr202/Tyr204-ERK or ERK and quantification of the expression of the pThr197-PKA or pThr202/Tyr204-ERK protein in the stable HTR-8/SVneo cell line over-expressing Siglec-6. Data are the mean ± SEM (n = 3). All the statistical data were analyzed by Student’s t-test (two groups) or two-way ANOVA (above two groups). *p < 0.05, **p < 0.01, ***p < 0.001, ****p < 0.0001
Fig. 6
Fig. 6
GPR20 and NF-κB are aberrantly expressed in decidua-embedded EVTs from EO-PE. (A) Representative images of HLA-G, pSer536-p65 or p65 expression and localization in the placentas from full term pregnancies, preterm birth and EO-PE patients by IHC analysis (n = 3). (B) Measurement of the IOD/area of immunohistochemical staining of pSer536-p65 or p65. (C) Representative images of HLA-G or GPR20 expression and localization in the clinical samples. (D) Measurement of the IOD/area of immunohistochemical staining of GPR20. Red arrows point to EVTs (original magnification, 100×, scale bar = 250 μm; 400×, scale bar = 50 μm). N: normal pregnancy, PB: preterm labor, EO-PE: early onset preeclampsia, HLA-G: human leucocyte antigen. Results are shown as mean ± SEM. All the statistical data were analyzed by Student’s t-test (D) or two-way ANOVA (B). ****p<0.0001
Fig. 7
Fig. 7
Overexpression of Siglec-6 in the placenta specifically leads to a PE-like phenotype in pregnant mice. The SBP (A), DBP (B), total urinary protein (C) of pregnant mice. (D) H&E staining of mouse placentas. JZ, junctional zone; L, labyrinth. (E) Ratio of junctional zone area to labyrinth zone area in mice. (F) IHC staining for CD31 in mouse placental tissues. Brown color indicates positive staining for CD31. (G) The area fraction of CD31 staining in labyrinth was measured. (H) TEM of mouse placentas. N, nucleus; M, mitochondria. Scale bar: 500 nm. (I) Mitochondrial surface area was measured. (J-M) Western blot analysis of protein levels of pSer536-p65, p65 or GPR20 and quantification of pSer536-p65 or GPR20 protein expression in mouse placentas. Results are shown as mean ± SEM. All the statistical data were analyzed by Student’s t-test (E, G, I, K-M) or one-way ANOVA (A-C). *p<0.05, **p<0.01, ***p<0.001, ****p<0.0001

References

    1. Brown MA, Magee LA, Kenny LC, Karumanchi SA, McCarthy FP, Saito S, Hall DR, Warren CE, Adoyi G, Ishaku S. International Society for the Study of Hypertension in P: Hypertensive disorders of pregnancy: ISSHP classification, diagnosis, and Management recommendations for International Practice. Hypertension. 2018;72:24–43. 10.1161/HYPERTENSIONAHA.117.10803 - DOI - PubMed
    1. Phipps EA, Thadhani R, Benzing T, Karumanchi SA. Pre-eclampsia: pathogenesis, novel diagnostics and therapies. Nat Rev Nephrol. 2019;15:275–89. 10.1038/s41581-019-0119-6 - DOI - PMC - PubMed
    1. Phipps E, Prasanna D, Brima W, Jim B. Preeclampsia: updates in Pathogenesis, definitions, and guidelines. Clin J Am Soc Nephrol. 2016;11:1102–13. 10.2215/CJN.12081115 - DOI - PMC - PubMed
    1. Rana S, Lemoine E, Granger JP, Karumanchi SA, Preeclampsia. Circul Res. 2019;124:1094–112.10.1161/CIRCRESAHA.118.313276 - DOI - PubMed
    1. von Jagow G, Engel WD. Structure and function of the energy-converting system of mitochondria. Angew Chem Int Ed Engl. 1980;19:659–75. 10.1002/anie.198006593 - DOI - PubMed

MeSH terms

Substances

LinkOut - more resources