. 2024 Jul 22;12(1):136.
doi: 10.1186/s40168-024-01851-8.

Unraveling the habitat preferences, ecological drivers, potential hosts, and auxiliary metabolism of soil giant viruses across China

Affiliations

Unraveling the habitat preferences, ecological drivers, potential hosts, and auxiliary metabolism of soil giant viruses across China

Jie-Liang Liang et al. Microbiome. .

Abstract

Background: Soil giant viruses are increasingly believed to have profound effects on ecological functioning by infecting diverse eukaryotes. However, their biogeography and ecology remain poorly understood.

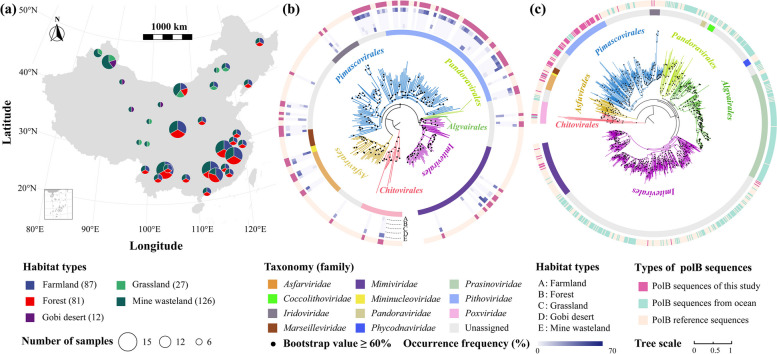
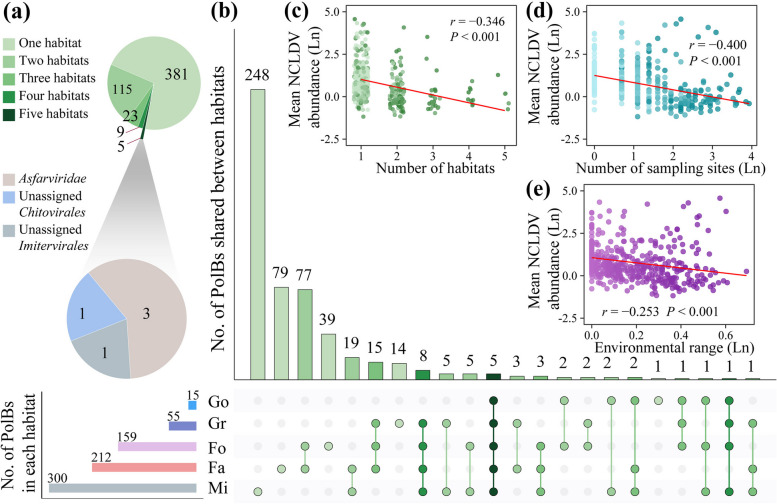
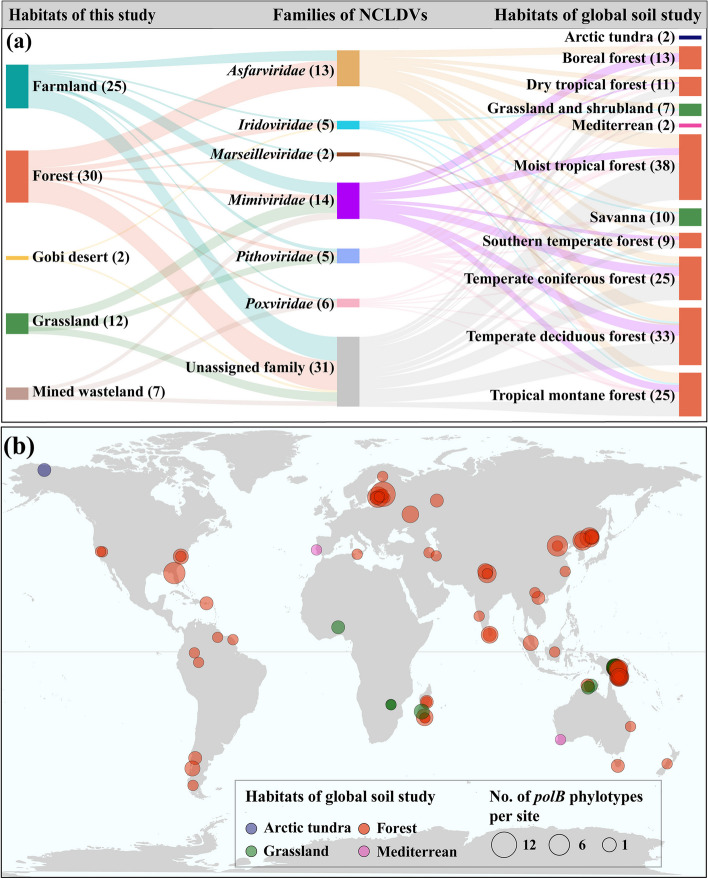
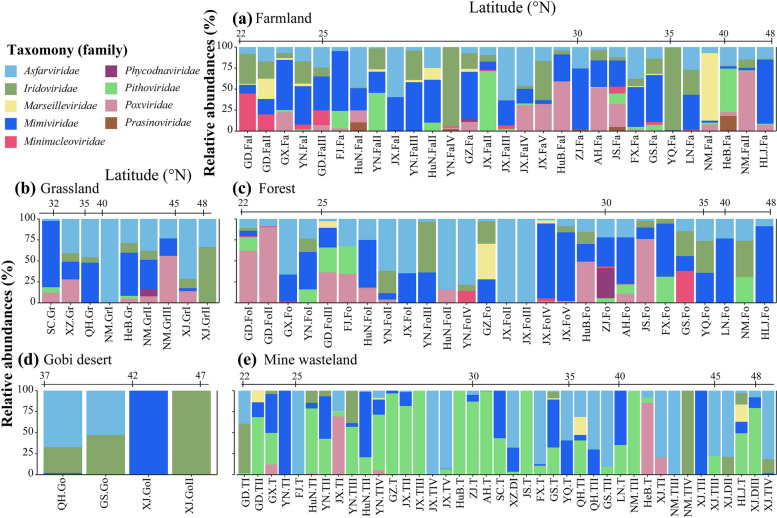
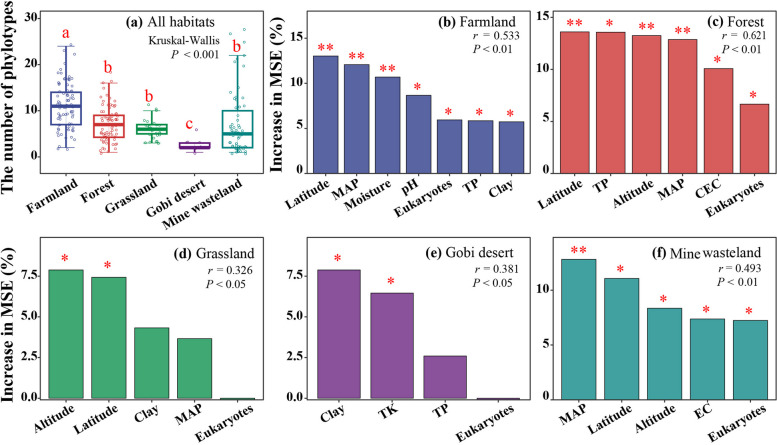
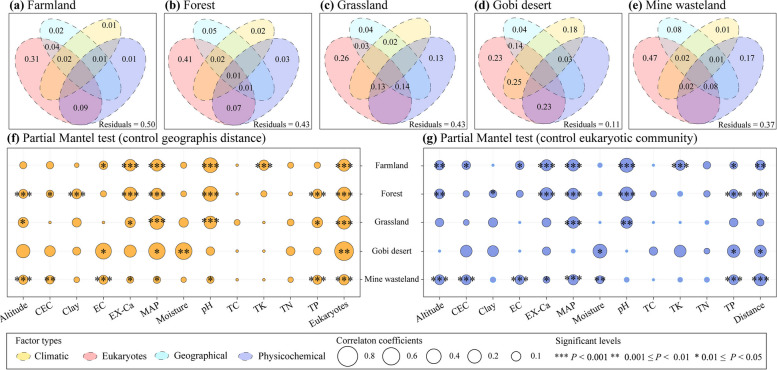
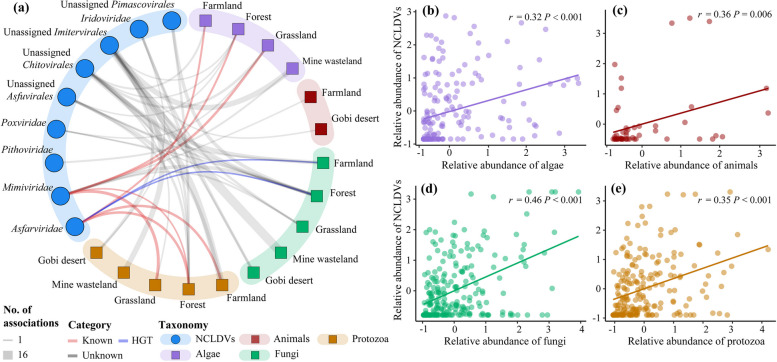
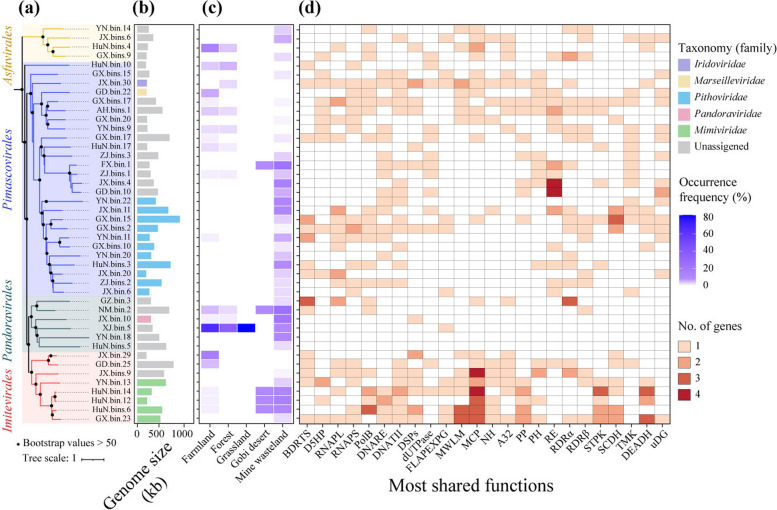
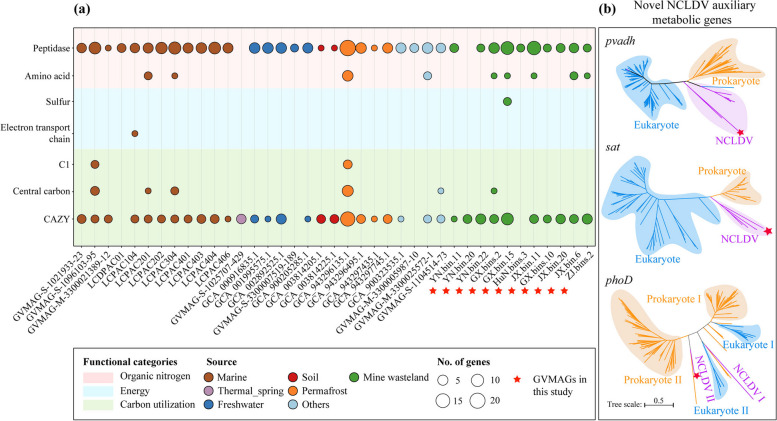
Results: In this study, we analyzed 333 soil metagenomes from 5 habitat types (farmland, forest, grassland, Gobi desert, and mine wasteland) across China and identified 533 distinct giant virus phylotypes affiliated with nine families, thereby greatly expanding the diversity of soil giant viruses. Among the nine families, Pithoviridae were the most diverse. The majority of phylotypes exhibited a heterogeneous distribution among habitat types, with a remarkably high proportion of unique phylotypes in mine wasteland. The abundances of phylotypes were negatively correlated with their environmental ranges. A total of 76 phylotypes recovered in this study were detectable in a published global topsoil metagenome dataset. Among climatic, geographical, edaphic, and biotic characteristics, soil eukaryotes were identified as the most important driver of beta-diversity of giant viral communities across habitat types. Moreover, co-occurrence network analysis revealed some pairings between giant viral phylotypes and eukaryotes (protozoa, fungi, and algae). Analysis of 44 medium- to high-quality giant virus genomes recovered from our metagenomes uncovered not only their highly shared functions but also their novel auxiliary metabolic genes related to carbon, sulfur, and phosphorus cycling.

Conclusions: These findings extend our knowledge of diversity, habitat preferences, ecological drivers, potential hosts, and auxiliary metabolism of soil giant viruses. Video Abstract.

Keywords: Abundance–distribution relationship; Ecological drivers; Eukaryotic community; Geographic distribution; Soil nucleocytoplasmic large DNA viruses; Terrestrial ecosystem.


Conflict of interest statement

The authors declare no competing interests.

Figures

Fig. 1
Fig. 1
Sampling sites, phylogenetic affiliations, and occurrence frequencies of soil nucleocytoplasmic large DNA viruses (NCLDVs). a Geographic illustration of soil sampling sites on the map of China. The numbers in parentheses represent sample sizes for individual habitat types. Detailed information on each sampling site is provided in Supplementary Table S1. b Phylogenetic affiliations of soil NCLDVs and their occurrence frequencies (%) in each habitat type. Phylogenetic tree was constructed with 88 long (≥ 700 amino acid) PolB sequences from 333 soil metagenomes in this study and 502 PolB reference sequences. Tree branches are colored according to the order-level taxonomic assignment. The inner layer denotes the six well-recognized (Asfarviridae, Iridoviridae, Marseilleviridae, Mimiviridae, Phycodnaviridae, and Poxviridae) and five newly proposed (Coccolithoviridae, Mininucleoviridae, Pandoraviridae, Pithoviridae and Prasinoviridae) NCLDV families [14]. The middle five layers denote occurrence frequencies of individual NCLDV phylotypes in the five different habitat types labeled with A–E, respectively. The most outside layer denotes PolB reference sequences (orange) and PolB sequences recovered from this study (pink). c Phylogenetic tree of soil and marine NCLDV PolBs. Phylogenetic tree was constructed from 88 long PolB sequences from this study, 406 PolB sequences from a marine dataset [17], and 502 PolB reference sequences [14]. Tree branches are colored according to the order-level taxonomic assignment. The inner layer denotes the six well-recognized and five newly proposed NCLDV families as those in b. The outside layer denotes references (orange), soil (pink) and marine (blue) PolB sequences
Fig. 2
Fig. 2
Ubiquity, uniqueness, and abundance–distribution relationships of soil NCLDVs. a, b Shared and unique NCLDV phylotypes of the five different habitat types. Fa, farmland; Fo, forest; Mi, mine wasteland; Gr, grassland; Go, Gobi desert. ce Correlations between the abundances of individual NCLDV phylotypes and the numbers of habitat types where they could be recovered (c), the numbers of sampling sites where they could be recovered (d), and their environmental range (e). Environmental range was calculated as the mean of the ranges of individual environmental factors standardized from zero to one according to the method of Barberan et al. [45]. Abundance, the numbers of sampling sites, and environmental range are normalized by logarithm
Fig. 3
Fig. 3
Global distribution patterns of the soil NCLDVs identified in this study. a Sankey flow diagram showing the habitat sources, quantities, and taxonomic affiliations of those NCLDVs that were not only identified in this study but also detectable in a published global topsoil metagenome dataset (‘global soil study’) [33]. Habitat types of this study and the global soil study are shown in different colors on the left and right, respectively. Taxonomic affiliations (families) of NCLDVs are shown in the middle. The heights of the individual bars are proportionate to the numbers of NCLDV phylotypes identified in different habitat types or belonging to various families, which are also presented in parentheses. The widths of the lines between habitat types and families represent the magnitudes of the shared NCLDV phylotypes. b Map showing the sampling sites of the global soil study and the numbers of NCLDV phylotypes detected in individual sampling sites. Circles represent the sampling sites and are colored based on habitat types. Circle sizes reflect the numbers of phylotypes detected in the corresponding sampling sites. Circles at the same coordinates are stacked according to their size, with the largest one at the bottom
Fig. 4
Fig. 4
Community compositions and the numbers of soil NCLDVs in individual sampling sites. Relative abundances of various NCLDV families are shown in the bar charts. Sampling sites are first grouped as per their habitat types [farmland (a), forest (b), grassland (c), Gobi desert (d), and mine wasteland (e)] and then those within the same habitat type are arranged according to their latitudes (from south to north)
Fig. 5
Fig. 5
Alpha-diversities of soil NCLDVs in different habitat types and their major predictors. a NCLDV phylotype richness. Horizontal lines represent the medians, whereas the boxes represent the interquartile ranges of the first and third quartiles. The vertical lines represent the maximal and minimal values. Different letters on the top of the bars indicate significant differences between individual medians assessed with Kruskal–Wallis tests. bf Major predictors of NCLDV phylotype richness in farmland (b), forest (c), grassland (d), Gobi desert and mine wasteland (f), respectively. The relative importance of selected predictors, quantified by an increase in the mean square error (MSE), was illustrated by random forest analysis. Significance levels of individual predictors are represented by * (P < 0.05) or ** (P < 0.01). LAT, latitude; ALT, altitude; MAP, mean annual precipitation; EC, electrical conductivity; EX-Ca, exchangeable calcium; CEC, cation exchange capacity; TC, total carbon; TN, total N; TP, total P; TK, total K; Eukaryotes, the number of eukaryotic amplicon sequence variants (ASVs)
Fig. 6
Fig. 6
Major driving factors of beta-diversities of soil NCLDVs in different habitat types. ae Variation partitioning analysis (VPA) differentiating effects of climatic, geographical, and physicochemical factors and eukaryotic community composition on NCLDV community composition in farmland (a), forest (b), grassland (c), Gobi desert (d) and mine wasteland (e). f, g Partial Mantel correlations (Spearman correlation coefficients) between NCLDV community composition and different ecological factors with controls for geographic distance (f) and eukaryotic community composition (g). Abbreviations are as those in Fig. 5
Fig. 7
Fig. 7
Associations of NCLDVs–eukaryotes in different habitat types. a Summary of the co-occurrence networks of NCLDVs–eukaryotes in five habitat types illustrated in Supplementary Fig. S9. Circles represent NCLDV phylotypes and squares represent eukaryotic ASVs present in certain habitat types. The numbers of associations between NCLDVs and eukaryotes in individual habitat types are drawn as edges. Those NCLDV phylotypes and eukaryotic ASVs that were present in ≥ 10% of all soil samples for each habitat type were included in our co-occurrence network analysis. Significant Spearman correlation coefficients (ρ ≥ 0.60, P < 0.05) for NCLDVs-eukaryotes pairs were used as a cutoff. Experiment-verified and in silico horizontal gene transfer-based predicted virus–host associations reported in previous studies [4, 17] are shown in red and blue respectively (for details, please see Supplementary Table S9), whereas unknown associations are shown in grey. be Pearson correlations of the relative abundances between soil NCLDVs and algae, animals, fungi, and protozoa. Relative abundances were normalized by z-score
Fig. 8
Fig. 8
Analysis of 44 giant virus metagenome-assembled genomes (GVMAGs) recovered from our study. a Maximum-likelihood phylogenetic tree of the GVMAGs inferred from a concatenated protein alignment of seven core giant virus orthologous groups [14]. b Genome size and family-level taxonomic information of the GVMAGs. c Occurrence frequencies of individual GVMAGs in five different habitat types. d Comparison of most shared functions among the GVMAGs. Functions were selected among the annotations found in at least 10 genomes. ADPR, ADP-ribosylglycohydrolase; AlkB, NCLDV alkylated DNA repair protein; ATPDL, ATP-dependent DNA ligase; CtdP, ctd-like phosphatase; D5HP, D5-like helicase-primase; dMNPK, dNMP kinase; RNAPL, DNA-directed RNA polymerase subunit alpha; RNAPS, DNA-directed RNA polymerase subunit beta; SFII, DNA or RNA helicases of superfamily II; PolB, family B DNA polymerase; DNARE, DNA repair exonuclease; DNATII, DNA topoisomerase II; EL, Esterase lipase superfamily; FADTS, FAD-dependent thymidylate synthase; GT, glycosyltransferase; mRNACE, mRNA capping enzyme large subunit; NH, Nudix hydrolase; PP, Patatin phospholipase; RGTPase, Ras-like GTPase; RE, restriction-fold endonuclease; RDRα, ribonucleoside diphosphate reductase-α; RDRβ, ribonucleoside diphosphate reductase-β; STTPK, Serine/Threonine or Tyrosine-protein kinase; STPK, Serine/Threonine protein kinase; SCDH, short chain dehydrogenase; TMK, Thymidine kinase; DEADH, DEAD/SNF2-like helicases; uDG, uracil-DNA glycosylase; XRNE, XRN 5′-3′ exonuclease
Fig. 9
Fig. 9
Functional analysis of Pithoviridae-like genomes. a Comparison of auxiliary metabolic functions between newly obtained and public reference Pithoviridae genomes [14, 19]. The 11 Pithoviridae-like genomes recovered in the study were marked with red stars (for details, please see Supplementary Tables S7 and S8). CAZY, carbohydrate-active enzymes. b Phylogenetic reconstruction of NCLDV genes likely involved in carbon, sulfur, and phosphorous metabolism. Asterisk denoted NCLDV sequences from the newly recovered Pithoviridae-like genomes. All the nodes were supported by > 75% bootstrap values, although they were not provided for better visual clarity. pvadf, polyvinyl alcohol dehydrogenase gene; sat, sulfate adenylyltransferase gene; phoD, alkaline phosphatase D gene

References

    1. Koonin EV, Yutin N. Evolution of the large nucleocytoplasmic DNA viruses of eukaryotes and convergent origins of viral gigantism. Adv Virus Res. 2019;103:167–202. 10.1016/bs.aivir.2018.09.002 - DOI - PubMed
    1. Aherfi S, Colson P, La Scola B, Raoult D. Giant viruses of amoebas: an update. Front Microbiol. 2016;7:349. 10.3389/fmicb.2016.00349 - DOI - PMC - PubMed
    1. Pagnier I, Reteno DG, Saadi H, Boughalmi M, Gaia M, Slimani M, et al. A decade of improvements in Mimiviridae and Marseilleviridae isolation from amoeba. Intervirology. 2013;56(6):354–63. 10.1159/000354556 - DOI - PubMed
    1. Schulz F, Abergel C, Woyke T. Giant virus biology and diversity in the era of genome-resolved metagenomics. Nat Rev Microbiol. 2022;20(12):721–36. 10.1038/s41579-022-00754-5 - DOI - PubMed
    1. Yoshikawa G, Blanc-Mathieu R, Song C, Kayama Y, Mochizuki T, Murata K, et al. Medusavirus, a novel large DNA virus discovered from hot spring water. J Virol. 2019;93(8):e02130-e2218. 10.1128/JVI.02130-18 - DOI - PMC - PubMed

LinkOut - more resources