Published Erratum
. 2024 Jul;27(7):e14468.
doi: 10.1111/ele.14468.

Correction to 'Life history mediates the trade-offs among different components of demographic resilience'

No authors listed
Published Erratum

Correction to 'Life history mediates the trade-offs among different components of demographic resilience'

No authors listed. Ecol Lett. 2024 Jul.
No abstract available


Figures

FIGURE 2
FIGURE 2
Evolutionary history explains a higher degree of variability of the demographic resilience in animals than in plants. Patterns of variation of demographic compensation, resistance and recovery time (Figure 1) for the examined 162 populations of 69 animal species and 748 populations of 232 plant species. Inward ring represents resistance, middle ring compensation and outer ring recovery time. Evolutionary history explains a greater amount of variability of demographic resilience in animals (a) than in plants (b). Values showed in each panel represent the mean values of compensation, resistance and recovery time per species. (a) In animals, the phylogenetic signal was stronger for compensation (0.63 ± 0.18, mean ± SE), than for resistance (0.48 ± 0.26) and recovery time (0.41 ± 0.21). Silhouettes represent, from the top in a clockwise direction, chimpanzee (Pan troglodytes), red grouper (Epinephelus morio), peregrine falcon (Falco peregrinus), common tern (Sterna hirundo), green sea turtle (Chelonia mydas), California sea lion (Zalophus californianus), polar bear (Ursus maritimus) and red deer (Cervus elaphus). (b) In plants, compensation (0.04 ± 0.05) and resistance (0.02 ± 0.04) show a weak phylogenetic signal, while recovery time had a stronger phylogenetic signal (0.66 ± 0.08). Silhouettes represent, from the top in a clockwise direction, woodland geranium (Geranium sylvaticum), wild plantain (Heliconia acuminata), white Cypress‐pine (Callitris columellaris), alpine sea holly (Eryngium alpinum), purple pitcher plant (Sarracenia purpurea), Douglas's catchfly (Silene douglasii) and grey alder (Alnus incana). Silhouettes' source: phylopic.org.
FIGURE 3
FIGURE 3
The components of demographic resilience correlate differently for plants than for animals. Correlations between the components of resilience, (a, d) resistance versus recovery time, (b, e) resistance versus compensation and (c, f) recovery time versus compensation for 162 populations of 69 animal species (a–c) and 748 populations of 232 plant species (d–f). Insets show the distribution of the residual correlations between the components of resilience, where ρ represents the mean value of the distribution. Positive values of ρ indicate a positive correlation between components, and negative values represent a trade‐off. The correlation between resistance and recovery time is (a) positive for animals but (d) negative for plants. Resistance and compensation are positively correlated in both (b) animals and (e) plants. Recovery time and compensation are (c) slightly positively correlated in animals and (f) slight negatively correlated in plants. The residual correlations were estimated by fitting a multivariate multilevel Bayesian model using compensation, resistance and recovery time as the response variable and with no predictors (see Methods).
FIGURE 4
FIGURE 4
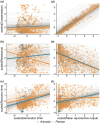
The three components of demographic resilience—resistance, compensation and recovery time—strongly correlate with two key species life history traits: generation time and mean reproductive output. (a–c) display the correlations of (a) compensation, (b) resistance and (c) recovery time, with generation time. (d–f) display the correlations of (d) compensation, (e) resistance and (f) recovery time, with mean reproductive output. Here we show the correlations between the scaled values of the demographic resilience components of resistance, compensation and recovery time with the scaled values of generation time and reproductive output of 162 populations of 69 animal species (blue) and 748 populations of 232 plant species (orange). Lines represent the predictions from the multilevel Bayesian models (Table S2), where thin lines correspond to the predictions drawn from each of the 250 posterior samples of the model, and the thick line represents the mean outcome of the model.
FIGURE S1
FIGURE S1
Compensation is more mathematically constrained than resistance and recovery time in relation to life history traits. Effect sizes of the models evaluating the relationship among the scaled values of resistance, compensation and recovery time with the scaled values of mean reproductive output, generation time and their interaction. The correlations were performed using 164 natural populations of 76 animal species (blue) and 621 natural populations of 190 plant species (orange) and the 5699 random MPMs with retrogression (Random, light grey), and 5700 random MPMs without retrogression (Random without retrogression, dark grey). The line thickness represents the 95%, 90% and 80% credible intervals of the effect sizes, while the dot represents the mean.
FIGURE S2
FIGURE S2
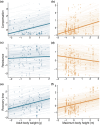
Correlation between the components of demographic resilience and body dimensions of animals (a, b and c) and plants (d, e and f). The correlations between the scaled values of the demographic resilience components of resistance, compensation and recovery time with the scaled values of adult body weight (g) of 149 natural populations of animals (blue) and 331 plants (orange). Lines represent the predictions from the multivariate multilevel Bayesian models (Table S2), where thin lines correspond to the predictions drawn from each of the 250 posterior samples of the model, and the thick line represents the mean outcome of the model.
FIGURE S3
FIGURE S3
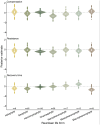
Demographic resilience components of plants classified according to Raunkiær life forms. We show here the posterior distributions of multivariate multilevel Bayesian models with scaled values of compensation, resistance and recovery time as response variables and the Raunkiær life form classification (Raunkiær 1934). n = indicates the number of populations for which this information was available.
FIGURE S4
FIGURE S4
Demographic resilience components of species against their conservation status in animals (a) and plants (b). We show here the posterior distributions of multivariate multilevel Bayesian models for animals (a) and plants (b), with scaled values of compensation, resistance and recovery time as response variables and the conservation status of the studied species as reported on the IUCN Red List (IUCN 2017) as fixed effects. LC = Least Concerned, NT = Near Threatened, VU = Vulnerable, EN = Endangered, CR = Critically Endangered. n = indicates the sample size.

Erratum for

Publication types

LinkOut - more resources