. 2024 Apr 25;27(7):109815.
doi: 10.1016/j.isci.2024.109815. eCollection 2024 Jul 19.

Unsupervised clustering identified clinically relevant metabolic syndrome endotypes in UK and Taiwan Biobanks

Affiliations

Unsupervised clustering identified clinically relevant metabolic syndrome endotypes in UK and Taiwan Biobanks

Aylwin Ming Wee Lim et al. iScience. .

Abstract

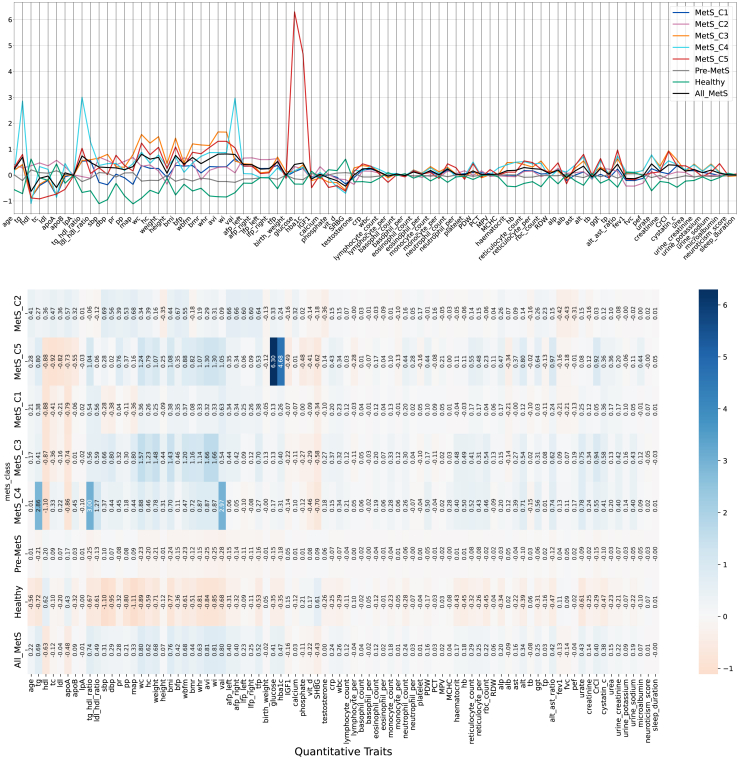
Metabolic syndrome (MetS) is a collection of cardiovascular risk factors; however, the high prevalence and heterogeneity impede effective clinical management. We conducted unsupervised clustering on individuals from UK Biobank to reveal endotypes. Five MetS subgroups were identified: Cluster 1 (C1): non-descriptive, Cluster 2 (C2): hypertensive, Cluster 3 (C3): obese, Cluster 4 (C4): lipodystrophy-like, and Cluster 5 (C5): hyperglycemic. For all of the endotypes, we identified the corresponding cardiometabolic traits and their associations with clinical outcomes. Genome-wide association studies (GWASs) were conducted to identify associated genotypic traits. We then determined endotype-specific genotypic traits and constructed polygenic risk score (PRS) models specific to each endotype. GWAS of each MetS clusters revealed different genotypic traits. C1 GWAS revealed novel findings of TRIM63, MYBPC3, MYLPF, and RAPSN. Intriguingly, C1, C3, and C4 were associated with genes highly expressed in brain tissues. MetS clusters with comparable phenotypic and genotypic traits were identified in Taiwan Biobank.

Keywords: Association analysis; Classification of bioinformatical subject; Human metabolism; Risk stratification; Syndrome.


Conflict of interest statement

All authors declare no competing interests.

Figures

None
Graphical abstract
Figure 1
Figure 1
Principal-component analysis (PCA) plot and violin plot of five MetS criteria in UK Biobank Principal-component analysis plot shows principal component 1 versus principal component 2. Principal-component analysis was constructed based on the five MetS criteria namely serum glucose, waist circumference, triglyceride, HDL cholesterol, and mean arterial pressure. Principal component 1 explained 40.2% of the variance, whereas principal component 2 explained 19.6% of the variance. Violin plots show the distribution of the five MetS criteria across healthy, pre-MetS, and MetS clusters.
Figure 2
Figure 2
Parallel plot and heatmap displaying standard scores (Z scores) for 87 quantitative traits across metabolic syndrome clusters, pre-metabolic syndrome, and healthy individuals in the UK Biobank Figure 2 provides a detailed parallel plot and heatmap analysis, showcasing the standard scores (Z scores) for 87 distinct quantitative traits across metabolic syndrome (MetS) clusters, pre-MetS, and healthy individuals within the UK Biobank dataset. This figure is designed to illuminate the complex and multifaceted nature of MetS, revealing the unique phenotypic patterns that distinguish each MetS cluster from one another and from pre-MetS and healthy baselines. Key observations include the pronounced obesity-related markers in Cluster 3 and the markedly elevated glucose levels and HbA1c in Cluster 5, illustrating the heterogeneity within MetS diagnoses. By incorporating a wide range of cardiometabolic parameters, Figure 2 underscores the variability within MetS clusters and highlights the critical need for a nuanced understanding of MetS subtypes in enhancing precision medicine approaches. tg, triglyceride; hdl, high-density lipoprotein; tc, total cholesterol; ldl, low-density lipoprotein; apoA, apolipoprotein A; apoB, apolipoprotein B; sbp, systolic blood pressure; dbp, diastolic blood pressure; pr, pulse rate; pp, pulse pressure; map, mean arterial pressure; wc, waist circumference; hc, hip circumference; bmi: body mass index; bfp: body fat percentage; wbfm: whole-body fat mass; bmr: basal metabolic rate; whr: waist-to-hip ratio; avi: abdominal visceral index; wi: waist index; vai: visceral adiposity index; afp_left: arm fat percentage (left); afp_right: arm fat percentage (right); lfp_left: leg fat percentage (left); lfp_right: leg fat percentage (right); tfp: trunk fat percentage; IGF1: insulin growth factor 1; vit_d: vitamin d; SHBG: sex hormone binding globulin; crp: c-reactive protein; wbc: white blood cell; PDW: platelet distribution width; PCT: plateletcrit; MPV: mean platelet volume; MCHC: mean corpuscular hemoglobin concentration; hb: hemoglobin; rbc_count: red blood cell count; RDW: red cell distribution width; alp: alkaline phosphatase; alb: albumin; ast: aspartate aminotransferase; alt: alanine transaminase; tb: total bilirubin; ggt: gamma-glutamyl transferase; tp: total protein; fvc: forced vital capacity; fev1: forced expiratory volume in 1s; pef: peak expiratory flow; CrCl: creatine clearance.
Figure 3
Figure 3
Odds ratios (and 95% confidence intervals) for health outcomes (composite CVD outcomes, atrial fibrillation, depression, and all cancers) in metabolic syndrome, its clusters, and pre-metabolic syndrome compared to healthy controls (left); percentage of cases in each category (right) Left panel: x axis represents the odds ratios for health outcomes, adjusted for age and sex (blue), and further adjusted for T2D status (orange). A red dotted line indicates an odds ratio of 1, signifying equal event odds in metabolic syndrome groups versus healthy controls. Right panel: x axis shows the percentage of each health outcome; y axis categorizes overall metabolic syndrome, its clusters, and pre-metabolic syndrome. Table S5 provides further details.
Figure 4
Figure 4
GWAS Manhattan plots and summary statistics (A–F) Manhattan plots for GWAS of overall metabolic syndrome and clusters 1–5 in the UK Biobank; summary of GWAS and FUMA SNP2GENE with cluster-specific independent significant SNPs and prioritized genes for MetS.
Figure 5
Figure 5
Comparative analysis of metabolic syndrome clusters using Jaccard similarity index: independent SNPs and associated genes in the UK Biobank
Figure 6
Figure 6
Predictive accuracy (R2) of PRS models for overall metabolic syndrome and clusters 1–5 in the UK Biobank (A) PRS models constructed using the full sample size of cases. (B) PRS models developed with random sampling of 3,800 cases.
Figure 7
Figure 7
Radar plot of Z scores for MetS-related features (BMI, HbA1C, CrCl, WBC, ALT/AST ratio, TG/HDL ratio, LDL, and SBP) in metabolic syndrome clusters of the UK Biobank and Taiwan Biobank

Similar articles

References

    1. Hunter D.J. Gene-environment interactions in human diseases. Nat. Rev. Genet. 2005;6:287–298. doi: 10.1038/nrg1578. - DOI - PubMed
    1. Duarte C.W., Vaughan L.K., Beasley T.M., Tiwari H.K. In: Emery and Rimoin's Principles and Practice of Medical Genetics. Sixth Edition. Rimoin D., Pyeritz R., Korf B., editors. Academic Press; 2013. Chapter 12 - Multifactorial Inheritance and Complex Diseases; pp. 1–15. - DOI
    1. Visscher P.M., Wray N.R., Zhang Q., Sklar P., McCarthy M.I., Brown M.A., Yang J. 10 Years of GWAS Discovery: Biology, Function, and Translation. Am. J. Hum. Genet. 2017;101:5–22. doi: 10.1016/j.ajhg.2017.06.005. - DOI - PMC - PubMed
    1. Chen J., Spracklen C.N., Marenne G., Varshney A., Corbin L.J., Luan J., Willems S.M., Wu Y., Zhang X., Horikoshi M., et al. The trans-ancestral genomic architecture of glycemic traits. Nat. Genet. 2021;53:840–860. doi: 10.1038/s41588-021-00852-9. - DOI - PMC - PubMed
    1. Malik R., Chauhan G., Traylor M., Sargurupremraj M., Okada Y., Mishra A., Rutten-Jacobs L., Giese A.K., van der Laan S.W., Gretarsdottir S., et al. Multiancestry genome-wide association study of 520,000 subjects identifies 32 loci associated with stroke and stroke subtypes. Nat. Genet. 2018;50:524–537. doi: 10.1038/s41588-018-0058-3. - DOI - PMC - PubMed

LinkOut - more resources