. 2024 Jun 15;27(7):110284.
doi: 10.1016/j.isci.2024.110284. eCollection 2024 Jul 19.

Investigation of a fluorescent reporter microenvironment niche labeling strategy in experimental brain metastasis

Affiliations

Investigation of a fluorescent reporter microenvironment niche labeling strategy in experimental brain metastasis

Matteo Massara et al. iScience. .

Abstract

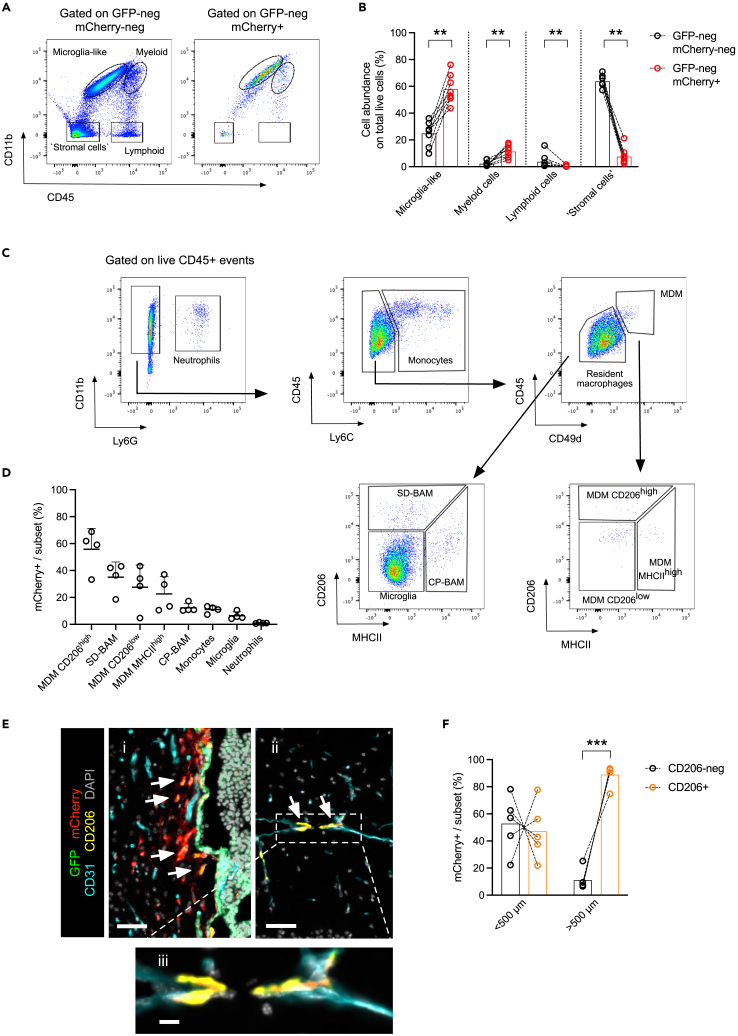
Brain metastases are the most common brain tumors in patients and are associated with poor prognosis. Investigating the colonization and outgrowth of brain metastases is challenging given the complexity of the organ, tissue sampling difficulty, and limited experimental models. To address this challenge, we employed a strategy to analyze the metastatic niche in established lesions, based on the release of a cell-penetrating mCherry tag from labeled tumor cells to neighboring niche cells, using different brain metastasis mouse models. We found that CD206+ macrophages were the most abundant cells taking up the mCherry label in established metastases. In vitro and in vivo experiments demonstrated that macrophages uptake and retain the canonical form of mCherry, even without the cell-penetrating portion of the tag. These results identify a specific macrophage subset in the brain that retains tumor-supplied fluorescent molecules, thereby complicating the long-term use of niche labeling strategies in established experimental brain metastasis.

Keywords: Cancer; Cell biology; Microenvironment.


Conflict of interest statement

M.M. is currently affiliated to the Institute of Oncology Research (IOR), Bellinzona 6500, Switzerland, and V.W. to TRON-Mainz, Germany. J.A.J. has received an honorarium for speaking at a research symposium organized by Bristol Meyers Squibb and previously served on the scientific advisory board of Pionyr Immunotherapeutics (last 3 years disclosures).

Figures

None
Graphical abstract
Figure 1
Figure 1
The mCherry niche labeling system in brain metastasis reveals mCherry+ cells outside the metastatic niche in established breast-BrM (A) Experimental schematic for investigation of the metastatic niche in breast-to-brain metastasis (BrM). Briefly, immunocompetent mice were injected intracardially with GFP/sLP-mCherry-transduced PyMT-BrM3 breast cancer cells and monitored by weekly MRI to assess BrM outgrowth. At the experimental endpoint, the brain hemispheres where the BrM was detected by MRI were collected by performing a sagittal cut and processed for flow cytometry (FCM) and immunofluorescence (IF) staining analyses. (B) Representative FCM plot of the GFP/sLP-mCherry-labeled PyMT-BrM3 cell line cultured in vitro. (C) Representative FCM plots of single-cell suspensions from the labeled PyMT-BrM3 breast-to-brain metastatic hemisphere (left) and the naive uninjected brain tissue (right) used as negative reference for mCherry expression in the FCM analysis. (D) Representative IF image of whole-brain tissue section staining. Scale bar 1 mm in top panel. i) Higher magnification of the peri-metastatic area, showing the GFP+ mCherry+ cancer cells on the right side of the image. Scale bar 50 μm. ii) Higher magnification of a parenchymal area considerably further than 500 μm from the tumoral lesion, showing GFP-neg mCherry+ cells. Scale bar 50 μm. iii) Higher magnification of the parenchymal area (ii) shown above. Scale bar 10 μm. (E) Quantification of mCherry+ DAPI+ cells as a proportion of total DAPI+ cells stratified by the distance between the positive cells and the tumor lesion (<500 μm or >500 μm) using QuPath. Dashed lines indicate paired samples. Metastatic hemispheres from n = 5 mice. (F) Percentage of the number of mCherry+ DAPI+ cells detected at a distance from the tumor lesion (>500 μm) compared to the total mCherry+ DAPI+ cell count as detected in the whole-brain tissue slices. Metastatic hemispheres from n = 5 mice. Statistical analysis in (E) was performed using paired t test. Data are represented as mean ± SD. ∗, p < 0.05.
Figure 2
Figure 2
CD206+ macrophages are the most abundant cell population within the sLP-mCherry+ fraction and are located outside of the metastatic niche in the breast-BrM model (A) Representative flow cytometry plots of the GFP-neg mCherry-neg and GFP-neg mCherry+ cell fractions in the breast-BrM model, showing the gating strategy used. Microglia-like cells were defined as CD45low CD11bhigh, myeloid cells as CD45high CD11bhigh, lymphoid cells as CD45high CD11b-neg, and “stromal cells” as CD45-neg CD11b-neg. (B) Relative quantification of cell populations in the GFP-neg mCherry-neg and in the GFP-neg mCherry+ fractions in the breast-BrM metastasis model. Dashed lines indicate paired samples. Metastatic hemispheres from n = 8 mice. (C) Representative FCM gating strategy to identify neutrophils and the different macrophage subpopulations. Neutrophils were identified as CD11b+ Ly6G + events, monocytes as Ly6C+ CD11b+ Ly6G-neg events, and monocyte-derived macrophages (MDMs) as CD45+ CD49d+. Among CD49d-neg events, subdural border-associated macrophages (SD-BAMs) were identified as CD206+ cells, choroid plexus border-associated macrophages (CP-BAMs) as MHCII+, and microglia were identified as CD206-neg MHCII-neg events. Among the CD49d+ events, three subsets of MDMs were detected based on CD206 and MHCII expression. (D) Quantification of relative mCherry uptake by the different cell populations in the metastatic hemisphere in the breast-to-brain metastasis model as a percentage of the total number of cells in each indicated subset. Metastatic hemispheres from n = 4 mice. (E) Representative IF images of brain tissue in the breast-BrM model. i) The peri-metastatic area. Scale bar 50 μm. ii) A parenchymal area of brain tissue, considerably further than 500 μm from the tumoral lesion. Scale bar 50 μm. iii) Detail of the parenchymal area shown above in (ii). Scale bar 10 μm. White arrows in (i) and (ii) indicate mCherry+ CD206+ cells. (F) Relative quantification by IF image analysis of mCherry+ DAPI+ cells in the CD206+ and CD206-neg fractions, stratified based on the distance between the detected cells and the tumoral lesion. Dashed lines indicate paired samples. Metastatic hemispheres from n = 5 mice. Statistical analysis in (B) was performed using paired t test with Wilcoxon correction. Statistical analysis in (F) was performed using paired t test. Data are represented as mean ± SD. ∗∗, p < 0.01; ∗∗∗, p < 0.001.
Figure 3
Figure 3
mCherry is retained by macrophages in cell co-cultures and is associated with CD206 expression (A) Schematic of the experimental design and the cell lines used for co-culture analyses involving J774A.1 as macrophage cell line. (B and C) Relative quantification of (B) GFP-neg mCherry+ and (C) GFP+ mCherry+ expression associated with J774A.1 macrophages, detected as CD45+ cells by FCM. (D) Representative cytospin IF images from the co-culture experiment. Top panel: J774A.1 macrophages (CD68+) co-cultured with PyMT-BrM3-GFP/sLP-mCherry cell line, bottom panel J774A.1 co-cultured with PyMT-BrM3-GFP/mCherry cell line. Scale bar 7 μm. (E) Relative quantification of mCherry+ expression associated with J774A.1 macrophages detected as CD68+ cells by IF staining. (F) CD206 levels as quantified by mean fluorescence intensity (MFI) in J774A.1 CD45+ macrophages, either GFP-neg mCherry-neg or GFP-neg mCherry+. Dashed lines indicate paired samples. (G) Representative images of the imaging flow cytometry experiment. Top panel: J774A.1 macrophages co-cultured with PyMT-BrM3-GFP/sLP-mCherry cell line, middle panel J774A.1 co-cultured with PyMT-BrM3-GFP/mCherry cell line, bottom panel J774A.1 co-cultured with B78 mCherry/OVA cell line. Scale bar 7 μm. (H) Quantification of CD206-mCherry co-localization in macrophages by imaging flow cytometry. n = 435 cells counted for PyMT-BrM3-GFP/sLP-mCherry co-cultures, n = 192 for PyMT-BrM3-GFP/mCherry co-cultures, n = 350 for B78 mCherry/OVA co-cultures. (I) Schematic of the experimental design and the cell lines used for co-culture analyses with BMDMs as the macrophage source. (J and K) Relative quantification of (J) GFP-neg mCherry+ and (K) GFP+ mCherry+ expression associated with BMDMs, detected as CD45+ CD11b+ F4/80+ cells by FCM. (L) Representative cytospin IF images from the co-culture experiment. Top panel: BMDMs (CD68+) co-cultured with PyMT-BrM3-GFP/sLP-mCherry cell line, middle panel BMDMs co-cultured with PyMT-BrM3-GFP/mCherry cell line, bottom panel BMDMs co-cultured with PyMT-BrM3 cell line. Scale bar 7 μm. (M) Relative quantification of mCherry+ expression associated with BMDMs detected as CD68+ cells by IF. (N) CD206 MFI of CD45+ CD11b+ F4/80+ BMDMs co-cultured with PyMT-BrM3 GFP/mCherry cells, either GFP-neg mCherry-neg or GFP-neg mCherry+. Dashed lines indicate paired samples. In (B, C, and F), n = 3, experiment repeated 3 independent times, one representative experiment is shown. (E), n = 5 for PyMT-BrM3 GFP/sLP-mCherry and n = 4 for PyMT-BrM3 GFP/mCherry, sum of two independent experiments. (H), single experiment. In (J, K, and N), n = 3, experiment repeated 2 independent times, one representative experiment is shown. (M), n = 4 for PyMT-BrM3 GFP/sLP-mCherry and PyMT-BrM3 GFP/mCherry. n = 2 for PyMT-BRM3, single experiment. Statistical analysis in (F and N) was performed using two-way ANOVA. Statistical analysis in (H) was performed using one-way ANOVA. Data are represented as mean ± SD. ∗∗, p < 0.01; ∗∗∗, p < 0.001; ∗∗∗∗, p < 0.0001.
Figure 4
Figure 4
mCherry uptake by host cells in breast-BrM in vivo, in the absence of the cell-penetrating sequence (A) Schematic for the experimental investigation of the metastatic niche in breast-BrM. Briefly, immunocompetent mice were injected intracardially with GFP/mCherry-transduced PyMT-BrM3 cells (without the sLP portion) and monitored by weekly MRI to assess BrM outgrowth. At the experimental endpoint, the brain hemispheres where the BrM was detected by MRI were collected by performing a sagittal cut and processed for IF analysis. (B) Top panel: representative IF image of whole brain tissue section staining. Scale bar 1 mm. i) Higher magnification of the peri-metastatic area, with the GFP+ cancer cells on the top left of the image. Scale bar 50 μm. ii) Higher magnification of a parenchymal area considerably further than 500 μm from the tumoral lesion, showing GFP-neg mCherry+ cells. Scale bar 50 μm. White arrows indicate mCherry+ CD206+ cells, with CD206 and CD31 staining together shown in the lower panels. (C) Quantification of mCherry+ DAPI+ cells as a proportion of total DAPI+ cells stratified by the distance between the cells and the tumor lesion as calculated by QuPath. Dashed lines indicate paired samples. Metastatic hemispheres from n = 5 mice. (D) Relative quantification by IF image analysis of mCherry+ DAPI+ cells in the CD206-neg and CD206+ fractions, stratified based on the distance between the detected cells and the tumoral lesion. Dashed lines indicate paired samples. Metastatic hemispheres from n = 5 mice. (E) Relative quantification of mCherry+ DAPI+ cells as a proportion of total DAPI+ cells by IF image analysis. Metastatic hemispheres from n = 5 mice for both GFP/sLP-mCherry and GFP/mCherry constructs. Statistical analysis in (C and D) was performed using paired t test. Data are represented as mean ± SD. ∗, p < 0.05; ∗∗, p < 0.01.

References

    1. Achrol A.S., Rennert R.C., Anders C., Soffietti R., Ahluwalia M.S., Nayak L., Peters S., Arvold N.D., Harsh G.R., Steeg P.S., Chang S.D. Brain metastases. Nat. Rev. Dis. Primers. 2019;5:5. doi: 10.1038/s41572-018-0055-y. - DOI - PubMed
    1. Boire A., Brastianos P.K., Garzia L., Valiente M. Brain metastasis. Nat. Rev. Cancer. 2020;20:4–11. doi: 10.1038/s41568-019-0220-y. - DOI - PubMed
    1. Quail D.F., Joyce J.A. The Microenvironmental Landscape of Brain Tumors. Cancer Cell. 2017;31:326–341. doi: 10.1016/j.ccell.2017.02.009. - DOI - PMC - PubMed
    1. de Visser K.E., Joyce J.A. The evolving tumor microenvironment: From cancer initiation to metastatic outgrowth. Cancer Cell. 2023;41:374–403. doi: 10.1016/j.ccell.2023.02.016. - DOI - PubMed
    1. Dominiak A., Chelstowska B., Olejarz W., Nowicka G. Communication in the Cancer Microenvironment as a Target for Therapeutic Interventions. Cancers. 2020;12:1232. doi: 10.3390/cancers12051232. - DOI - PMC - PubMed

LinkOut - more resources