Meta-Analysis
. 2024 Jul 8:15:1416751.
doi: 10.3389/fimmu.2024.1416751. eCollection 2024.

A comprehensive meta-analysis of tissue resident memory T cells and their roles in shaping immune microenvironment and patient prognosis in non-small cell lung cancer

Affiliations
Meta-Analysis

A comprehensive meta-analysis of tissue resident memory T cells and their roles in shaping immune microenvironment and patient prognosis in non-small cell lung cancer

Aidan Shen et al. Front Immunol. .

Abstract

Tissue-resident memory T cells (TRM) are a specialized subset of long-lived memory T cells that reside in peripheral tissues. However, the impact of TRM-related immunosurveillance on the tumor-immune microenvironment (TIME) and tumor progression across various non-small-cell lung cancer (NSCLC) patient populations is yet to be elucidated. Our comprehensive analysis of multiple independent single-cell and bulk RNA-seq datasets of patient NSCLC samples generated reliable, unique TRM signatures, through which we inferred the abundance of TRM in NSCLC. We discovered that TRM abundance is consistently positively correlated with CD4+ T helper 1 cells, M1 macrophages, and resting dendritic cells in the TIME. In addition, TRM signatures are strongly associated with immune checkpoint and stimulatory genes and the prognosis of NSCLC patients. A TRM-based machine learning model to predict patient survival was validated and an 18-gene risk score was further developed to effectively stratify patients into low-risk and high-risk categories, wherein patients with high-risk scores had significantly lower overall survival than patients with low-risk. The prognostic value of the risk score was independently validated by the Cancer Genome Atlas Program (TCGA) dataset and multiple independent NSCLC patient datasets. Notably, low-risk NSCLC patients with higher TRM infiltration exhibited enhanced T-cell immunity, nature killer cell activation, and other TIME immune responses related pathways, indicating a more active immune profile benefitting from immunotherapy. However, the TRM signature revealed low TRM abundance and a lack of prognostic association among lung squamous cell carcinoma patients in contrast to adenocarcinoma, indicating that the two NSCLC subtypes are driven by distinct TIMEs. Altogether, this study provides valuable insights into the complex interactions between TRM and TIME and their impact on NSCLC patient prognosis. The development of a simplified 18-gene risk score provides a practical prognostic marker for risk stratification.

Keywords: machine learning; non-small-cell lung cancer; prognosis; tissue resident memory T cell; tumor immune microenvironment.


Conflict of interest statement

Author C-CC was employed by the company Biomap, Inc. The remaining authors declare that the research was conducted in the absence of any commercial or financial relationships that could be construed as a potential conflict of interest.

Figures
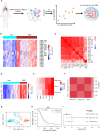
Figure 1
Figure 1
TRM cell abundance is positively associated with NSCLC prognosis. The PC1 score can represent TRM signatures, and it can represent the TRM cell proportion in the NSCLC. (A) Utilizing multiple independent single-cell RNA-seq data from human NSCLC samples, we crafted 20 distinct NSCLC TRM signatures reflective of TRM infiltration. (B) The infiltration distribution of the 20 TRM signatures in patients. (C) Heatmap of 20 TRM signatures we found and the correlation of them. (D) The infiltration distribution of the TRM8, TRM9, and TRM12 signatures in patients. (E) The correlation of TRM8, TRM9, and TRM12 signatures with mainly immune cells (natural killer (NK) cells, CD8+ T cells, monocytes, memory B cells, naïve B cells, and CD4+ T cells) in patients. (F) The correlation of the selected TRM signatures with each other. (G) Principal Component Analysis (PCA) on the expression of the selected TRM signatures in NSCLC patients. (H) Kaplan-Meier plot showing the association between overall survival and the first principle component (PC1) in NSCLC. (I) Forest plot depicting hazard ratios of univariate Cox regression models evaluating the association between overall survival and several clinical variables. Figure 1A created with BioRender.com.
Figure 2
Figure 2
TRM cell abundance is associated with the expression of immune checkpoint and stimulatory genes and immune regulatory pathways. (A) Immune score; (B) Stromal score; (C) Estimate score; (D) Tumor purity. (E) The Spearman correlation coefficient (SCC) between PC1 and immune cells. (F) SCC between PC1 and immune checkpoint and stimulatory genes expressed in NSCLC. (G) SCC between PC1 and Th1, Th2, and macrophages M1 cells. (H) SCC between PC1 and mast cells resting. (I) SCC between PC1 and leukocyte and lymphocyte infiltration. (J) SCC between PC1 and immune infiltration score. (K) SCC between PC1 and TCR Shannon and richness. (L) SCC between PC1 and macrophage regulation and dendritic cell (DC) resting. LUAD, lung adenocarcinoma.
Figure 3
Figure 3
Stratified survival analysis of the 18-gene risk score model and Kaplan-Meier survival analysis for the patients in independent datasets by the 18-gene risk score model. (A) Development of a TRM risk score for NSCLC patients by Lasso Cox regression analysis. (B) The forest plot of the 18 genes in the risk model. (C) Patients in the TCGA-LUAD and GSE67639 cohorts. (D) Time-dependence of NSCLC in 1, 5, and 10 years, respectively.
Figure 4
Figure 4
Stratified survival analysis of the 18-gene risk score model in clinicopathological factors. (A) The risk model in male patients. (B) The risk model in female patients. (C) The risk model in the elderly (age > 50). (D) The risk model in the young (age ≤ 50). (E) The risk model in low tumor stage patients. (F) The risk model in high tumor stage patients. For the TNM cancer staging system, TNM stands for Tumor, Nodes, and Metastasis. T is assigned based on the extent of involvement at the primary tumor site, N for the extent of involvement in regional lymph nodes, and M for distant spread. (G) The risk model in low T stage patients. (H) The risk model in high T stage patients. (I) The risk model in low N stage patients. (J) The risk model in high N stage patients. (K) The risk model in low M stage patients. (L) The risk model in high M stage patients. (M) Multivariate independent prognosis analysis in NSCLC cohort.
Figure 5
Figure 5
Risk model is most associated with immune cells in NSCLC. (A) Immune cell infiltration in low-risk vs high-risk patients. (B) The Spearman correlation coefficient (SCC) between risk score and Th2 cells; (C) SCC between risk score and Th17 cells; (D) SCC between risk score and macrophages M2 cells; (E) SCC between risk score and the transforming growth factor beta (TGFβ) response; (F) SCC between risk score and wound Healing; (G) SCC between risk score and mast cells activated; (H) SCC between risk score and tumor proliferation; (I) SCC between risk score and overall survival (OS) time; (J) SCC between risk score and Progression-Free Interval (PFI) time.
Figure 6
Figure 6
Gene Set Enrichment Analysis (GSEA). (A) Low-risk patients with significant up-regulated T cell, NK cell, and Lymphocyte -related pathways in the NSCLC. (B) T cell chemotaxis pathways are significantly up-regulated in low- vs high- risk patients. (C) Lymphocyte chemotaxis pathways are also significantly up-regulated in low- vs high- risk patients.
Figure 7
Figure 7
The TRM abundance difference between the LUAD and LUSC. (A) The T cell, NK cell, and immune response related pathways are significantly up-regulated in low- vs high- risk of LUSC and LUAD patients. (B) High PC1 vs low PC1 LUSC patient survival. (C) High risk vs low risk in LUSC patient survival. (D) High risk vs low risk in LUAD smoker patients and non-smoker patients. (E) High risk vs low risk in LUSC smoker patients and LUSC non-smoker patients. (F) TRM marker genes expression difference between the LUAD and LUSC patients. (G) Immune score, Stromal score, and Estimate score, respectively.

References

    1. Mirhadi S, Tam S, Li Q, Moghal N, Pham N-A, Tong J, et al. . Integrative analysis of non-small cell lung cancer patient-derived xenografts identifies distinct proteotypes associated with patient outcomes. Nat Commun. (2022) 13:1811. doi: 10.1038/s41467-022-29444-9 - DOI - PMC - PubMed
    1. Corgnac S, Boutet M, Kfoury M, Naltet C, Mami-Chouaib F. The emerging role of CD8+ Tissue resident memory T (TRM) cells in antitumor immunity: A unique functional contribution of the CD103 integrin. Front Immunol. (2018) 9:1904. doi: 10.3389/fimmu.2018.01904 - DOI - PMC - PubMed
    1. Yang L, He Y-T, Dong S, Wei X-W, Chen Z-H, Zhang B, et al. . Single-cell transcriptome analysis revealed a suppressive tumor immune microenvironment in EGFR mutant lung adenocarcinoma. J Immunother Cancer. (2022) 10:e003534. doi: 10.1136/jitc-2021-003534 - DOI - PMC - PubMed
    1. Oja AE, Piet B, van der Zwan D, Blaauwgeers H, Mensink M, de Kivit S, et al. . Functional heterogeneity of CD4+ Tumor-infiltrating lymphocytes with a resident memory phenotype in NSCLC. Front Immunol. (2018) 9:2654. doi: 10.3389/fimmu.2018.02654 - DOI - PMC - PubMed
    1. Marceaux C, Weeden CE, Gordon CL, Asselin-Labat M-L. Holding our breath: the promise of tissue-resident memory T cells in lung cancer. Transl Lung Cancer Res. (2021) 10:2819–29. doi: 10.21037/tlcr-20-819 - DOI - PMC - PubMed

Publication types

MeSH terms