. 2024 Jul 8:15:1403272.
doi: 10.3389/fimmu.2024.1403272. eCollection 2024.

Dual roles of CD11b+CD33+HLA-DR-/lowCD14- myeloid-derived suppressor cells with a granulocytic morphology following allogeneic hematopoietic stem cell transplantation: from inflammation promoters to immune suppressors within 90 days

Affiliations

Dual roles of CD11b+CD33+HLA-DR-/lowCD14- myeloid-derived suppressor cells with a granulocytic morphology following allogeneic hematopoietic stem cell transplantation: from inflammation promoters to immune suppressors within 90 days

Ming Ni et al. Front Immunol. .

Abstract

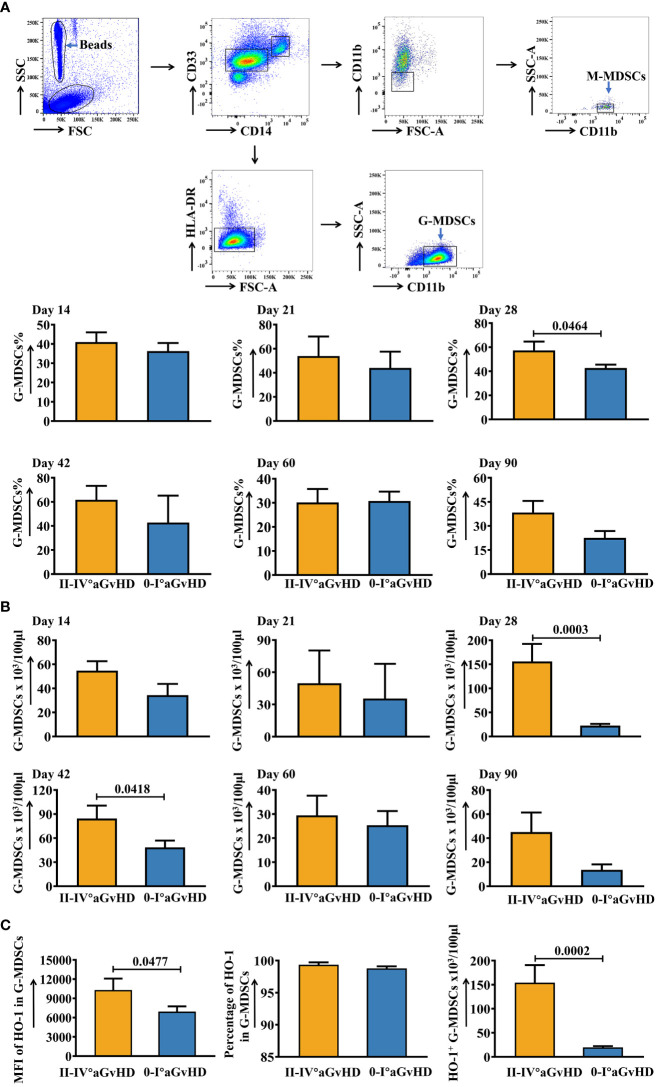
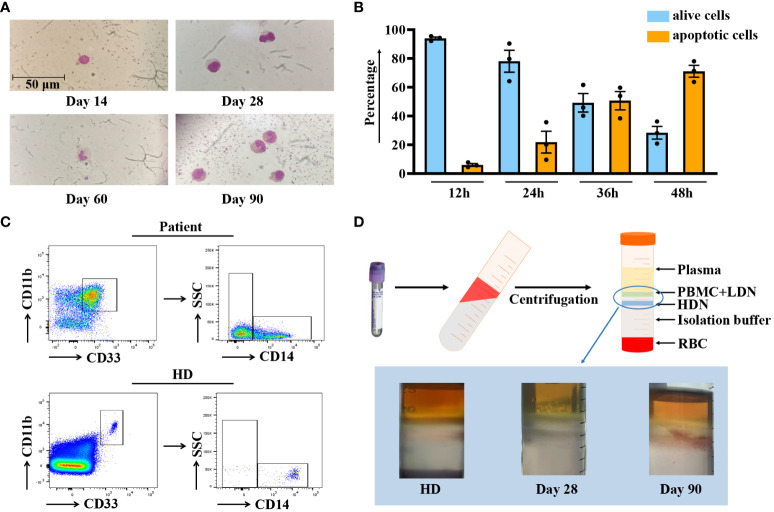
Introduction: Granulocytic myeloid-derived suppressor cells (G-MDSCs) show fast recovery following allogeneic hematopoietic stem cell transplantation (allo-HSCT) constituting the major part of peripheral blood in the early phase. Although G-MDSCs mediate immune suppression through multiple mechanisms, they may also promote inflammation under specific conditions.

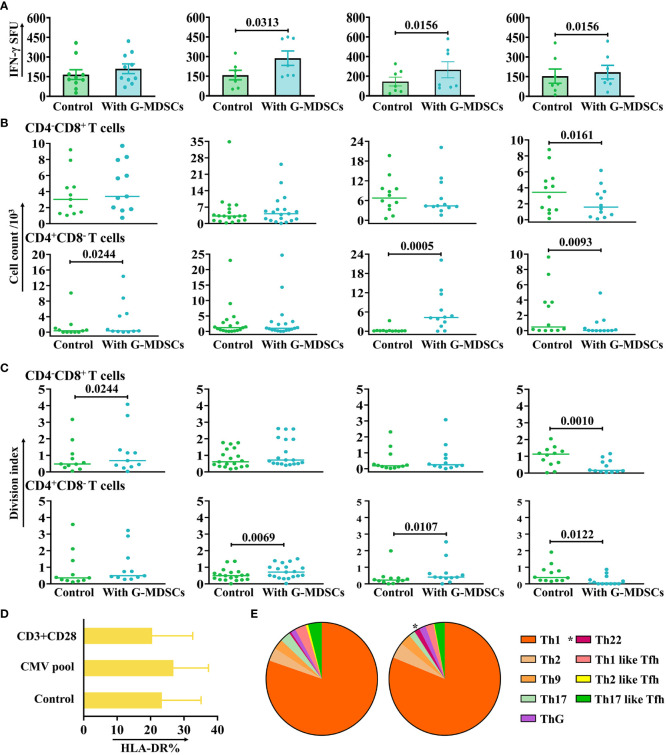
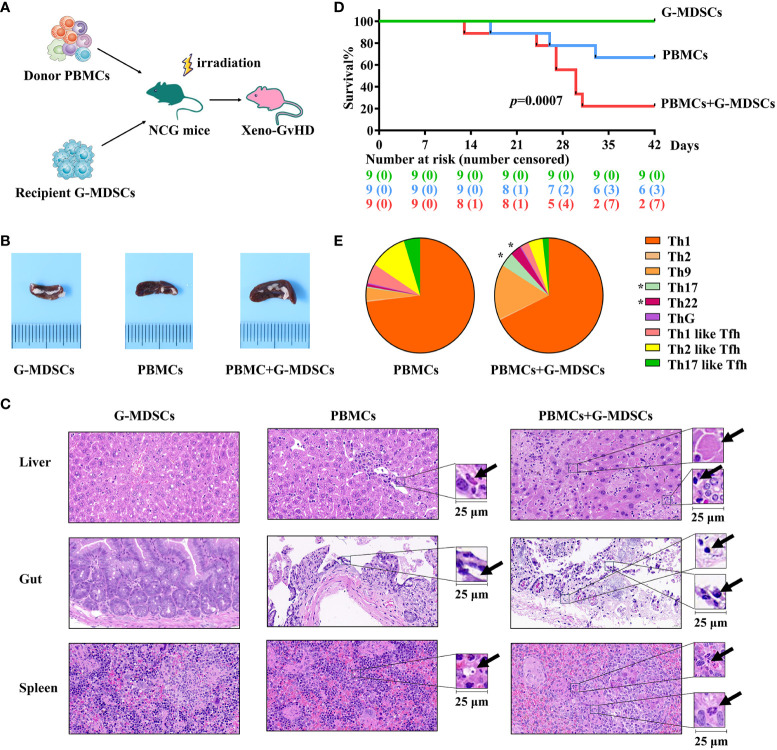
Methods: G-MDSCs were isolated from 82 patients following allo-HSCT within 90 days after allo-HSCT, and their interactions with autologous CD3+ T-cells were examined. T-cell proliferation was assessed by flow cytometry following CFSE staining, while differentiation and interferon-γ secretion were characterized using chemokine receptor profiling and ELISpot assays, respectively. NK cell cytotoxicity was evaluated through co-culture with K562 cells. An aGVHD xenogeneic model in humanized mice was employed to study the in vivo effects of human leukocytes. Furthermore, transcriptional alterations in G-MDSCs were analyzed via RNA sequencing to investigate functional transitions.

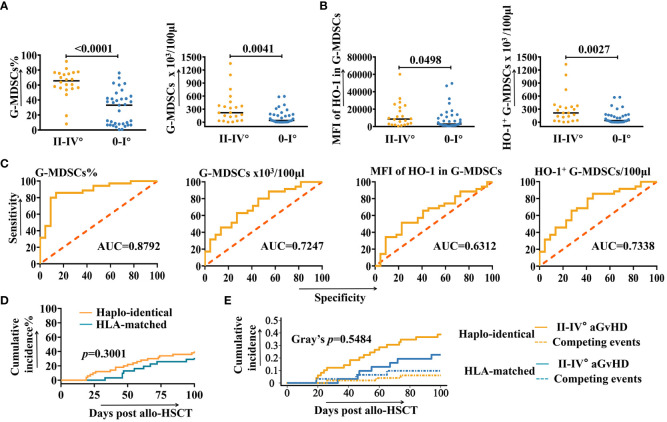
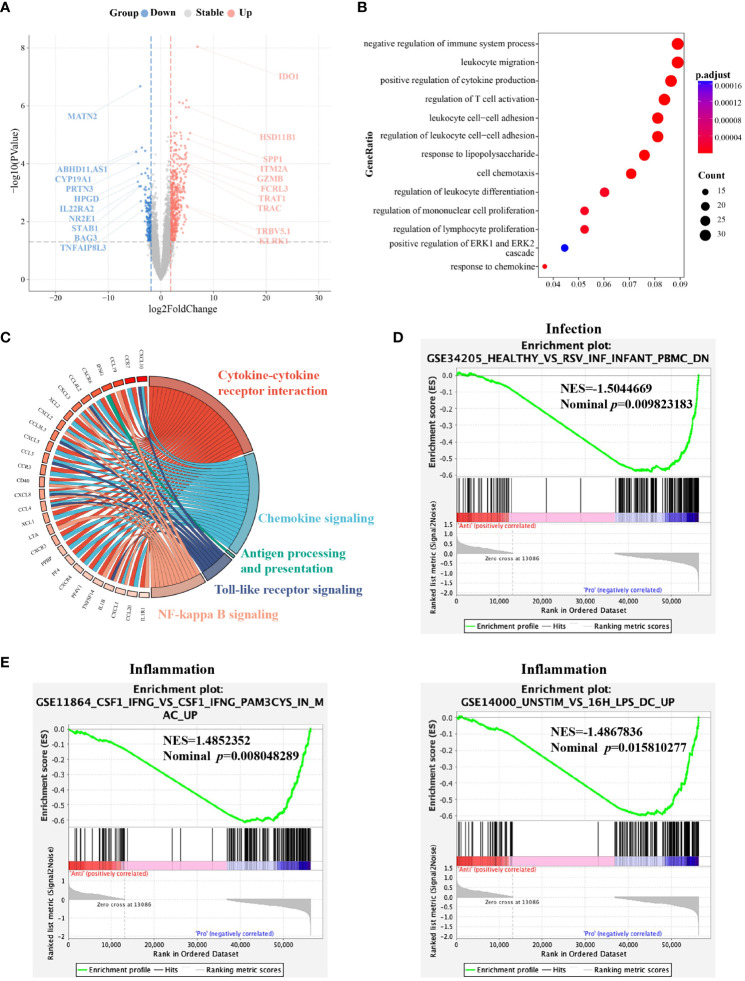
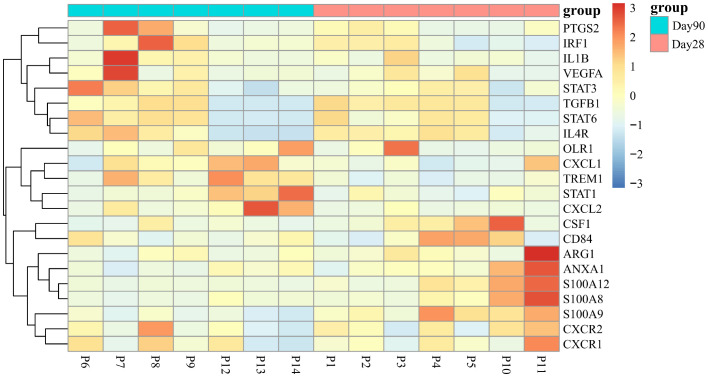
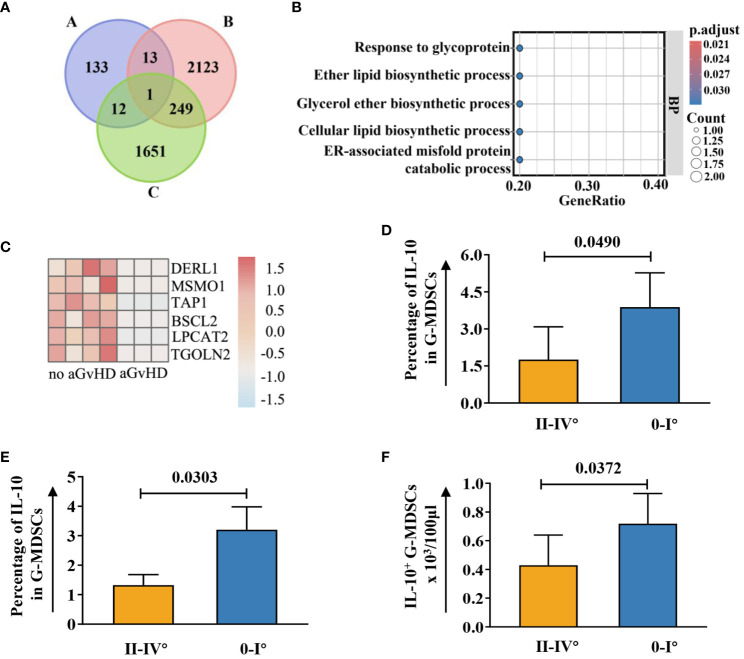
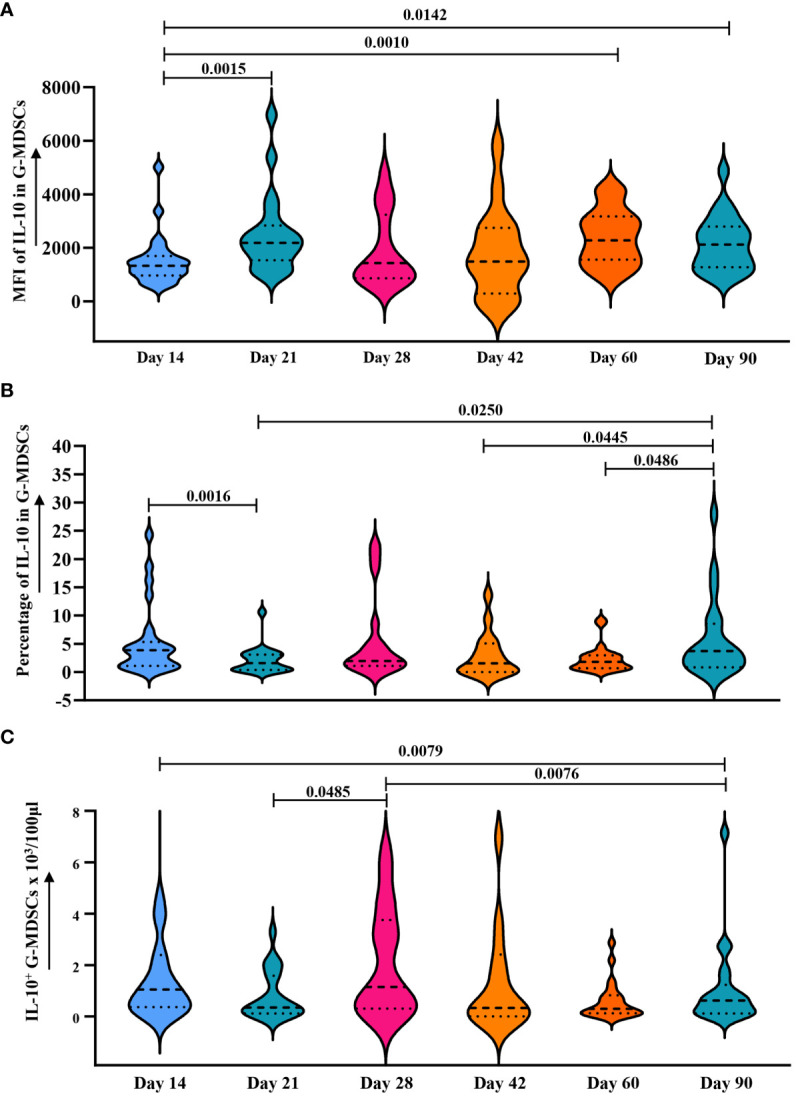
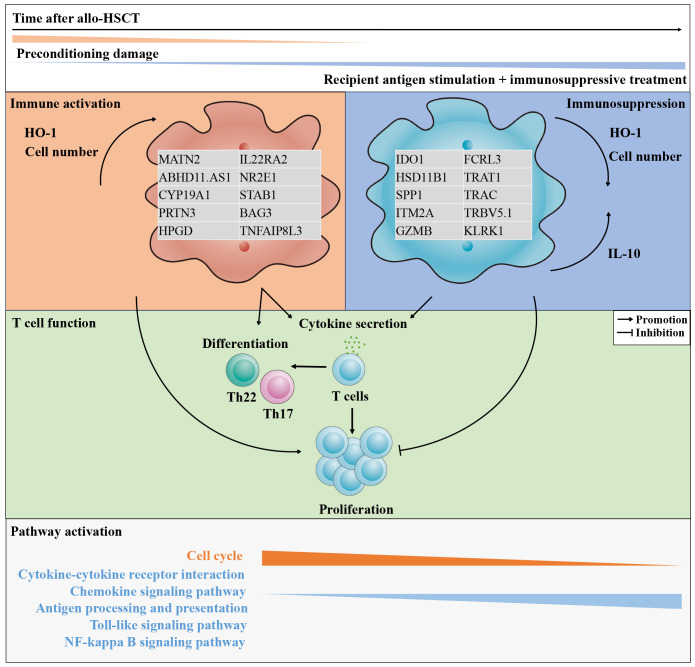
Results: G-MDSCs promoted inflammation in the early-stage, by facilitating cytokine secretion and proliferation of T cells, as well as their differentiation into pro-inflammatory T helper subsets. At day 28, patients with a higher number of G-MDSCs exhibited an increased risk of developing grades II-IV aGvHD. Besides, adoptive transfer of G-MDSCs from patients at day 28 into humanized mice exacerbated aGvHD. However, at day 90, G-MDSCs led to immunosuppression, characterized by upregulated expression of indoleamine 2,3-dioxygenase gene and interleukin-10 secretion, coupled with the inhibition of T cell proliferation. Furthermore, transcriptional analysis of G-MDSCs at day 28 and day 90 revealed that 1445 genes were differentially expressed. These genes were associated with various pathways, revealing the molecular signatures of early post-transplant differentiation in G-MDSCs. In addition, genes linked to the endoplasmic reticulum stress were upregulated in patients without aGvHD. The acquisition of immunosuppressive function by G-MDSCs may depend on the activation of CXCL2 and DERL1 genes.

Conclusion: Our findings revealed the alteration in the immune characteristics of G-MDSCs within the first 90 days post-allo-HSCT. Moreover, the quantity of G-MDSCs at day 28 may serve as a predictive indicator for the development of aGvHD.

Keywords: ER-stress; G-MDSCs; HO-1; T cells; aGVHD; allo-HSCT; immunomodulation.


Conflict of interest statement

The authors declare that the research was conducted in the absence of any commercial or financial relationships that could be construed as a potential conflict of interest.

Figures

Figure 1
Figure 1
Dynamic changes of G-MDSCs in patients after allo-HSCT within 90 days. (A) Gating strategy of granulocytic myeloid-derived suppressor cells (GMDSCs) and monocytic myeloid-derived suppressor cells (M-MDSCs). The frequencies of G-MDSCs in patients at day 14 (n=25), day 21 (n=20), day 28 (n=17), day 42 (n=16), day 60 (n=23), and day 90 (n=21) were analyzed using flow cytometry. (B) The absolute numbers of G-MDSCs were calculated as well. (C) The mean fluorescence intensity (MFI) and percentage of intracellular heme oxygenase-1 (HO-1) in G-MDSCs at day 28 were determined using intracellular staining. The absolute number of HO-1+ G-MDSCs at day 28 was calculated (n=17). Bars indicate the mean value of replicates, with error bars indicating the standard error of the mean.
Figure 2
Figure 2
ROC and correlation analysis of G-MDSCs and intracellular HO-1. (A, B) The number of samples of granulocytic myeloid-derived suppressor cells (G-MDSCs) at day 28 increased to 57 and was analyzed to confirm the conclusion (n=57). (C) Receiver operating characteristic curves (ROC) analysis to predict the morbidity of grades II-IV aGvHD in patients after allo-HSCT at day 28, based on the number of G-MDSCs and intracellular heme oxygenase-1 (HO-1) (n=57). (D) Cumulative incidence of grades II-IV aGvHD in haplo-identical and HLA-matched patients. (E) Cumulative incidence of grades II-IV aGvHD in haplo-identical and HLA-matched patients are analyzed using a competing risks model. Competing events include deaths due to non-aGvHD causes, severe infections, and organ failures.
Figure 3
Figure 3
Characterization of G-MDSCs in patients within 90 days. (A) Wright-Giemsa stain cytospin preparations reveal the morphological characteristics of granulocytic myeloid-derived suppressor cells (G-MDSCs) across various time points. (B) Flow cytometry analysis was performed to determine the apoptosis ratio of G-MDSCs cultured in vitro at 12 h, 24 h, 36 h, and 48 h (n=3). Bars indicate the mean value of replicates with error bars indicating the standard error of the mean. (C) The proportion of G-MDSCs in patients was determined, after purification from fresh blood on a density gradient using Ficoll-Paque. (D) Leukocytes were isolated from whole blood using Polymorphprep, which separates the leukocytes into upper and lower layers based on density differences. LDN, low-density neutrophils; HDN, high-density neutrophils; RBC, red blood cells.
Figure 4
Figure 4
The impact of G-MDSCs on autologous T cells and NK cells. (A) The secretion of interferon-gamma (IFN-γ) by CMV-specific T cells in the presence of granulocytic myeloid-derived suppressor cells (G-MDSCs) at day 14 (n=10), day 28 (n=7), day 60 (n=7), and day 90 (n=7) were measured by IFN-γ ELISpot assay. Bars indicate the mean value of replicates, with error bars indicating the standard error of the mean. (B, C) Proliferation of CD4-CD8+ and CD4+CD8- T cells in the presence of G-MDSCs at day 14 (n=11), day 28 (n=19), day 60 (n=12), and day 90 (n=12) were determined using flow cytometry after 4 days co-culture. Cell count and division index were determined, respectively. (D) G-MDSCs were co-cultured with T cells, in the presence of either the CMV pool or anti-CD3/28 for 8 hours. G-MDSCs incubated with T cells was used as control. The surface expression of HLA-DR was detected after incubation (n=11). Bars indicate mean value of replicates with error bars indicating standard error of the mean. (E) G-MDSCs from the patients at day 28 were co-cultured with T cells for 4 days, in the presence of anti-CD3/28. The proportion of Th subsets were evaluated using flow cytometry (n=9). *p=0.0377.
Figure 5
Figure 5
Injection of G-MDSCs from patients at day 28 into a humanized mouse model. (A) Protocol for establishing aGvHD model. Granulocytic myeloid-derived suppressor cells (G-MDSCs) collected from the patients at day 28 were injected into the mice with PBMCs from the related donors. (B) An enlarged spleen has been observed in the co-administration group. (C) Representative histology of the target organs harvested from the G-MDSCs alone control group, PBMC alone control group, and co-administration group. (D) Co-administration of G-MDSCs and PBMCs resulted in a notable decrease in the survival rate of mice (n=27). (E) T cell subsets were detected in the peripheral blood of mice once the proportion of human cells exceeded 20% (n=14). *p Th22 cells= 0.0313, Th17 cells=0.0469.
Figure 6
Figure 6
Molecular characterization of G-MDSCs differentiation as immune reconstitution progresses. (A) Volcano plot shows the differently expressed genes between the granulocytic myeloid-derived suppressor cells (G-MDSCs) in patients (n=7 each) at day 28 and day 90, respectively (|log2FC| >1, adjusted p<0.05). Red dots reveal genes expressed at a higher level at day 90. Blue dots represent the genes downregulated at day 90 compared to day 28. (B) Enriched GO terms were identified for elevated genes in G-MDSCs from patients at day 90 (adjusted p<0.05). (C) The GESA KEGG chord plot illustrates the connections among highly expressed genes in G-MDSCs at day 90 and their associated pathways, visually represented through connecting ribbons (NES>1, adjusted p<0.05). (D, E) GESA of genes expressed in G-MDSCs has been performed. Infection and inflammatory-associated pathways were enriched in G-MDSCs from patients at day 28.
Figure 7
Figure 7
Differential expression of signature genes in G-MDSCs at day 28 and day 90. The examination assessed the expression of 22 genes, differentiating G-MDSCs from classical neutrophils, within G-MDSCs at day 28 and day 90 (|log2FC| >1, adjusted p<0.05).
Figure 8
Figure 8
Upregulated genes associated with ER in G-MDSCs may protect patients from aGvHD. (A) Genetic overlap was analyzed across three cohorts: Cohort A examined genes related to heme oxygenase-1, Cohort B focused on differentially expressed genes (DEGs) in G-MDSCs comparing day 90 (n=7) to day 28 (n=4) in patients without subsequent aGvHD, and Cohort C analyzed DEGs in G-MDSCs at day 28 in patients with (n=3) versus without (n=4) subsequent aGvHD. (B) GO terms for intersecting genes across three G-MDSC cohorts (A-B-C, A-C, A-B intersections) were identified. (C) Heatmap shows DEGs associated with the endoplasmic reticulum (ER) at day 28 between patients without subsequent aGvHD (n=4) and those with (n=3). (D) At day 42, patients with grades 0-I aGvHD showed higher percentage of interleukin-10 (IL-10) in G-MDSCs compared to those with grades II-IV aGvHD (n=16). (E, F) By day 60, patients with grades 0-I aGvHD had increased IL-10 percentages and more IL-10+ G-MDSCs than those with grades II-IV aGvHD (n=23).
Figure 9
Figure 9
Dynamic analysis of IL-10 expression in G-MDSCs within 90 days. (A–C) Dynamic change of median fluorescence intensity (MFI) of IL-10 in G-MDSCs, as well as percentage of interleukin-10 (IL-10) in G-MDSCs and absolute count of IL-10+ G-MDSCs in patients at day 14 (n=25), day 21 (n=20), day 28 (n=17), day 42 (n=16), day 60 (n=23), and day 90 (n=21) were analyzed using flow cytometry. Dashed lines indicate the mean and quartiles of the data.
Figure 10
Figure 10
The features of CD11b+CD33+HLA-DR-/lowCD14- G-MDSCs shifted from immunostimulatory to immunosuppressive within 90 days after allo-HSCT. As the post-transplantation period lengthens, the tissue damage induced by preconditioning progressively reduces, while the impact of persistent recipient antigen stimulation and the administration of immunosuppressive medications gradually intensifies. The quantity of granulocytic myeloid-derived suppressor cells (G-MDSCs) and the intracellular oxidative stress protein, heme oxygenase-1 (HO-1), experiences a transition from an initial rise to a subsequent gradual decline. In parallel, the intracellular interleukin-10 (IL-10) increased. Throughout this process, genes with elevated expression undergo changes, accompanied by shifts in enriched pathways. Finally, by day 90, the function of G-MDSCs in promoting T cell proliferation shifts from initial promotion to an inhibitory role.

References

    1. Bronte V, Brandau S, Chen SH, Colombo MP, Frey AB, Greten TF, et al. . Recommendations for myeloid-derived suppressor cell nomenclature and characterization standards. Nat Commun. (2016) 7:12150. doi: 10.1038/ncomms12150 - DOI - PMC - PubMed
    1. Gabrilovich DI, Nagaraj S. Myeloid-derived suppressor cells as regulators of the immune system. Nat Rev Immunol. (2009) 9:162–74. doi: 10.1038/nri2506 - DOI - PMC - PubMed
    1. Perez C, Botta C, Zabaleta A, Puig N, Cedena MT, Goicoechea I, et al. . Immunogenomic identification and characterization of granulocytic myeloid-derived suppressor cells in multiple myeloma. Blood. (2020) 136:199–209. doi: 10.1182/blood.2019004537 - DOI - PubMed
    1. Botta C, Gulla A, Correale P, Tagliaferri P, Tassone P. Myeloid-derived suppressor cells in multiple myeloma: pre-clinical research and translational opportunities. Front Oncol. (2014) 4:348. doi: 10.3389/fonc.2014.00348 - DOI - PMC - PubMed
    1. Giese MA, Hind LE, Huttenlocher A. Neutrophil plasticity in the tumor microenvironment. Blood. (2019) 133:2159–67. doi: 10.1182/blood-2018-11-844548 - DOI - PMC - PubMed

MeSH terms