. 2024 Jun 14:17:96-107.
doi: 10.1016/j.ibneur.2024.06.003. eCollection 2024 Dec.

The antipsychotic potential of Salix Mucronata on ketamine-induced rats

Affiliations

The antipsychotic potential of Salix Mucronata on ketamine-induced rats

Ntombifuthi P Ngubane et al. IBRO Neurosci Rep. .

Abstract

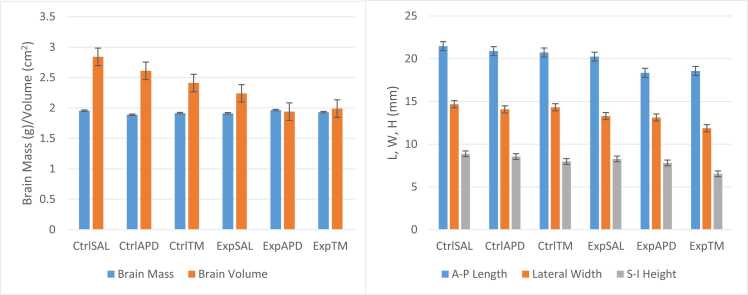
Salix mucronata is one of the herbal plants offered by the traditional health practitioners in KwaZulu-Natal, South Africa for the treatment of schizophrenia. This study aimed to investigate the effects of repeated administration of ketamine on social interaction, novelty and motivation in adult, male Sprague Dawley rats. It also aimed to investigate the potential of risperidone and the herbal extract of S. mucronata to reverse impairments that are induced by ketamine. Experimental rats (n=45) received a dose of ketamine at 30 mg/kg via intraperitoneal injection for 5 consecutive days. They were then allocated into their respective treatment groups and given risperidone (APD) and the herbal extract of S. mucronata (TM) at doses of 6 mg/kg and 5 mg/kg, respectively, for 7 consecutive days. Social behaviour was tested using the 3-chambered sociability test, and anhedonia was tested using the sucrose preference test. Ketamine induction elicited social withdrawal and reduced social novelty which were later successfully reversed by risperidone and S. mucronata. The rats showed reduced preference to sucrose post-induction and post-treatment. Ketamine and mild stress caused by scruff restraint elicited reduced weight gain for the animals. No differences were noted on brain mass between controls and experimental groups and also between risperidone and S. mucronata groups. However, reduced brain volume was noted in experimental groups. Dopamine and acetylcholine concentration levels were high in groups which received risperidone and S. mucronata. These findings highlight that the antipsychotic potential of S. mucronata is similar to risperidone.

Keywords: Herbal medicine; Mental disorders; Risperidone; Salix mucronata; Schizophrenia.


Conflict of interest statement

The authors have no conflict of interest to disclose.

Figures

Fig. 1
Fig. 1
Timeline of phases of the implementation procedure.
Fig. 2
Fig. 2
Phases of the Crawley’s sociability test.
Fig. 3
Fig. 3
Measurements of the brain: (a) length from the most anterior part of the frontal lobe to the most posterior part of the cerebellum, (b) width from the most lateral and convex part of one side of the brain to the most lateral and convex part on the other side, and (c) height from the most superior part of the brain to the most inferior part.
Fig. 4
Fig. 4
Weight gain average pre-induction, post-induction and post-treatment. The weight mean difference between the different phases (pre- and post-induction, and post-treatment were determined in order document the weight gained by animals in their groups after each phase. The weight gained by the animals was calculated as follows: Pre-induction = Adaptation Day 7 wt – adaptation Day 1 wt Post-induction = Induction Day 5 wt – induction Day 1 wt Post-treatment = Treatment Day 7 – treatment Day 1 wt No statistical significant interactions were noted for weight gained during pre- and post-induction, and post-treatment phases. The interactional effects were as follows: Pre-induction: F(2,60)=0.910, p=0.408; Post-induction: F(2,60)=0.202, p=0.818; Post-treatment: F(2,60)=0.900, p=0.421.
Fig. 5
Fig. 5
Sociability phase of the 3-chambered sociability test; (PrI, A-B) pre-induction; (PoI, C-D) post- induction and (PoT, E-F) post-treatment. After 5 min of habituation, all animals (n=66) were allowed to explore the 3 chambers of the apparatus (one at a time); and a randomly selected Stranger 1 (S1) animal (1 of n=20 of animals which served as strangers and were not part of the test animals) was introduced in a cage within one of the chambers. The order of test animals to undergo the sociability test was random and the side (left or right) where Stranger 1 was introduced was also selected randomly. The other cage on the other side was left empty (E) during this phase. Findings in this Figure are presented for time spent interacting [TN, or Time (N)] with the empty cage or cage with S1 for the pre- and post-induction, and post-treatment phases. Total time (TT) spent in each chamber with these cages was also noted. Statistical significance was noted in post-induction Time (N) in chamber with Stranger 1 for Ctrl™ vs Exp™, p=0.003 (*), and in post-treatment total time spent in chamber with empty cage for Ctrl™ vs Exp™, p=0.038 (α). No statistical significant interaction was noted for the sociability phase; however, marginal significance (**) was noted for time spent interacting with S1 post-treatment. The interactional effects for this phase were as follows: Pre-induction: S1(TN) – F(2,60)=0.535, p=0.588; S1(TT) – F(2,60)=0.815, p=0.448; E(TN) - F(2,60)=0.159, p=0.853; E(TT) - F(2,60)=0.979, p=0.382 Post-induction: S1(TN) – F(2,60)=0.400, p=0.672; S1(TT) – F(2,60)=1.207, p=0.306; E(TN) - F(2,60)=0.914, p=0.406; E(TT) - F(2,60)=0.815, p=0.447 Post-treatment: S1(TN) – F(2,60)=2.590, p=0.083**; S1(TT) – F(2,60)=0.830, p=0.441; E(TN) - F(2,60)=1.069, p=0.350; E(TT) - F(2,60)=1.368, p=0.263.
Fig. 6
Fig. 6
Novelty phase of the 3-chambered sociability test; (PrI, A-B) pre-induction; (PoI, C-D) post- induction and (PoT, E-F) post-treatment. After 10 min of the sociability test, all animals (n=66) were allowed to again explore the 3 chambers of the apparatus (one at a time); and a randomly selected Stranger 2 (S2) animal (also 1 of n=20 of animals which served as strangers and were not part of the test animals) was introduced in the cage which was previously empty during the sociability phase of the social interaction test. During the novelty phase (5 min), the test animal animals had access to explore or interact with either the familiar animal (Stranger 1/S1) or the novel animal (Stranger 2/S2). The test animals completed all phases of the social interaction test (habituation, sociability and novelty) before another randomly selected test animal was brought into the behavioural testing room to also complete the 3 phases. Findings in this Figure are presented for time spent interacting [TN, or Time (N)] with caged S1 and caged S2 for the pre- and post-induction, and post-treatment phases. Total time (TT) spent in each chamber with these cages was also noted. Statistical significance was noted in post-induction Time (N) in chamber with Stranger 1 for CtrlAPD vs ExpAPD, p=0.021 (*); post-induction Time (N) in chamber with Stranger 2 for CtrlSAL vs ExpSAL, p=0.029 (α); post-induction Total Time in chamber with Stranger 2 for Ctrl™ vs EXP™, p=0.047 (β). Statistical and marginal significant interactions (**) were noted post-induction and post-treatment for both time spent interacting with S1 and S2, and also total time spent in each chamber with the caged animals. The interactional effects for this phase were as follows: Pre-induction: S1(TN) – F(2,60)=0.972, p=0.384; S1(TT) – F(2,60)=0.820, p=0.445; S2(TN) - F(2,60)=0.429, p=0.653; S2(TT) - F(2,60)=0.942, p=0.396 Post-induction: S1(TN) – F(2,60)=1.017, p=0.368; S1(TT) – F(2,60)=3.508, p=0.036**; S2(TN) - F(2,60)=2.806, p=0.068**; S2(TT) - F(2,60)=4.750, p=0.012** Post-treatment: S1(TN) – F(2,60)=3.715, p=0.030**; S1(TT) – F(2,60)=3.635, p=0.032; S2(TN) - F(2,60)=0.352, p=0.704; S2(TT) - F(2,60)=3.832, p=0.041**.
Fig. 7
Fig. 7
Sucrose preference percentages (SP%). Anhedonia was measured using preference for normal drinking water over a sucrose solution. All test animals (n=66) were given 2 × 50 ml bottles (one with normal drinking and water and one with 1 % sucrose solution) in their home cages for 4 consecutive days. The sides which these bottles were placed was alternated every day. Liquid consumed was measured and the sucrose preference percentages (SP%) were calculated for each day. The sucrose preference test was done for all 3 phases of the experiment (pre- and post-induction, and post-treatment). No statistical significant interactions were noted for sucrose preference. The interactional effects for this phase were as follows: Pre-induction SP%: F(2,60)=0.412, p=0.664; Post-induction SP%: F(2,60)=0.701, p=0.500; Post-treatment SP%: F(2,60)=0.877, p=0.421.
Fig. 8
Fig. 8
Brain morphometry. After the test animals (n=66) were sacrificed, their brains were harvested and their mass, length (L), width (W) and height (H) were measure and the volume was calculated from L, W and H. No statistical significant interactions were noted for brain morphology. The interactional effects were as follows: Mass: F(2,60)=0.167, p=0.846; Volume: F(2,60)=0.217, p=0.805; Length: F(2,60)=0.490, p=0.615; Width: F(2,60)=0.820, p=0.445; Height: F(2,60)=0.461, p=0.633.
Fig. 9
Fig. 9
Dopamine (in PFC and VTA) and Acetylcholine (in PFC and Hippocampus) concentrations. Key: After the brain was measured for all test animals (n=66), the prefrontal cortex, ventral tegmental area and hippocampi were harvested from both sides of the brains. ELISA kits were used to determine the dopamine and acetylcholine concentrations from the harvested parts of the brain. Statistical significance was noted for DA PFC ExpSAL vs Exp™, p<0.001 (*), and for ACh PFC CtrlSAL vs CtrlAPD, p=0.028 (α).Statistical significant interaction was noted for the PFC dopamine concentration and marginal significance was noted for PFC acetylcholine concentration. The interactional effects were as follows: DA_PFC: F(2,60)=2.606, p=0.082**; DA_VTA: F(2,60)=1.258, p=0.321; ACh_PFC: F(2,60)=4.181, p=0.020**; ACh_Hippo: F(2,60)=0.579, p=0.564.

References

    1. de Bartolomeis A., Ciccarelli M., De Simone G., Mazza B., Barone A., Vellucci L. Canonical and non-canonical antipsychotics’ dopamine-related mechanisms of present and next generation molecules: a systematic review on translational highlights for treatment response and treatment-resistant schizophrenia. Int. J. Mol. Sci. 2023;24(6):1–57. doi: 10.3390/ijms24065945. - DOI - PMC - PubMed
    1. Becker A., Grecksch G. Ketamine-induced changes in rat behaviour: a possible animal model of schizophrenia. Test of predictive validity. Prog. Neuro-Psychopharmacol. Biol. Psychiatry. 2004;28(8):1267–1277. doi: 10.1016/j.pnpbp.2004.06.019. - DOI - PubMed
    1. Becker A., Peters B., Schroeder H., Mann T., Huether G., Grecksch G. Ketamine-induced changes in rat behaviour: a possible animal model of schizophrenia. Prog. Neuro-Psychopharmacol. Biol. Psychiatry. 2003;27(4):687–700. doi: 10.1016/S0278-5846(03)00080-0. - DOI - PubMed
    1. Bekhbat M., Merrill L., Kelly S.D., Lee V.K., Neigh G.N. Brief anesthesia by isoflurane alters plasma corticosterone levels distinctly in male and female rats: implications for tissue collection methods. Behav. Brain Res. 2016;305:122–125. doi: 10.1016/j.bbr.2016.03.003. - DOI - PMC - PubMed
    1. Bialon M., Wasik A. Advantages and limitations of animal schizophrenia models. Int. J. Mol. Sci. 2022;23(11):1–32. doi: 10.3390/ijms23115968. - DOI - PMC - PubMed

LinkOut - more resources