. 2024 Jun 22;9(4):1257-1270.
doi: 10.1016/j.ncrna.2024.06.013. eCollection 2024 Dec.

Human lncRNAs harbor conserved modules embedded in different sequence contexts

Affiliations

Human lncRNAs harbor conserved modules embedded in different sequence contexts

Francesco Ballesio et al. Noncoding RNA Res. .

Abstract

We analyzed the structure of human long non-coding RNA (lncRNAs) genes to investigate whether the non-coding transcriptome is organized in modular domains, as is the case for protein-coding genes. To this aim, we compared all known human lncRNA exons and identified 340 pairs of exons with high sequence and/or secondary structure similarity but embedded in a dissimilar sequence context. We grouped these pairs in 106 clusters based on their reciprocal similarities. These shared modules are highly conserved between humans and the four great ape species, display evidence of purifying selection and likely arose as a result of recent segmental duplications. Our analysis contributes to the understanding of the mechanisms driving the evolution of the non-coding genome and suggests additional strategies towards deciphering the functional complexity of this class of molecules.

Keywords: Non-coding RNAs; Sequence alignments; Structure alignments; lncRNA; lncRNA evolution; lncRNA modules.


Conflict of interest statement

The authors declare that they have no known competing financial interests or personal relationships that could have appeared to influence the work reported in this paper.

Figures

Fig. 1
Fig. 1
Sequence and structure alignments results. A) Distribution of z-transformed pairwise alignment scores for sequence; B) Distribution of z-transformed pairwise alignment scores for structures, for these distributions, a close-up around the proposed cutoff thresholds is also shown; C) heatmap representing the conservation scores in the four non-human primates of all pairs selected at the different z-score thresholds of sequence and structure alignments; D, E) Mean conservation scores (within four non-human primates) of members of clusters defined by different z-score thresholds of pairwise similarity for sequence (D) and structure (E). Note the steep increase in evolutionary conservation for the z-score cutoff of 6.2 (sequence) and 5.3 (structure), respectively; F) Scatter plot of sequence and structure similarity z-scores of the exon pairs (for the sake of clarity, the more than 73 million pairs below the thresholds are not shown).
Fig. 2
Fig. 2
Network representation of the exon-sharing gene clusters and the corresponding exon modules. Each node represents a lncRNA gene and each edge an exonic module shared between two genes. Same color edges within a gene cluster represent a module. Self-loops represent instances where the same module occurs multiple times in a single gene. The network representation was generated using Cytoscape [42].
Fig. 3
Fig. 3
An example of the identified exon modules. A) Schematic representation of 7 genes containing representatives (in red) of exons contributing to a module cluster. Each box represents an exon, with width proportional to its length (intron length not to scale); B) multiple alignment of the 9 exons contributing to the cluster.
Fig. 4
Fig. 4
Analysis of the sequence regions flanking exon modules. A) For each pair of genes containing a shared exon module we compared the similarities of the upstream and downstream flanking exons (when present); B) Distributions of the length-normalized Needleman and Wunsch scores of exonic modules (in blue) and of their upstream and downstream flanking exons (in red); C) A pair of exons in which the similarity only extends to the downstream flanking intron; D) A pair of exons in which the similarity extends upstream and downstream into both flanking introns; E) Overall representation of all the length-scaled similarities between all the exon pairs and their flanking introns (in gray), the median identity percentage is represented in red. The other colored lines represent five clusters of similarity patterns as defined by grouping individual lines; F) Number of occurrences per thousand base pairs of families of repetitive sequences in flanking introns with significant differences (padj<0.05) between the exonic modules and the other lncRNA exons.
Fig. 5
Fig. 5
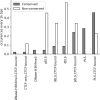
Cis-regulatory elements (CRE) and position of the modules. A) number of occurrences of the different CREs from the annotation present in ENCODE every thousand nucleotides in the modules (in blue) and in the other lncRNA exons of the dataset (in red); B) the y axis indicates the frequency of regions containing modules relative to their position on their transcript (which is indicated on the Y axis, see Methods), as the sum of modules present in that region. The higher y value therefore indicates that there is a greater number of modules at the ends of the transcripts, particularly at the level of the 5′ end.
Fig. 6
Fig. 6
Evolutionary conservation of exon modules. A) Box-plot of the conservation scores in four non-human primates for exon modules, functionally annotated exons from the lnc2Cancer database, and controls; B) Percentage of exon modules (in blue) and other exons (in red) that showed a BLAST hit (e-value <0.001) in the primate species considered; C) Percentage of genes showing a conserved syntenic region (as defined in SynthDB) among those containing exon modules (in blue) vs genes not containing an exon module (in red); D) Upset plot representing the exons that have a BLAST hit in the species analyzed in Sarropoulos et al. [50] and in other model organisms; E) Percentages of modules (in blue) and other exons (in red) showing a BLAST hit in the indicated species F) PhastCons 30 mammals scores of members of clusters defined by different z-score thresholds of pairwise similarity from sequence alignments (in blue) and the other lncRNA exons of the dataset (in red).
Fig. 7
Fig. 7
Organization of a sequence and a structure module and identified motifs. A) Schematic representation of the lncRNA genes containing the putative YBX1 binding module (in green); B) Representation of the lncRNA genes containing the exons with the putative LIN28B binding module and their secondary structures. The blue boxes represent the exons with high structural similarity that form the module; C) secondary structure motif revealed by BRIO represented with the BEAR alphabet [30]; D) sequence motif recognized by ZnK in the three modules. The RNA secondary structure representations were generated using VARNA [60]; Sequence and structure logos were generated using WebLogo [61].
Figure S1
Figure S1
Numerosity of lncRNA exons per exon cluster.
Figure S2
Figure S2
Positions of the exon modules on the human chromosomes.
Figure S3
Figure S3
Comparison of BLAST hit frequencies at different evolutionary divergence ages of exonic modules (A) and lncRNAs genes analyzed by Sarropoulos et al. (B).
Figure S4
Figure S4
Number of occurrences of the different CREs in conserved and not-conserved exon modules.

References

    1. Gilbert W. Nature Publishing Group UK; 1978. Why Genes in Pieces? - DOI - PubMed
    1. Engreitz J.M., Haines J.E., Perez E.M., Munson G., Chen J., Kane M., McDonel P.E., Guttman M., Lander E.S. Local regulation of gene expression by lncRNA promoters, transcription and splicing. Nature. 2016;539:452–455. - PMC - PubMed
    1. Frankish A., Diekhans M., Jungreis I., Lagarde J., Loveland J.E., Mudge J.M., Sisu C., Wright J.C., Armstrong J., Barnes I., Berry A., Bignell A., Boix C., Carbonell Sala S., Cunningham F., Di Domenico T., Donaldson S., Fiddes I.T., García Girón C., Gonzalez J.M., Grego T., Hardy M., Hourlier T., Howe K.L., Hunt T., Izuogu O.G., Johnson R., Martin F.J., Martínez L., Mohanan S., Muir P., Navarro F.C.P., Parker A., Pei B., Pozo F., Riera F.C., Ruffier M., Schmitt B.M., Stapleton E., Suner M.-M., Sycheva I., Uszczynska-Ratajczak B., Wolf M.Y., Xu J., Yang Y.T., Yates A., Zerbino D., Zhang Y., Choudhary J.S., Gerstein M., Guigó R., Hubbard T.J.P., Kellis M., Paten B., Tress M.L., Flicek P. Gencode 2021. Nucleic Acids Res. 2021;49:D916–D923. - PMC - PubMed
    1. Quek X.C., Thomson D.W., Maag J.L.V., Bartonicek N., Signal B., Clark M.B., Gloss B.S., Dinger M.E. lncRNAdb v2.0: expanding the reference database for functional long noncoding RNAs. Nucleic Acids Res. 2015;43:D168–D173. - PMC - PubMed
    1. Gao Y., Shang S., Guo S., Li X., Zhou H., Liu H., Sun Y., Wang J., Wang P., Zhi H., Li X., Ning S., Zhang Y. Lnc2Cancer 3.0: an updated resource for experimentally supported lncRNA/circRNA cancer associations and web tools based on RNA-seq and scRNA-seq data. Nucleic Acids Res. 2021;49:D1251–D1258. - PMC - PubMed

LinkOut - more resources