[Preprint]. 2025 Jun 18:rs.3.rs-4718850.
doi: 10.21203/rs.3.rs-4718850/v2.

A hypothalamic circuit for circadian regulation of corticosterone secretion

Affiliations

A hypothalamic circuit for circadian regulation of corticosterone secretion

Oscar D Ramirez-Plascencia et al. Res Sq. .

Abstract

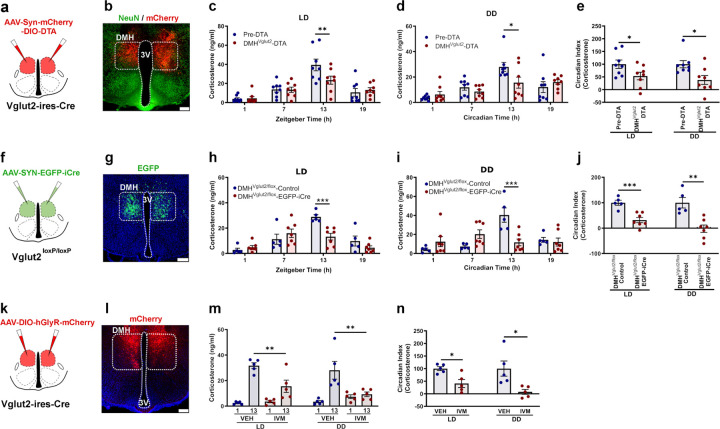
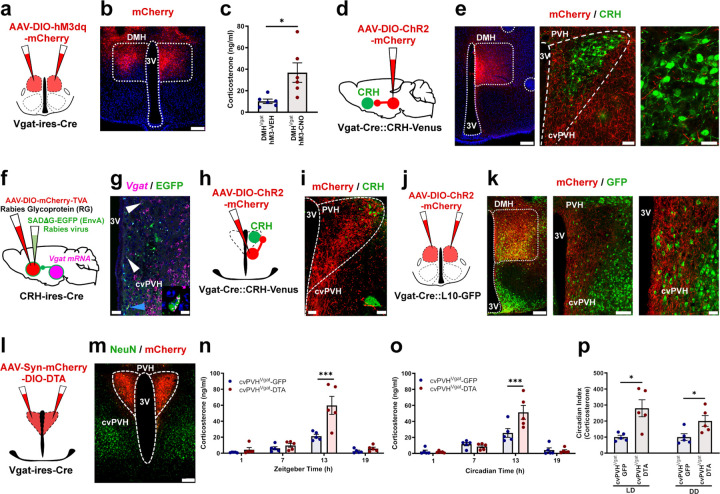
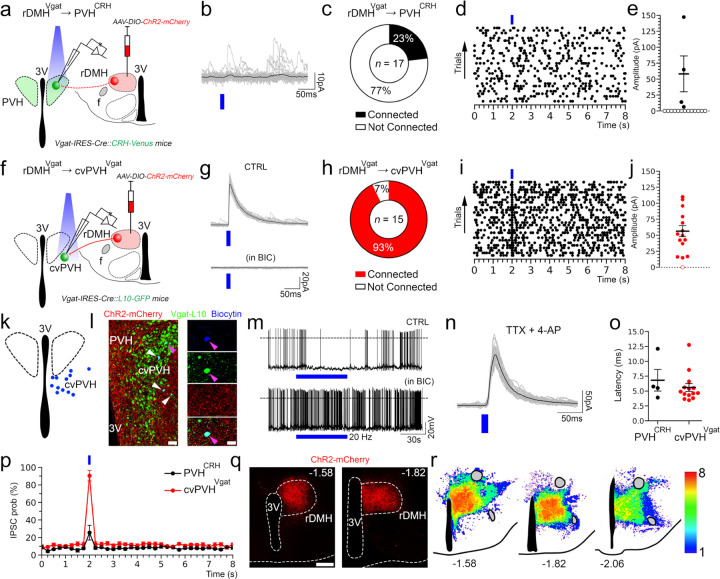
The secretion of cortisol in humans and corticosterone (Cort) in rodents follows a daily rhythm which is important in readying the individual for daily activity. This rhythm is orchestrated by the suprachiasmatic nucleus (SCN), but how it ultimately regulates the circadian rhythm of activity of neurons in the paraventricular nucleus of the hypothalamus that produce corticotropin-releasing hormone (PVHCRH neurons) is not known. We hypothesized that the SCN may exert this influence by projections to the subparaventricular zone (SPZ), which in turn innervates neurons in the dorsomedial nucleus of the hypothalamus (DMH) that regulate PVHCRH neurons. First, we found that ablating SPZVgat neurons eliminates the circadian rhythm of Cort secretion, but that deleting Vgat from them does not, suggesting that they predominantly use some other transmitter. Next, we found that either ablating or acutely inhibiting the DMH glutamatergic (DMHVglut2) neurons resulted in a 40-70% reduction in the daily peak of Cort. Deletion of the Vglut2 gene within the DMH produced a similar effect, highlighting the indispensable role of glutamatergic signaling. Chemogenetic stimulation of DMHVglut2 neurons led to an increase of Cort levels, and optogenetic activation of their terminals in the PVH in hypothalamic slices directly activated PVHCRH neurons through glutamate action on AMPA receptors (the DMHVglut2 → PVHCRH pathway). Similar to the disruption of DMHVglut2 neurons, ablating, inhibiting, or disrupting GABA transmission by DMH GABAergic (DMHVgat) neurons diminished the circadian peak of Cort, particularly under constant darkness conditions. Chemogenetic stimulation of rostral DMHVgat neurons increased Cort, although with a lower magnitude compared to DMHVglut2 neuron stimulation, suggesting a role in disinhibiting PVHCRH neurons. Supporting this hypothesis, we found that rostral DMHVgat neurons project directly to GABAergic neurons in the caudal ventral part of the PVH and adjacent peri-PVH area (cvPVH), which directly inhibit PVHCRH neurons, and that activating the rostral DMHVgat terminals in the cvPVH in brain slices reduced GABAergic afferent input onto the PVHCRH neurons. Finally, ablation of cvPVHVgat neurons resulted in increased Cort release at the onset of the active phase, affirming the pivotal role of the DMHVgat → cvPVHVgat → PVHCRH pathway in Cort secretion. In summary, our study delineates two parallel pathways transmitting temporal information to PVHCRH neurons, collectively orchestrating the daily surge in Cort in anticipation of the active phase. These findings are crucial to understand the neural circuits regulating Cort secretion, shedding light on the mechanisms governing this physiological process and the coordinated interplay between the SCN, SPZ, DMH, and PVH.

Keywords: corticosterone; corticotropin-releasing hormone; dorsomedial hypothalamus and paraventricular hypothalamus.


Conflict of interest statement

Competing interests The authors declare no competing interests.

Figures

Figure 1.
Figure 1.. SPZVgat neurons, but not GABA release, are necessary for maintaining the circadian rhythm of Cort secretion.
(a) Schematic drawing of SPZVgat neuron ablation by DTA (b) Representative image of a section from an animal with SPZVgat neuron ablation, showing GABAergic neurons (in green, native signal) and the injection site in red (non-DMHVglut2 neurons expressing mCherry, native signal). Notice the remaining green GABAergic neurons in the SCN, and the almost complete elimination of GABAergic neurons just dorsally in the SPZ. Red mCherry was expressed by non-GABAergic cells in the injection site. (c) Ablation of SPZVgat neurons prevented the daily Cort increase at ZT13 in LD (Two-way ANOVA; Tukey’s multiple comparisons test. ZT13 SPZVgat-GFP vs SPZVgat-DTA: *p=0.025) and (d) at CT13 in DD (Two-way ANOVA; Tukey’s multiple comparisons test. CT13 SPZVgat-GFP vs SPZVgat-DTA: ***p<0.001). (e) The circadian index (CI, for method of calculation of CI, see Statistical Analysis in the Materials and Methods) of Cort secretion was reduced by 66.6 ±9.1% in LD (Unpaired t-test: t=5.434, df=14, **p=0.002) and by 97.7 ±5.9% in DD (Unpaired t-test: t=5.534, df=14, ***p<0.001). (f) Schematic representation of Vgat gene deletion in the SPZ. (g) Representative micrograph showing EGFP expression in the SPZ neurons in which the Vgat gene was deleted (green), just dorsal to the SCNVIP neurons (shown immunohistochemically in red). (h) Mice with Vgat gene deletion in the SPZ showed no change in the daily Cort peak either in LD or (i) DD photoperiod. (j) No changes were detected in the Cort CI. LD, Light:Dark photoperiod; DD, Constant darkness
Figure 2.
Figure 2.. DMHVglut2 neurons are necessary to maintain the endogenous circadian rhythm of Cort release.
(a) Schematic of the DMHVglut2 neuron ablation by DTA (b) Representative image of a section from an animal with DMHVglut2 neuron ablation, showing the injection site in red (non-DMHVglut2 neurons expressing mCherry) and green NeuN staining as a reference marker. (c) Ablation of DMHVglut2 neurons reduced the circadian peak of Cort at ZT13 in LD (Two-way ANOVA; Tukey’s multiple comparisons test. ZT13 Pre-DTA vs DMHVglut2-DTA: **p=0.007) and (d) in DD at CT13 (Two-way ANOVA; Tukey’s multiple comparisons test. CT13 Pre-DTA vs DMHVglut2-DTA: *p=0.013). (e) The Cort circadian index (CI) in the DMHVglut2 ablated mice was reduced by 46.6 ±14.2% in LD (Paired t-test: t=2.225, df=14, *p=0.043) and 62.0 ±17.3% in DD (Unpaired t-test: t=2.775, df=14,*p=0.014). (f) Schematic representation of Vglut2 gene deletion in the DMH. (g) Representative micrograph showing EGFP expression in the DMH neurons in which the Vglut2 gene has been deleted (in green). (h) Vglut2 deletion in DMH diminished the Cort peak at ZT13 in LD (Two-way ANOVA; Tukey’s multiple comparisons test. ZT13 DMHVglut2/flox-Control vs DMHVglut2/flox-EGFP-iCre: ***p<0.001) and entirely prevented the peak at CT13 in DD (i; Two-way ANOVA; Tukey’s multiple comparisons test. CT13 DMHVglut2/flox-Control vs DMHVglut2flox-EGFP-iCre: ***p<0.001). (j) The Cort CI was reduced by 68.2 ±10.1% in LD (Unpaired t-test: t=4.621, df=10, ***p<0.001) and by 102.1 ±14.6% in DD (Unpaired t-test: t=4.167, df=10, **p=0.001). (k) Schematic of the chemogenetic inhibition of DMHVglut2 neurons expressing hGlyR by IVM administration. (l) Representative micrograph of hGlyR-mCherry expression in the DMH (in red). (m) IVM administration diminished the Cort rise at ZT13 in LD (Two-way ANOVA; Tukey’s multiple comparisons test. ZT13 VEH vs IVM: **p=0.006) and almost entirely prevented it at CT13 in DD compared with vehicle (Two-way ANOVA; Tukey’s multiple comparisons test. CT13 VEH vs IVM: **p=0.001). (n) The Cort CI was reduced one day after the administration of IVM by 58.9 ±15.9% in LD (Paired t-test: t=3.334, df=8, *p=0.01) and by 92.3 ± 9.9% in DD (Paired t-test: t=2.903, df=8, *p=0.019). In all cases we visualize the native signal except for the hGlyR signal that was enhanced with immunofluorescence for mCherry. LD, Light:Dark photoperiod; DD, Constant dark; Reference scale bar= 200µm; 3V, third ventricle.
Figure 3.
Figure 3.. DMHVglut2 neurons project to the CRH neurons of the PVH and their chemogenetic activation increases Cort.
(a) Schematic of AAV-DIO-hM3dq-mCherry injection targeting the DMHVglut2 neurons. (b) Representative image of an AAV-DIO-hM3dq-mCherry (in red) injection site in the DMH. (c) CNO-mediated chemogenetic-stimulation of DMHVglut2 neurons boosted Cort to levels much higher than the usual daily peak (cf. Fig 2c; Two-way ANOVA; Tukey’s multiple comparisons test. CT4 WT CNO vs DMHVglut2 CNO: ***p<0.001, CT4 DMHVglut2 Saline vs DMHVglut2 CNO: ***p<0.001). (d) Schematic of AAV-DIO-ChR2-mCherry injection targeting DMHVglut2 neurons. (e) Representative photomicrograph of the DMHVglut2 neurons expressing ChR2-mCherry (left panel, in red), and their appositions with PVHCRH neurons (right panel, in green). (f) Schematic of the EnvA-rabies experiment to map the monosynaptic input from the DMHVglut2 neurons to PVHCRH neurons. (g) Mapping of the rabies-Vglut2 co-labeling distribution at different rostro-caudal levels of the DMH, and representative images showing Vglut2 mRNA expression (g’ and g’’, in magenta) and rabies expression (g’ and g’’’, in green) within the rostral DMH (rDMH). The arrows point to the co-labeled cells, and the inset in the lower-right part shows a higher magnification of the neuron pointed by the blue arrow. The hM3dq and ChR2 signal were enhanced with immunofluorescence for mCherry, while the Rabies infected cells were enhanced using an EGFP antibody. Reference scale bar: in b and e (left)= 200 µm, e (center) and g’-g’’’= 50µm, in g’-g’’’ insets = 10µm. 3V, third ventricle. Atlas levels correspond to Paxinos and Franklin Atlas .
Figure 4.
Figure 4.. In vitro optogenetic stimulation of the DMH glutamatergic input directly excites PVHCRH neurons.
(a) Schematic representation of the recording to test the proposed DMHVglut2 → PVHCRH circuit; Vglut2-ires-Cre::CRH-Venus mice were injected with AAV-DIO-ChR2-mCherry in the DMH and recordings were conducted in brain slices from Venus-labeled PVHCRH neurons while photostimulating the ipsilateral DMHVglut2 input (the DMH is shown on the opposite side of the brain here for ease of illustration). (b) An example of ChR2-mCherry native expression after an injection in the DMH (top left) and density plots of the AAV-DIO-ChR2-mCherry injection sites (n=4 mice; right and bottom). (c) AMPA-mediated opto-evoked excitatory post-synaptic currents (oEPSCs) recorded in PVHCRH neurons (upper trace) and blockade by AMPA receptor antagonist DNQX, 200µM (lower trace; n=4, from 2 mice). (d) Percentages of PVHCRH neurons responding (Connected) and not responding (Not Connected) to photostimulation of the DMHVglut2 input (n=18 PVHCRH recorded neurons, from 4 mice). (e) Amplitude (filled markers, cells responding to photostimulation, n=13, open markers, cells not responding to photostimulation, n=15 neurons from 4 mice; mean and ± SEM of responding neurons) and (f) latency of oEPSCs in PVHCRH neurons in response to photostimulation of the DMHVglut2 input (mean and ± SEM; n=13 neurons from 4 mice). (g) oEPSCs in PVHCRH neurons recorded in TTX 1µM + 4-AP 500µM (n=6 neurons from 2 mice) indicating monosynaptic connectivity. (h) Raster plot of EPSCs in a representative PVHCRH neuron with photostimulation of the DMHVglut2 → PVHCRH input (bin duration: 50ms). (I) EPSC probability in response to photostimulation of the DMHVglut2 → PVHCRH input (black, n=13 neurons; grey, n=5 neurons, from 4 mice). Reference scale bar: in b = 250 µm. f, fornix, 3V, third ventricle. Atlas levels correspond to Paxinos and Franklin Atlas .
Figure 5.
Figure 5.. Ablation of DMHVgat neurons reduces the endogenous circadian peak of Cort release only in constant darkness.
(a) Schematic representation of DMHVgat neuron ablation. (b) Representative micrograph showing GABAergic neurons (in green) and AAV-DIO-DTA-mCherry (in red) in the DMH of a Vgat-ires-Cre::L10-GFP mice. There were no remaining GABAergic neurons in the region of mCherry expression. (c) DMHVgat neuron ablation did not alter the daily Cort release in LD, (d) but eliminated it almost entirely under DD (Two-way ANOVA; Tukey’s multiple comparisons test. CT13 Pre-DTA vs DMHVgat-DTA: *p=0.014). (e) The Cort CI was not significantly changed by DMHVgat ablation in LD, but was reduced by 72.4 ±21.3% in DD. (Paired t-test: t=3.028, df=12, *p=0.01). (f) Schematic representation of Vgat gene deletion in the DMH. (g) Representative photomicrograph showing the EGFP expression in Vgat-deleted neurons (green). (h) Vgat deletion from DMH neurons did not change the circadian regulation of Cort release in LD, (i) but eliminated the daily peak of Cort at CT13 in DD (Two-way ANOVA; Tukey’s multiple comparisons test. CT13 DMHVgat/flox-Control vs DMHVgat/flox-EGFP-iCre: **p=0.006). (j) The CI of Cort secretion was not affected by Vgat gene deletion in the DMH in LD but was reduced by 76.6 ±13.6% in DD in DMHVgat-deleted mice (Unpaired t-test: t=3.160, df=12, **p=0.008). (k) Schematic representation of the AAV-DIO-hGlyR-mCherry injection in the DMH of Vgat-ires-Cre mice. (l) Representative micrograph of hGlyR-mCherry expression (in red) in the Vgat neurons of the DMH. (m) IVM chemo-inhibition of the DMHVgat neurons by hGlyR did not alter the Cort levels in LD, but prevented the peak at CT13 in DD (Two-way ANOVA; Tukey’s multiple comparisons test. CT13 VEH vs IVM: **p=0.006). (n) The Cort CI was reduced by 95.7 ±6.9% in DD (Paired t-test: t=3.641, df=8, **p=0.006). In all cases we visualize the native signal except for the hGlyR signal that was enhanced with immunofluorescence for mCherry. Reference scale bar= 200µm; 3V, third ventricle.
Figure 6.
Figure 6.. Chemo-activation of DMHVgat neurons elevates Cort levels through cvPVH GABAergic neurons.
(a) Schematic of AAV-DIO-hM3dq-mCherry injections in the DMH in Vgat-ires-Cre mice. (b) Representative micrograph of hM3dq-mCherry expression (red) in the DMH. (c) Chemogenetic activation of the DMHVgat neurons increased Cort levels from 10.2 ±2 ng/ml after VEH to 36.8 ±9 ng/ml after CNO administration (Paired t-test: t=2.875, df=10, *p=0.016). (d) Schematic of an AAV-DIO-ChR2-mCherry injection in the DMH of a Vgat-Cre::CRH-Venus mice. (e) Representative micrograph of rDMHVgat neurons expressing ChR2-mCherry (in red, left panel), and their axon pattern in the PVH (central panel). Note that rDMHVgat axon terminals mostly avoided the PVHCRH neurons (in green, right panel) but were dense in the ventral-medial and caudal portion of the PVH (cvPVH). (f) Schematic of the EnvA-Rabies experiment to map monosynaptic inputs from the cvPVHVgat neurons to PVHCRH neurons. (g) Representative photomicrograph showing the Vgat mRNA expression (in magenta) and the Rabies expression (in green) and doubly labeled neurons within the cvPVH. Arrows point to double labeled neurons; the blue arrow points to the neuron in the lower-right inset. (h) Schematic of an AAV-DIO-ChR2-mCherry injection in the cvPVH. (i) Representative image of the cvPVHVgat cell bodies expressing ChR2-mCherry (in red) in the ventral part of the PVHCRH neuron field (in green). Their axons spread through the more dorsal PVH and form appositions with the PVHCRH neurons (lower-right inset). (j) Schematic of the AAV-DIO-ChR2-mCherry injections in the DMH. (k) Micrograph showing the expression of ChR2-mCherry (in red) in the DMHVgat neurons (in green, left panel), and their projections and appositions to the cvPVHVgat neurons (central and right panel). (l) Schematic of the PVHVgat neuron ablation. (m) Representative image of the injection site showing mCherry expression (in red) in non-Vgat neurons in the PVH, and the loss of neurons detected by the reduction of NeuN (in green) in the cvPVH and along the PVH borders due to the ablation of the Vgat cells. (n) The cvPVHVgat ablation boosted the Cort increase at ZT13 in LD (Two-way ANOVA; Tukey’s multiple comparisons test. ZT13 cvPVHVgat-GFP vs cvPVHVgat-DTA: ***p<0.001), and (o) at CT13 in DD (Two-way ANOVA; Tukey’s multiple comparisons test. CT13 cvPVHVgat-GFP vs cvPVHVgat-DTA: ***p<0.001). (p) The Cort CI increased after the cvPVHVgat neuron ablation by 180.2 ±52.9% in LD (Unpaired t-test: t=3.336, df=8, *p=0.01) and 100.4 ±33.9% in DD (Unpaired t-test: t=2.512, df=8, *p=0.036). The hM3dq and ChR2 signal, but not in the DTA experiments, were enhanced with immunofluorescence for mCherry, while the Rabies infected cells were enhanced using an EGFP antibody. Reference scale bar: in b, e, I, k, and m = 200 µm, e (center), g and k (center) = 50µm, in e (right panel), i (right panel) and k (right panel) = 20µm, in g and i (insets)= 5µm; 3V, third ventricle.
Figure 7.
Figure 7.. In vitro optogenetic stimulation of the GABAergic input from the rostral DMH spares PVHCRH neurons and directly inhibits GABAergic neurons in the cvPVH.
(a) A schematic representation of the recordings to test rDMHVgat → PVHCRH connectivity; Vgat-ires-Cre::CRH-Venus mice were injected with AAV-DIO-ChR2-mCherry in the rDMH (n=3 mice). Recordings were conducted in brain slices from ipsilateral Venus-labeled PVHCRH neurons while photostimulating the ipsilateral DMHVgat input (DMH is shown on the opposite side for ease of illustration). (b) Stimulation of the rDMHVgat input produced no synaptic responses time-locked to the light pulses in most of the PVHCRH neurons. (c) Percentages of PVHCRH neurons responding (Connected) and not responding (Not Connected) to photostimulation of the rDMHVgat input (n=17 PVHCRH recorded neurons from 3 mice). (d) Raster plot of IPSCs in a representative PVHCRH neuron with photostimulation of the rDMHVgat → PVHCRH input (bin duration: 50ms) showing lack of input. (e) oIPSC amplitude following photostimulation of the rDMHVgat → PVHCRH input (filled markers, cells responding to photostimulation, n=4 neurons; open markers, cells not responding to photostimulation, n=13; mean and ± SEM of responding neurons from 3 mice). (f) To explore rDMHVgat → cvPVHVgat connectivity, Vgat-ires-Cre::L10-GFP mice (n=5 mice) were injected with AAV-DIO-ChR2-mCherry in the rDMH, and recordings were conducted in ipsilateral GFP-labeled cvPVHVgat neurons while photostimulating the rDMHVgat input. (g) Photostimulation of the DMHVgat input produced opto-evoked inhibitory postsynaptic currents (oIPSCs) in most of the cvPVHVgat neurons. GABAA-mediated oIPSCs recorded in cvPVHVgat neurons (upper trace) and blocked by bicuculline (BIC 20µM; n=4 neurons from 4 mice). (h) Percentages of cvPVHVgat neurons responding (Connected) and not responding (Not Connected) to photostimulation of the rDMHVgat input (n=15 cvPVHVgat recorded neurons from 5 mice). (i) Raster plot of IPSCs in a representative cvPVHVgat neuron with photostimulation of the rDMHVgat → cvPVHVgat input (bin duration: 50ms). (j) oIPSC amplitude following photostimulation of the rDMHVgat → cvPVHVgat input (filled markers, cells responding to photostimulation, n=14 neurons; open markers, cells not responding to photostimulation, n=1; mean and ± SEM of responding neurons from 5 mice). (k) A schematic map of 12 cvPVHVgat neurons (n=5 mice) that were recorded and found to receive input from DMHVgat neurons. (l) A photomicrograph showing four recorded GABAergic cvPVH neurons that responded to photostimulation of DMHVgat input (filled with biocytin from the recording pipette, indicated by arrowheads). DMHVgat fibers expressing ChR2-mCherry (in red) surrounded the cvPVHVgat neurons expressing GFP (in green). The neuron indicated by the magenta arrowhead is shown at higher magnification at the right, showing labeling, from top to bottom, for biocytin, GFP, mCherry, and merged. (m) Photostimulation trains (20Hz, train frequency; 60s, train duration and 10ms, pulse duration) inhibited the activity of the cvPVHVgat neurons (n=6 neurons from 2 mice; top) and this effect was blocked by bicuculline (20µM; n=2 from 2 mice; bottom). (n) oIPSCs in cvPVHVgat neurons recorded in the presence of TTX 1µM + 4-AP 200µM (n=6 neurons from 1 mouse) indicating monosynaptic connectivity. (o) oIPSC latency recorded in PVHCRH (black; n=4 neurons from 3 mice) and cvPVHVgat neurons (red; n=14 neurons from 5 mice) following photostimulation of the DMHVgat input. (p) oIPSC probability in PVHCRH (black; n=4 neurons from 3 mice) and cvPVHVgat neurons (red; n=14 neurons from 5 mice) following photostimulation of the DMHVgat input. (q-r) Photomicrograph of a representative rDMH injection with AAV-DIO-ChR2-mCherry (native signal) and density plots of injections in the rDMH (n= 8 mice, including experiments in a-e and f-n; illustrated on the left side of each section) following which only 23% of PVHCRH neurons showed oIPSCs. Reference scale bar: in l (left) = 50 µm and (right) = 20 µm; in q = 250 µm. Atlas levels correspond to Paxinos & Franklin Atlas .
Figure 8.
Figure 8.. GABAergic neurons in the rostral DMH disinhibit the PVHCRH neurons via GABAergic neurons in the cvPVH.
(a) To test the rDMHVgat → cvPVHVgat → PVHCRH circuit, we injected AAV-DIO-ChR2-mCherry into the rDMH of Vgat-ires-Cre::CRH-Venus mice (n=3 mice). Recordings were conducted in ipsilateral PVHCRH neurons while photostimulating rDMHVgat synaptic terminals (DMH is shown on the opposite side of the brain for ease of illustration). We tested the effects of single light pulses (10ms) and trains of optostimulation (10ms individual pulse duration; 5, 10, and 20Hz stimulation frequency; 60s train duration) on spontaneous IPSC (sIPSC) frequency in PVHCRH neurons. (b) Single light pulses did not produce oIPSCs in most PVHCRH neurons, but (c) trains of stimulation reduced the sIPSCs (C; top trace: light off; bottom trace: light on). (d) Change in sIPSC frequency following trains of photostimulation at 5, 10 and 20 Hz compared to sham stimulation (light off). Photostimulation at 5 and 10 Hz showed a trend toward reduction in sIPSC frequency that did not reach statistical significance (at 5 Hz: n=5 neurons, paired t-test, p=0.2772; at 10 Hz: n=8 neurons, paired t-test, p=0.0545; from 3 mice) whereas photostimulation at 20 Hz significantly reduced sIPSCs frequency (n=7 neurons from 3 mice, paired t-test, ****p<0.0001), without affecting their amplitude (n=7 neurons from 3 mice; paired t-test, p= 0.7593). (e) Mean cumulative distribution plots of the sIPSC inter- event intervals show that intervals between sIPSCs were longer (left; 0.1s bins; Kolmogorov-Smirnov test, ****p<0.0001; 20Hz vs light off) but that there was no change in sIPSC amplitude (right; 1pA bins; Kolmogorov-Smirnov test, p=0.1414; 20Hz vs light off) as compiled from 7 PVHCRH neurons from 3 mice (blue: 20Hz; black: light off; shaded areas: ± SEM). (f) To test the cvPVHVgat → PVHCRH input, we injected AAV-DIO-ChR2- mCherry into the cvPVH of Vgat-ires-Cre::CRH-Venus mice (n=3 mice). Recordings were conducted from ipsilateral PVHCRH neurons while photostimulating cvPVHVgat neurons and terminals. (g) Stimulation of the cvPVHVgat input evoked GABAA-mediated oIPSCs in PVHCRH neurons (Bicuculline, 20µM; n=4 neurons from 3 mice). (h) Raster plot of IPSCs in a representative PVHCRH neuron showed tight correlation with photostimulation of the cvPVHVgat → PVHCRH input (bin duration: 50ms). (i) TTX -resistant oIPSCs in cvPVHCRH neurons (n=6 neurons from 2 mice; TTX 1µM + 4-AP 250µM)) indicating monosynaptic connectivity of the cvPVHVgat → PVHCRH input. (j-k) A representative photomicrograph and density plots of injections of AAV-ChR2-mCherry in the cvPVH (k; n=3 mice) and (l) percentages of PVHCRH neurons responding to photostimulation of the cvPVHVgat input (Connected; n=14 PVHCRH recorded neurons from 3 mice). (m-n) Representative injection site and density plots of injections of AAV-ChR2-mCherry along the lateral margin of the PVH (pPVH) (n=4 mice) and (o) percentages of PVHCRH neurons responding (Connected) and not responding (Not Connected) to photostimulation of the GABAergic input from the lateral pPVH (n=39 neurons from 4 mice). (p) Amplitude (filled markers, cells responding to photostimulation, open markers, cells not responding to photostimulation; mean and ± SEM of responding neurons) and (q) latency of oIPSCs in PVHCRH neurons evoked by photostimulation of the cvPVH (black; n=14 neurons from 3 mice) and lateral PVH (red; n=39 neurons from 4 mice, mean and ± SEM). (r) oIPSC probability in PVHCRH neurons following photostimulation of the input from the cvPVHVgat (black; n=14 neurons from 4 mice) and lateral pPVHVgat neurons (red; n=39 neurons 4 mice). In all experiments we visualize only the native signal. Reference scale bar: in G = 50 µm; K and N = 100 µm. f, fornix, 3V, third ventricle. Atlas levels are from Paxinos & Franklin Atlas .****, p < 0.0001.

References

    1. Lightman S. L., Birnie M. T. & Conway-Campbell B. L. Dynamics of ACTH and Cortisol Secretion and Implications for Disease. Endocr. Rev. 41, bnaa002 (2020). - PMC - PubMed
    1. Focke C. M. B. & Iremonger K. J. Rhythmicity matters: Circadian and ultradian patterns of HPA axis activity. Mol. Cell. Endocrinol. 501, 110652 (2020). - PubMed
    1. Moore R. Y. & Eichler V. B. Loss of a circadian adrenal corticosterone rhythm following suprachiasmatic lesions in the rat. Brain Res. 42, 201–206 (1972). - PubMed
    1. Buijs R. M., Markman M., Nunes-Cardoso B., Hou Y. X. & Shinn S. Projections of the suprachiasmatic nucleus to stress-related areas in the rat hypothalamus: a light and electron microscopic study. J. Comp. Neurol. 335, 42–54 (1993). - PubMed
    1. Dai J., Swaab D. F. & Buijs R. M. Distribution of vasopressin and vasoactive intestinal polypeptide (VIP) fibers in the human hypothalamus with special emphasis on suprachiasmatic nucleus efferent projections. J. Comp. Neurol. 383, 397–414 (1997). - PubMed

Publication types

LinkOut - more resources