Comparative Study
. 2024 Nov 25;120(14):1713-1726.
doi: 10.1093/cvr/cvae154.

Cross-species single-cell RNA sequencing reveals divergent phenotypes and activation states of adaptive immunity in human carotid and experimental murine atherosclerosis

Affiliations
Comparative Study

Cross-species single-cell RNA sequencing reveals divergent phenotypes and activation states of adaptive immunity in human carotid and experimental murine atherosclerosis

Hauke Horstmann et al. Cardiovasc Res. .

Abstract

Aims: The distinct functions of immune cells in atherosclerosis have been mostly defined by pre-clinical mouse studies. Contrastingly, the immune cell composition of human atherosclerotic plaques and their contribution to disease progression are only poorly understood. It remains uncertain whether genetic animal models allow for valuable translational approaches.

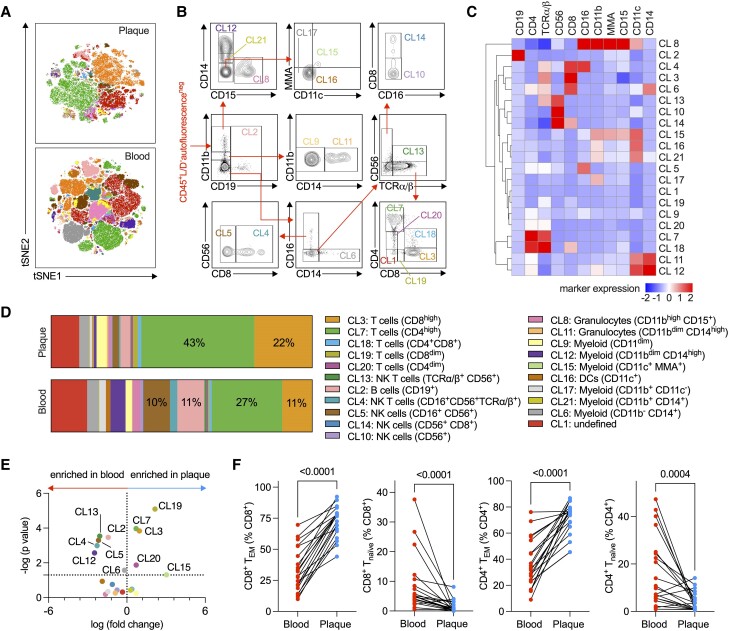
Methods and results: Single-cell RNA-sequencing (scRNA-seq) was performed to define the immune cell landscape in human carotid atherosclerotic plaques. The human immune cell repertoire demonstrated an unexpectedly high heterogeneity and was dominated by cells of the T-cell lineage, a finding confirmed by immunohistochemistry. Bioinformatical integration with 7 mouse scRNA-seq data sets from adventitial and atherosclerotic vascular tissue revealed a total of 51 identities of cell types and differentiation states, of which some were only poorly conserved between species and exclusively found in humans. Locations, frequencies, and transcriptional programmes of immune cells in mouse models did not resemble the immune cell landscape in human carotid atherosclerosis. In contrast to standard mouse models of atherosclerosis, human plaque leucocytes were dominated by several T-cell phenotypes with transcriptional hallmarks of T-cell activation and memory formation, T-cell receptor, and pro-inflammatory signalling. Only mice at the age of 22 months partially resembled the activated T-cell phenotype. In a validation cohort of 43 patients undergoing carotid endarterectomy, the abundance of activated immune cell subsets in the plaque defined by multi-colour flow cytometry associated with the extent of clinical atherosclerosis.

Conclusion: Integrative scRNA-seq reveals a substantial difference in the immune cell composition of murine and human carotid atherosclerosis-a finding that questions the translational value of standard mouse models for adaptive immune cell studies. Clinical associations suggest a specific role for T-cell driven (auto-)immunity in human plaque formation and instability.

Trial registration: ClinicalTrials.gov GSE245373.

Keywords: Atherosclerosis; Immunity; Leucocytes; Prediction; ScRNA-seq; Transcriptome.


Conflict of interest statement

Conflict of interest: none declared.

Figures

Graphical Abstract
Graphical Abstract
Figure 1
Figure 1
The leucocyte repertoire in human atherosclerotic plaques is dominated by T cells. (A) Eight human carotid plaques after surgical endarterectomy were enzymatically digested. Single, viable CD45+ leucocytes were isolated by flow sorting, subjected to droplet scRNA-seq, and analysed by dimensionality reduction algorithms. (B) Gating strategy for cell isolation. (C) The resulting 34 904 transcriptomes, pooled from 8 patients, were visualized by UMAP. Louvain-based cluster detection revealed 23 distinct clusters. (D) Genes encoding for T cells (CD3E, CD8A, CD4), B cells (CD19), and myeloid cells (LYZ, CD68) are displayed on the UMAP plot. Log-normalized gene expression per cell (ranging from 0 to 6.25) was binned (≤1, 1–3, ≥3) and colour coded. (E) Log-normalized RNA expression of selected marker genes in each of the 23 clusters displayed as violin plots. (F) Differentially expressed genes in each cluster in comparison with all other clusters were calculated using a Wilcoxon rank sum test with a multiplicity-adjusted significance cut-off of P < 0.05. Top 3 up-regulated genes with the highest log2(fold change) per cluster. (G, H) Cell-type percentages (% of all leucocyte transcriptomes per sample) displayed as a mean of eight patients and per patient. P1–P8 indicate the eight patients (n = 8). (H) The Y-axis indicates 100% of all leucocyte transcriptomes per sample. TEM, effector/memory T cells; TCM, central-memory T cells.
Figure 2
Figure 2
Integration of leucocyte transcriptomes from mouse and human atherosclerotic lesions. (A) Leucocyte single-cell transcriptomes from 15 individual mouse (n = 7) and human (n = 8) data sets generated by scRNA-seq were integrated with a VST and anchor-detection and anchor-integration algorithm (SEURAT V3). The resulting 43 291 single-cell transcriptomes were projected by UMAP. Louvain-based cluster detection revealed 51 distinct leucocyte clusters. (B) MCs were constructed by grouping these 51 leucocyte phenotypes in clusters of one haematopoietic lineage. (C) Distribution of the transcriptomes across species, genetic mouse models, and locations. Only samples meeting the criteria indicated in each plot are shown. (D) Expression of the indicated lineage marker genes were displayed on the UMAP plot. Log-normalized gene expression per cell (ranging from 0 to 5.5) was binned (≤1, 1–3, ≥3) and colour coded. (E) The assignment of proliferation states (S-, G1-, and G2/M-cell cycle phases) based on a proliferation score/cell quantified by gene module enrichment. (F) Absolute number of unique transcripts expressed per cell (‘genes’), the percentage of mitochondrial genes (of all expressed transcripts, ‘% mito’), S and G2M scores indicative of cell-cycle phase were displayed as violin plots per MC. (G) Differentially expressed genes in each cluster in comparison with all other clusters were calculated using a Wilcoxon rank sum test with a multiplicity-adjusted significance cut-off of P < 0.05. (H) Expression of established lineage marker genes across all MCs as log-normalized RNA counts on a violin plot. % mito, % mitochondrial genes of all genes.
Figure 3
Figure 3
Existence of species-conserved leucocyte IDs with distinct transcriptional programmes. Leucocyte single-cell transcriptomes from mice and humans generated by scRNA-seq were integrated bioinformatically. (A) Fractions of MCs across samples. (B) Hierarchical clustering of colour-coded MC abundance (% of sample/row) on a linear scale. (C) The fraction of genes differentially expressed (DE) between mouse and human in each MC was calculated using a Wilcoxon Rank Sum test. DE genes with a multiplicity-adjusted P-value >0.05 were classified as not DE. Genes with P < 0.05 and a positive log2(fold change) were considered significantly increased in human, and genes with P < 0.05 and a negative log2(fold change) were considered significantly increased in mouse. (D) Fraction of genes regulated only in one (colour coded, legend as in A) or in more MCs (gray). Values are displayed as % of all genes DE between mouse and human. (E) DE genes between human plaques and mouse atherosclerotic aortas. Sharing of DE genes between samples shown as Circos plot, where each purple line represents a shared gene. The outer circle represents the individual data sets. The inner circle represents the fraction of shared (dark orange) and unique DE genes (light orange) per data set. (F) Venn diagram with absolute numbers of unique and shared genes between atherosclerotic mouse data sets. Pathway analysis (Metascape) of DE genes in human plaques and mouse atherosclerotic aortas. Up-regulated genes in each data set [P < 0.05 and log2(fold change) > 1] served as input for pathway analysis in (G) CD4+ T cells, (H) macrophages, and (I) B cells. Significance of regulated pathways is displayed as colour-coded Z score. WD, western diet; chow, standard diet; HFD, high-fat diet; wt, wild type.
Figure 4
Figure 4
Human lesional T cells are characterized by an activated memory phenotype. (A) T cells from mouse (n = 7) and human (n = 8) data sets were used as input for integration, UMAP, and Louvain-based cluster detection, which revealed 15 distinct TCLs. Marker gene expression overlaid on the UMAP plot. Log-normalized gene expression per cell (ranging from 0 to 6.25) was binned (≤1, 1–3, ≥3) and colour coded. (B) TCLs were grouped into four MCs displayed on the lower right UMAP plot. (C) DE genes in each MC in comparison with all other MCs were calculated using a Wilcoxon rank sum test with a multiplicity-adjusted significance cut-off of P < 0.05. (D) Percentages of cells expressing combinations of CD4 and CD8 in selected TCLs. Positive expression for either CD4 or CD8 was defined as a raw gene count ≥1. (E) Percentages of the four MCs separated by species (expressed as % of all cells). (F) Expression of T-cell memory marker genes coding for CD62L (SELL), CD44, CCR7, IL7-receptor (IL7R), KLRB1, and the Treg transcription factor FoxP3 (FOXP3) displayed based on kernel density estimation by Nebulosa. The abundance of the indicated (G) memory TCLs and the (H) activated (act.) CD4+ and CD8+ TCLs expressed as % of all CD45+ in the individual input samples. (I) Enrichment Scores for distinct TH transcriptomes: positive values indicate an enrichment, while negative values indicate an under-representation of the module. Quantification of the Treg and TH17 module in each of the six CD4+ TCLs displayed as bar charts. (J) Expression of TH-marker genes for cytokines, transcription factors, and costimulatory molecules visualized in the six CD4+ TCLs as dot plot; fractions of CD4+ T cells (% all cells) with positive enrichment scores for Treg, TH1, and/or TH17 transcriptomes expressed in (K) Venn diagram or (L) bar graph. (G, H, K, L) Samples split in plaque-containing (P) and non-plaque-containing (NP) mouse samples. (G, H, K, L) Statistical significance by multiplicity-adjusted one-way ANOVA with Dunnett’s post hoc test. P-values are indicated in the figure.
Figure 5
Figure 5
Protein surface marker–defined immune cell landscape of human carotid plaques. Leucocytes were isolated from human carotid plaques after surgical dissection by enzymatic digestion and analysed by flow cytometry with a (A–E) pan-leucocyte (n = 43) or a (F) T-cell activation (n = 33) marker panel. Unsupervised cluster detection by tSNE of plaque leucocytes (n = 43) and blood (n = 19). (B) Gating strategy for the identification of tSNE-retrieved 21 distinct leucocyte clusters. Hierarchical column and row clustering of mean fluorescence intensity expressed as Z score. (C) Z scores for each value were calculated by subtracting the column mean and dividing by the column SD. The abundance of the 21 leucocyte clusters in carotid plaques and blood shown as the mean of each percentage (% of all leucocytes). (D) Cell-type annotation based on indicated marker expression. Volcano plot of the log2(fold change) of cluster percentages in blood vs. plaque (n = 21). (E) Significances were calculated by an unadjusted Wilcoxon-matched pairs signed rank test. Paired percentages of T-cell activation states in blood vs. plaque from the same patient (n = 21). (F) Statistical significance was calculated by a Wilcoxon-matched pairs signed rank test. Numeric, unadjusted P-values are indicated in the figure. MMA, mature-macrophage antigen; CL, cluster according to the nomenclature in D.
Figure 6
Figure 6
The abundance of carotid plaque leucocytes associates with clinical complications and generalized atherosclerotic disease. Leucocytes from human carotid plaques isolated by enzymatic digestion and paired blood samples were analysed by flow cytometry with a pan-leucocyte or a T-cell activation marker panel. (B, D) Individual regulation or (A, C) volcano plots of the log2(fold change) of cluster abundance in patients with (A, B) an ischaemic cerebral event 6 months prior to surgery (I.E.) and no ischaemic cerebral event (no I.E.) or in patients with (C, D) simultaneous CAD. The number of plaque samples included for I.E. vs. no I.E. analysed with pan-leucocyte panel: I.E. (n = 18), no I.E. (n = 25); and T-cell activation panel: I.E. (n = 20), no I.E. (n = 13). The number of plaque samples included for CAD vs. no CAD analysed with pan-leucocyte panel: CAD (n = 27), no CAD (n = 16); and with T-cell activation panel: CAD (n = 11), no CAD (n = 22). Statistical significance was assessed by Mann–Whitney U test. (B, D) Numeric, unadjusted P-values are indicated in the figure. Bar graphs show the mean. CL, cluster according to the nomenclature in Figure 5D.

References

    1. Wolf D, Ley K. Immunity and inflammation in atherosclerosis. Circ Res 2019;124:315–327. - PMC - PubMed
    1. Marchini T, Malchow S, Caceres L, El Rabih AAH, Hansen S, Mwinyella T, Spiga L, Piepenburg S, Horstmann H, Olawale T, Li X, Mitre LS, Gissler MC, Bugger H, Zirlik A, Heidt T, Hilgendorf I, Stachon P, von Zur Muehlen C, Bode C, Wolf D. Circulating autoantibodies recognizing immunodominant epitopes from human apolipoprotein B associate with cardiometabolic risk factors, but not with atherosclerotic disease. Front Cardiovasc Med 2022;9:826729. - PMC - PubMed
    1. Wolf D, Gerhardt T, Winkels H, Michel NA, Pramod AB, Ghosheh Y, Brunel S, Buscher K, Miller J, McArdle S, Baas L, Kobiyama K, Vassallo M, Ehinger E, Dileepan T, Ali A, Schell M, Mikulski Z, Sidler D, Kimura T, Sheng X, Horstmann H, Hansen S, Mitre LS, Stachon P, Hilgendorf I, Gaddis DE, Hedrick C, Benedict CA, Peters B, Zirlik A, Sette A, Ley K. Pathogenic autoimmunity in atherosclerosis evolves from initially protective apolipoprotein B100-reactive CD4(+) T-regulatory cells. Circulation 2020;142:1279–1293. - PMC - PubMed
    1. de Winther MPJ, Back M, Evans P, Gomez D, Goncalves I, Jorgensen HF, Koenen RR, Lutgens E, Norata GD, Osto E, Dib L, Simons M, Stellos K, Yla-Herttuala S, Winkels H, Bochaton-Piallat ML, Monaco C. Translational opportunities of single-cell biology in atherosclerosis. Eur Heart J 2023;44:1216–1230. - PMC - PubMed
    1. Leistner DM, Krankel N, Meteva D, Abdelwahed YS, Seppelt C, Stahli BE, Rai H, Skurk C, Lauten A, Mochmann HC, Frohlich G, Rauch-Krohnert U, Flores E, Riedel M, Sieronski L, Kia S, Strassler E, Haghikia A, Dirks F, Steiner JK, Mueller DN, Volk HD, Klotsche J, Joner M, Libby P, Landmesser U. Differential immunological signature at the culprit site distinguishes acute coronary syndrome with intact from acute coronary syndrome with ruptured fibrous cap: results from the prospective translational OPTICO-ACS study. Eur Heart J 2020;41:3549–3560. - PMC - PubMed

Publication types

MeSH terms

Associated data