

External validation and comparison of six cardiovascular risk prediction models in the Prospective Urban Rural Epidemiology (PURE)-Colombia study
- PMID: 39041366
- PMCID: PMC12066169
- DOI: 10.1093/eurjpc/zwae242
External validation and comparison of six cardiovascular risk prediction models in the Prospective Urban Rural Epidemiology (PURE)-Colombia study
Abstract
Aims: To externally validate the SCORE2, AHA/ACC pooled cohort equation (PCE), Framingham Risk Score (FRS), Non-Laboratory INTERHEART Risk Score (NL-IHRS), Globorisk-LAC, and WHO prediction models and compare their discrimination and calibration capacity.
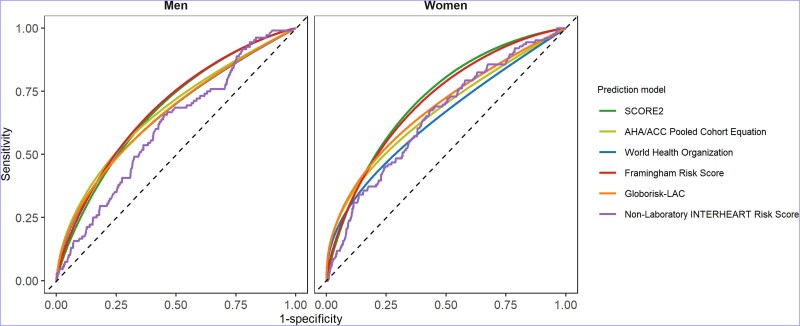
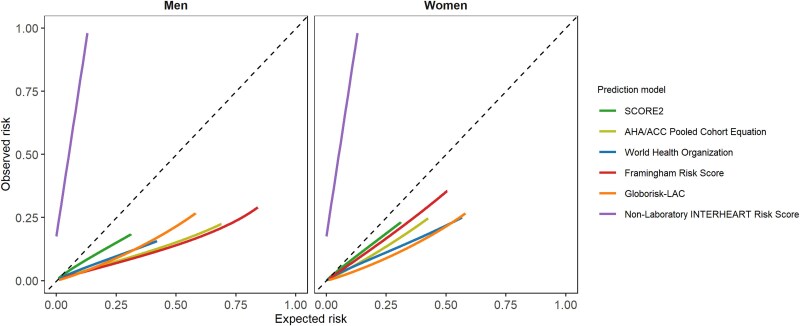
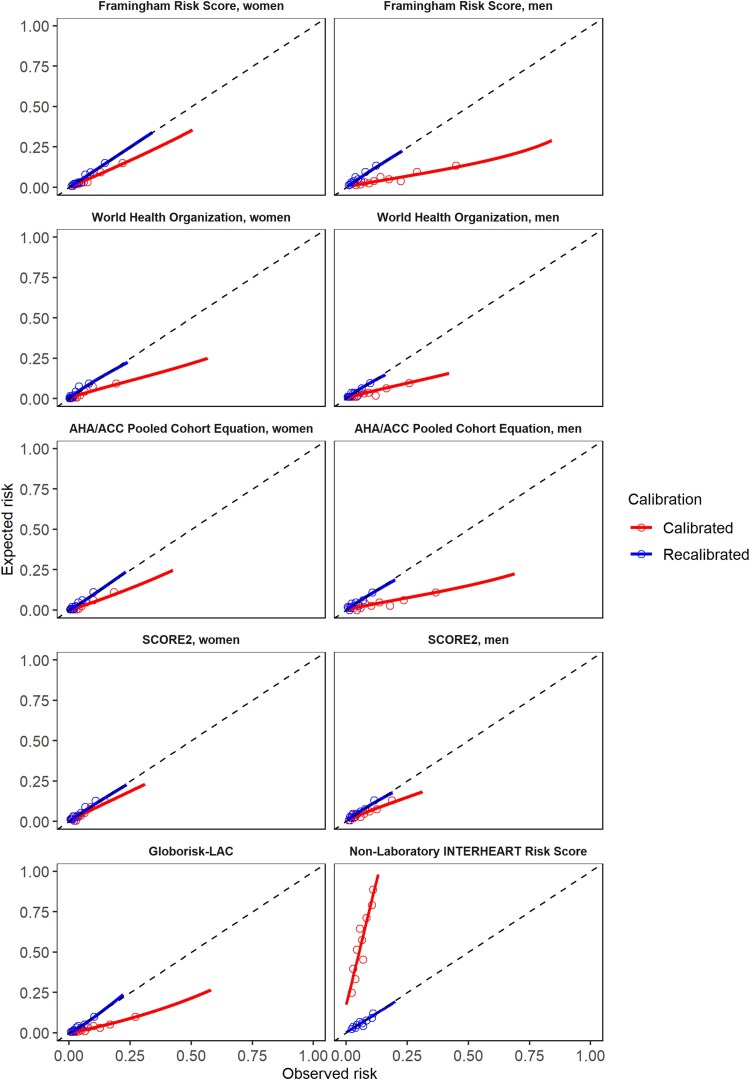
Methods and results: Validation in individuals aged 40-69 years with at least 10 years of follow-up and without baseline use of statins or cardiovascular diseases from the Prospective Urban Rural Epidemiology (PURE)-Colombia prospective cohort study. For discrimination, the C-statistic, and receiver operating characteristic curves with the integrated area under the curve (AUCi) were used and compared. For calibration, the smoothed time-to-event method was used, choosing a recalibration factor based on the integrated calibration index (ICI). In the NL-IHRS, linear regressions were used. In 3802 participants (59.1% women), baseline risk ranged from 4.8% (SCORE2 women) to 55.7% (NL-IHRS). After a mean follow-up of 13.2 years, 234 events were reported (4.8 cases per 1000 person-years). The C-statistic ranged between 0.637 (0.601-0.672) in NL-IHRS and 0.767 (0.657-0.877) in AHA/ACC PCE. Discrimination was similar between AUCi. In women, higher over-prediction was observed in the Globorisk-LAC (61%) and WHO (59%). In men, higher over-prediction was observed in FRS (72%) and AHA/ACC PCE (71%). Overestimations were corrected after multiplying by a factor derived from the ICI.
Conclusion: Six prediction models had a similar discrimination capacity, supporting their use after multiplying by a correction factor. If blood tests are unavailable, NL-IHRS is a reasonable option. Our results suggest that these models could be used in other countries of Latin America after correcting the overestimations with a multiplying factor.
Keywords: Cardiovascular disease; Latin-American; Prediction; Primary prevention; Scores; Validation.
Plain language summary
Detecting people at high risk of cardiovascular disease (CVD) and implementing preventive interventions in this population are key strategies in the primary prevention of CVD. Recently, new risk calculation tools have been developed, but before their application and routine use in populations different from those where it was developed, it is necessary to validate them. The recommendations for predicting cardiovascular risk in Colombia’s guidelines are based on studies with noteworthy limitations. This study involving 3802 healthy individuals in Colombia supports the recommendation of using these prediction models. The estimation result should be multiplied by a correction factor, because most of the prediction models overestimate cardiovascular risk. For example, the correction factors suggested in women for AHA/ACC PCE and SCORE2 are 0.54 and 0.75, respectively. In men, the correction factors suggested in AHA/ACC PCE and SCORE2 are 0.28 and 0.61, respectively. Therefore, the present study with a contemporary population provides additional evidence to update these recommendations in Colombia and perhaps in Latin America.
© The Author(s) 2024. Published by Oxford University Press on behalf of the European Society of Cardiology. All rights reserved. For commercial re-use, please contact reprints@oup.com for reprints and translation rights for reprints. All other permissions can be obtained through our RightsLink service via the Permissions link on the article page on our site—for further information please contact journals.permissions@oup.com.
Conflict of interest statement
Conflict of interest: none declared.
Figures
Comment in
-
Cardiovascular risk estimation: can a risk prediction model derived in one country be used in another?Eur J Prev Cardiol. 2025 May 12;32(7):573-574. doi: 10.1093/eurjpc/zwae286. Eur J Prev Cardiol. 2025. PMID: 39252630 No abstract available.
References
-
- Visseren FLJ, Mach F, Smulders YM, Carballo D, Koskinas KC, Back M, et al. 2021 ESC guidelines on cardiovascular disease prevention in clinical practice. Eur J Prev Cardiol 2022;29:5–115. - PubMed
-
- Arnett DK, Blumenthal RS, Albert MA, Buroker AB, Goldberger ZD, Hahn EJ, et al. 2019 ACC/AHA guideline on the primary prevention of cardiovascular disease: a report of the American College of Cardiology/American Heart Association task force on clinical practice guidelines. Circulation 2019;140:e596–e646. - PMC - PubMed
Publication types
MeSH terms
Grants and funding
LinkOut - more resources
Full Text Sources
Medical
