. 2024 Aug 27;52(15):9028-9048.
doi: 10.1093/nar/gkae630.

Ribosomal protein RPL39L is an efficiency factor in the cotranslational folding of a subset of proteins with alpha helical domains

Affiliations

Ribosomal protein RPL39L is an efficiency factor in the cotranslational folding of a subset of proteins with alpha helical domains

Arka Banerjee et al. Nucleic Acids Res. .

Abstract

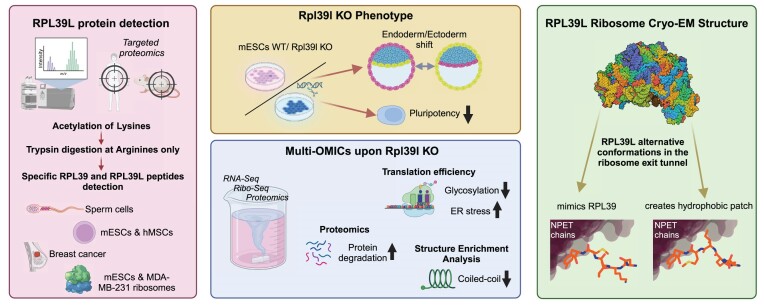
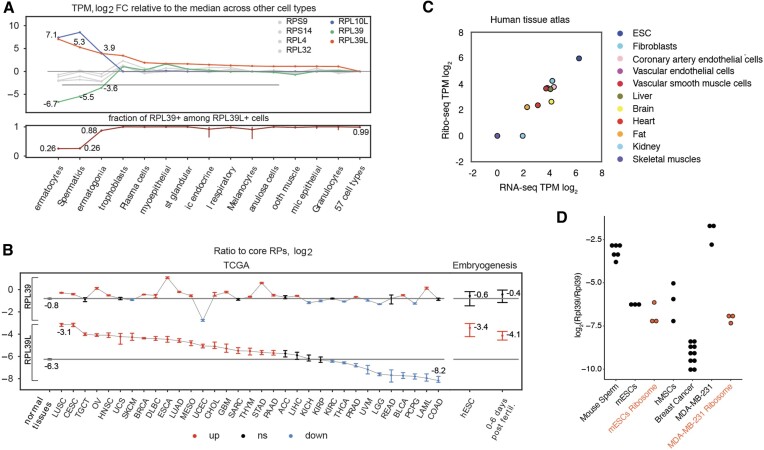
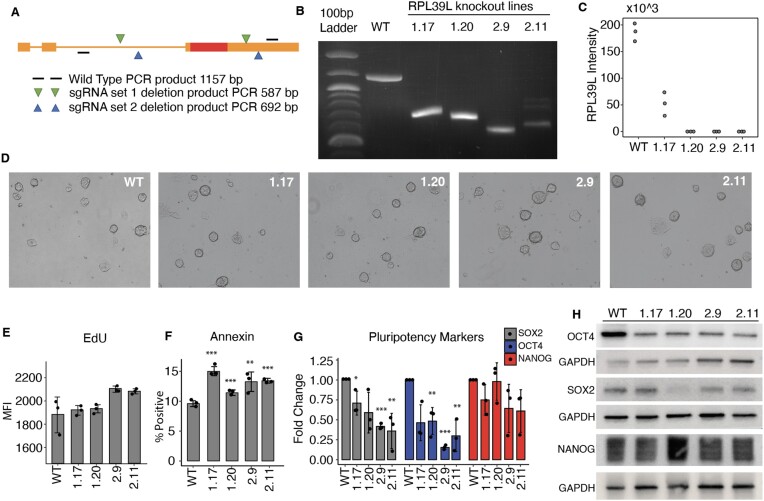
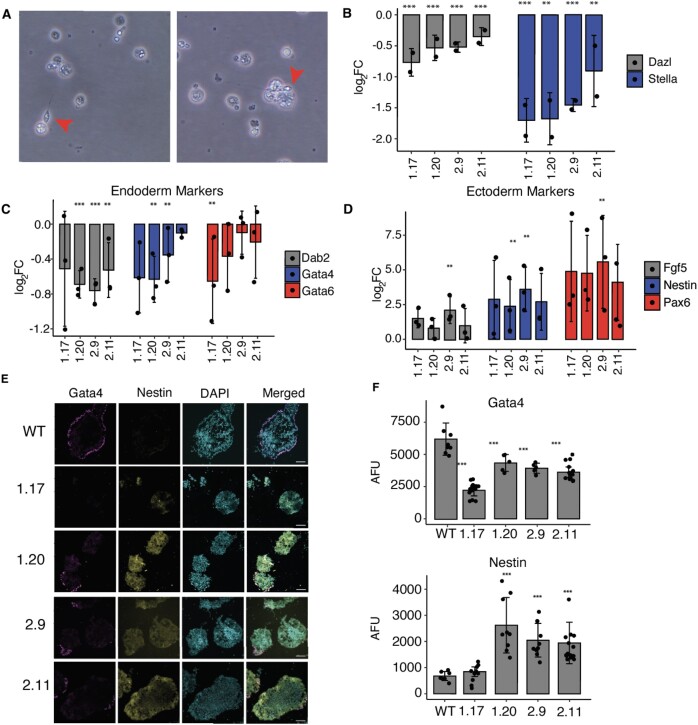
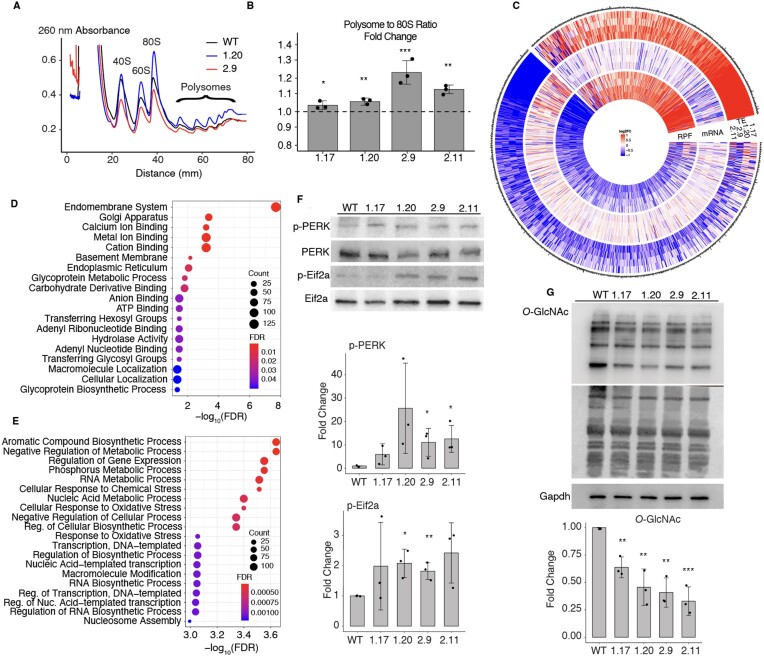
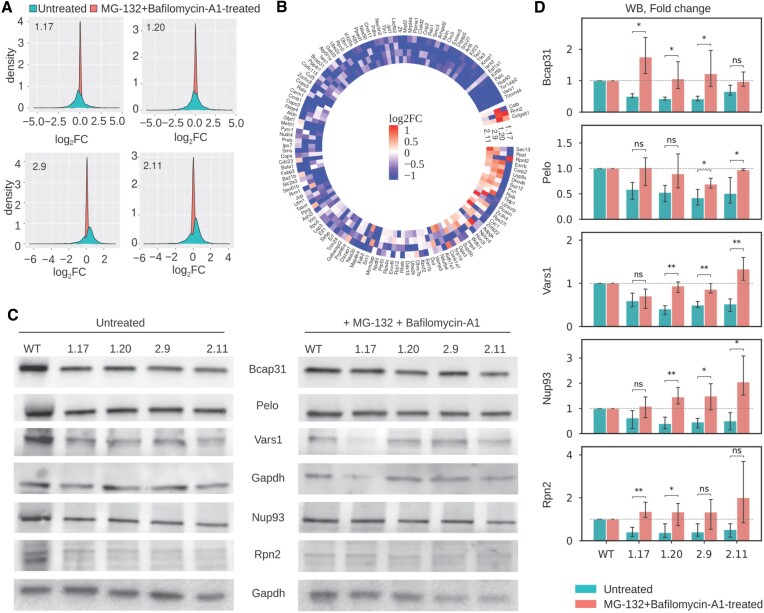
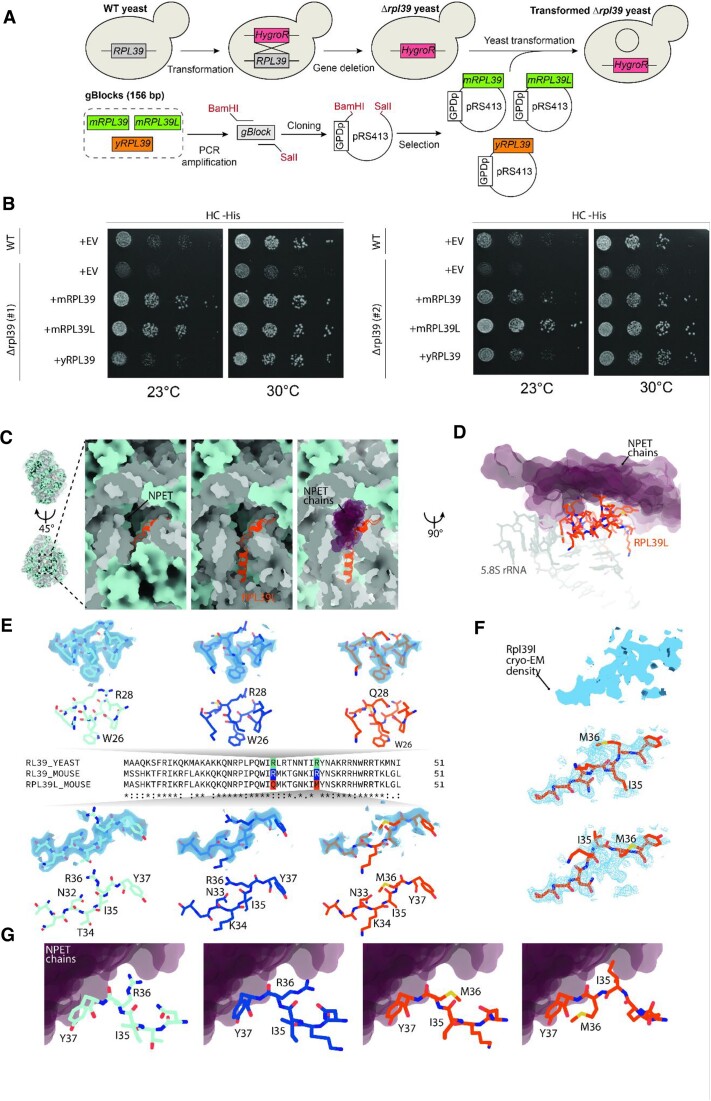
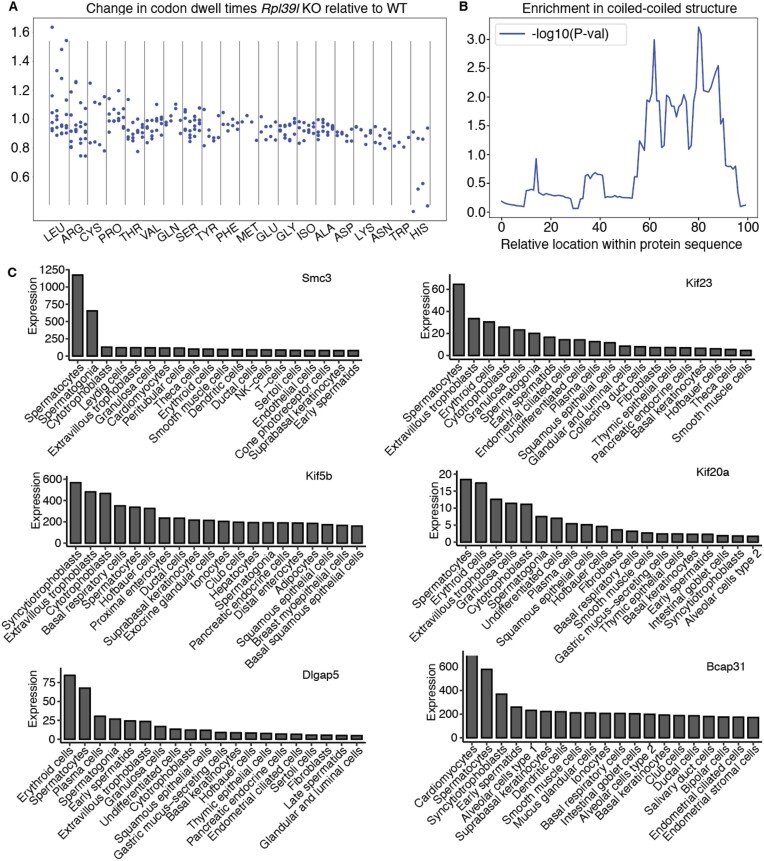
Increasingly many studies reveal how ribosome composition can be tuned to optimally translate the transcriptome of individual cell types. In this study, we investigated the expression pattern, structure within the ribosome and effect on protein synthesis of the ribosomal protein paralog 39L (RPL39L). With a novel mass spectrometric approach we revealed the expression of RPL39L protein beyond mouse germ cells, in human pluripotent cells, cancer cell lines and tissue samples. We generated RPL39L knock-out mouse embryonic stem cell (mESC) lines and demonstrated that RPL39L impacts the dynamics of translation, to support the pluripotency and differentiation, spontaneous and along the germ cell lineage. Most differences in protein abundance between WT and RPL39L KO lines were explained by widespread autophagy. By CryoEM analysis of purified RPL39 and RPL39L-containing ribosomes we found that, unlike RPL39, RPL39L has two distinct conformations in the exposed segment of the nascent peptide exit tunnel, creating a distinct hydrophobic patch that has been predicted to support the efficient co-translational folding of alpha helices. Our study shows that ribosomal protein paralogs provide switchable modular components that can tune translation to the protein production needs of individual cell types.


Figures

Graphical Abstract
Graphical Abstract
Figure 1.
Figure 1.
RPL39L expression across cell types. (A) Top: HPA-provided normalized gene expression values (transcript-per-million, TPM) were used to identify the 14 cell types with highest RPL39L expression. The log2 fold change in each of these cell types relative to the median across all other 57 cell types in HPA is shown for RPL39L (orange), RPL39 (green), RPL10L (blue) genes and 4 core RPs (gray). Bottom: the proportion of RPL39L+ cells that also contained RPL39-derived reads in single cells of the types shown in the top panel. (B) Ratio of RPL39 and RPL39L to core RP expression (log2) in bulk RNA-seq samples of primary tumors from TCGA (https://www.cancer.gov/tcga/) (left panel) as well as human pre-implantation embryos and cultured embryonic stem cells (17) (right panel). See https://gdc.cancer.gov/resources-tcga-users/tcga-code-tables/tcga-study-abbreviations for TCGA cancer-type abbreviations. Black horizontal lines show the median values of these ratios in adult normal tissue samples from TCGA. Statistically significant (two-sided Wilcoxon test, Benjamini–Hochberg FDR < 0.05) positive and negative deviations from the medians are shown in orange and blue, respectively. For each category, the 95% confidence interval over all samples (for bulk data from TCGA) or all cells (for single-cell data) is shown. Categories for which the ratios were not significantly different from the median of the normal samples are shown in black. (C) Ribo-seq vs. RNA-seq level expression of RPL39L in samples from the human tissue atlas (extracted from the supplementary material of (63)). (D) Quantification of RPL39L/RPL39 protein ratio in various cellular systems (mouse sperm cells −6 samples, breast cancer cell line MDA-MB-231, bone marrow-derived mesenchymal stem cells (hMSC) and E14 mouse embryonic stem cells (mESC) −3 independent samples, breast cancer tissues −10 samples) using reference peptides. Similar quantification from purified ribosomes of E14 and MDA-MB-231 cells is also shown.
Figure 2.
Figure 2.
Characterization of RPL39L KO mESCs. (A) Schema of sgRNA design. Two distinct pairs of sgRNAs (in green and blue) were designed to target flanking regions of the RPL39L coding sequence (CDS, shown as a red box). Primers (black lines) from further upstream and downstream in the RPL39L locus were used for amplification, and the expected sizes of the PCR products are indicated for both the WT locus (1157 nts) and the edited loci (587 and 692 nts, respectively, for the sgRNA sets 1 and 2). (B) PCR products from the WT E14 cells and the 4 independent clones, 1.17 and 1.20 generated with sgRNA set #1 and2.9 and 2.11 generated with sgRNA set #2. (C) Expression of RPL39L in individual clones determined with targeted proteomics (n = 3 for each clone). (D) Representative bright field images of colonies from all analyzed clones. (E) Results of the ethynyldeoxyuridine (EdU, thymidine analog) incorporation assay. EdU-treated cells were fixed, permeabilized and the AF488 fluorophore was linked to the EdU in the replicated DNA by click-chemistry. The label intensity was measured by FACS (Mean fluorescence intensity, MFI). (F) Results of the annexin binding assay. Cells were incubated with AF488-conjugated Annexin V and counterstained with phycoerythrin (PE). The proportion of AF488+PE (apoptotic cells) relative to the parent cell population was determined by FACS. (G) RT-qPCR of the pluripotency factors SOX2, OCT4 and NANOG. Values are 2−ΔΔCt, relative to RRM2 (internal reference) and to WT. (H) Representative Western blots of pluripotency markers SOX2, OCT4 and NANOG in the RPL39L KO lines and WT relative to GAPDH. In panels F and G, *, ** and *** correspond to P-values <0.05, <0.01 and < 0.001, respectively in the two tailed t-test comparing KO lines with WT.
Figure 3.
Figure 3.
RPL39L KO leads to differentiation defects in E14 mESCs. (A) Representative bright field images showing the spermatogenic differentiation of WT E14 cells. Red arrows indicate spermatocyte-like cells. (B) qRT-PCR assays of DAZL (late) and STELLA (early) sperm cell markers (33) (y-axis, log2 fold-change) in differentiating (4 days in RA-containing medium) populations of KO clones (x-axis) relative to WT. (C) qRT-PCR of extraembryonic endoderm markers (DAB2, GATA4, GATA6) (65) in RPL39L KO lines relative to WT. (D) Similar for FGF5, NESTIN, and PAX6 ectoderm markers (65). (E) Immunofluorescence staining of embryoid bodies subjected to spontaneous differentiation: GATA4 was used as endoderm marker, NESTIN as ectoderm marker and DAPI to delineate the nucleus. (F) Quantification of GATA4 and NESTIN expression in immunofluorescence images. AFU - arbitrary fluorescence units normalized to DAPI. In all panels, *, ** and *** correspond to P-values <0.05, <0.01 and < 0.001, respectively in the two tailed t-test comparing KO lines with WT.
Figure 4.
Figure 4.
Impact of RPL39L KO on mRNA translation. (A) Example polysome profiles from the WT, 1.20 and 2.9 RPL39L KO E14 cell lines. (B) Ratio of the area under the profile corresponding to polysomes vs. monosomes (80S), in polysome profiles obtained from the KO clones. Fold-changes were calculated relative to the median ratio in the corresponding WT (dashed line at 1, n = 3 for all cell lines). (C) Log2 fold-changes in the translation efficiency (TE), mRNA level and the number of ribosome protected fragments (RPF) for specific genes, in mutant clones relative to WT E14 cells (n = 3 for each clone). Shown are all genes with a significant change in TE in at least one of the RPL39L KO clones. Values are capped at −1 and 1. (DE) Gene Ontology analysis of mRNAs with reduced (D) and increased (E) TE in RPL39L KO clones. (F) Representative western blots and corresponding quantification (from n = 3 for each clone) of UPR markers PERK (phospho-Thr980) and EIF2A (phospho-Ser51). Intensities of phosphorylated proteins were normalized by the respective unphosphorylated forms and are relative to WT, for which the relative phosphorylation level was set to 1. (G) Representative western blot and corresponding quantification (from n = 3 for each clone) showing lower global O-GlcNAc modification of proteins in RPL39L KO lines when compared to the WT. Values are relative to GAPDH (loading control) and WT (level set to 1). In all panels, *, ** and *** correspond to P-values <0.05, <0.01 and < 0.001, respectively in the two tailed t-test comparing KO lines with WT.
Figure 5.
Figure 5.
RPL39L KO clones exhibit enhanced degradation of specific classes of proteins. (A) Distribution of log2 fold changes in protein levels between untreated (blue) or MG-132 + Bafilomycin-A1-treated RPL39L KO and WT cells. Each panel corresponds to one KO clone. Three biological replicates for each condition were used to calculate average protein abundance levels and respective fold-changes relative to WT. (B) Heatmap of protein-level Δlog2 fold changes in KO cells relative to WT between untreated and treated cells. Included are all proteins with a significant downregulation in at least one of the untreated KO clones. (C) Representative western blot results showing the expression of a subset of proteins from (B) in untreated (left) and MG-132 + Bafilomycin-A1-treated cells (right). (D) Quantification of western blots as shown in (B), from three replicates for each protein and each condition.
Figure 6.
Figure 6.
RPL39L introduces a hydrophobic patch in the NPET. (A) Scheme of yeast RPL39 KO and insertion of mouse RPL39 and mouse RPL39L. (B) The RPL39 KO causes growth defects in yeast upon environmental challenges like growth at 23 degrees Celsius in HC-His media. Expression of mouse RPL39 or RPL39L rescues these phenotypes. +EV are cells transformed with an empty vector as control. The experiments were carried out in two independent RPL39 knockout clones (#1 and #2). (C) RPL39L (cartoon representation, orange) shown in context of the large ribosomal subunit (refined atomic model of rpl39Δ-MmRpl39l; rRNAs are shown in gray, proteins are shown in pale blue surface representation). RPL39L is embedded inside the 60S subunit, adjacent to the exit of the NPET. Part of the 5.8S rRNA and ribosomal proteins have been removed for clarity on the center and right panel. Nascent protein chains and regulatory protein complexes pass the NPET in direct proximity to RPL39L as evident from aligned structures containing NPET-bound chains (nascent chains and regulatory proteins, PDB-IDs: 6M62, 7OBR, 7TM3, 7TUT, 7QWQ, 7QWS, shown as purple semi-transparent surfaces). (D) Side view of RPL39L (orange) and the surrounding 5.8S rRNA (gray) in direct contact with the NPET-facing region of RPL39L. The region containing Q28 and M36 is located directly adjacent to protein chains localized in the lumen of the NPET in structures containing nascent chains or tunnel-bound regulatory complexes (protein chain models shown as purple semi-transparent surfaces). (E) Comparison of the atomic model in the immediate surrounding of R/Q28 and R/M36 in WT yeast RPL39 (cyan), mouse RPL39 (dark blue), and mouse RPL39L (orange), shown in stick representation. The experimental cryo-EM density (semi-transparent surface, light blue) is shown superimposed on the refined atomic model. Maps around R28 are shown at a threshold of 6.5σ (yRPL39), 5.5σ (mRPL39), and 4.25σ (mRPL39L), while maps around R/M36 at a threshold of 5σ (yRPL39), 4σ (mRPL39), and 3.75σ (mRPL39L). Experimental cryo-EM density around M36 in mRPL39L is substantially weaker than the density observed either in yeast or mouse RPL39, due to increased conformational heterogeneity. (F) At a lower threshold, an alternative conformation is apparent in the experimental cryo-EM density (blue surface) of the region around M36 in mRPL39L, as RPL39L adopts two alternative conformations that differ substantially relative to the protein backbone and side chains. (G) In both WT yRPL39 (atomic model, stick representation, cyan) and mRPL39 (dark blue), the side chain of R36 faces the lumen of the NPET, potentially in direct contact with the protein chains inside the NPET (fitted chains of nascent protein and regulatory complexes, shown as purple semi-transparent surfaces). In mRPL39L, side chains of M36 and I35 hydrophobic residues are facing the NPET chains, forming a hydrophobic spot inside the NPET.
Figure 7.
Figure 7.
Altered codon dwell times in RPL39l KO relative to WT clones. (A) Change in codon dwell time in the RPL39L KO clones relative to WT, conditioned on the presence of leucine at position +31 in the NPET. For each amino acid the 4 columns correspond to the 4 independent clones, shown always in the same order: 1_17, 1_20, 2_9 and 2_11. (B) Location-dependent P-values in the Mann–Whitney U test comparing the fractions of amino acids in coiled-coil structures within 100 length bins in presumed Rpl39l (39) targets and non-target proteins (4720). (C) Expression level (TPM) of mRNAs encoding proteins with coiled-coil domains that are destabilized in the RPL39L KO clones. Shown are values obtained by scRNA-seq of various cell types in the Human Protein Atlas. The gene names are indicated at the top of each panel and the cell types are labeled on the x-axis.

References

    1. Wong Q.W.-L., Li J., Ng S.R., Lim S.G., Yang H., Vardy L.A.. RPL39L is an example of a recently evolved ribosomal protein paralog that shows highly specific tissue expression patterns and is upregulated in ESCs and HCC tumors. RNA Biol. 2014; 11:33–41. - PMC - PubMed
    1. Guimaraes J.C., Zavolan M.. Patterns of ribosomal protein expression specify normal and malignant human cells. Genome Biol. 2016; 17:236. - PMC - PubMed
    1. Xiong X., Zhao Y., He H., Sun Y.. Ribosomal protein S27-like and S27 interplay with p53-MDM2 axis as a target, a substrate and a regulator. Oncogene. 2011; 30:1798–1811. - PMC - PubMed
    1. Zhang Y., O’Leary M.N., Peri S., Wang M., Zha J., Melov S., Kappes D.J., Feng Q., Rhodes J., Amieux P.S.et al. .. Ribosomal proteins Rpl22 and Rpl22l1 control morphogenesis by regulating pre-mRNA splicing. Cell Rep. 2017; 18:545–556. - PMC - PubMed
    1. Chaillou T., Zhang X., McCarthy J.J.. Expression of muscle-specific ribosomal protein L3-like impairs myotube growth. J. Cell. Physiol. 2016; 231:1894–1902. - PMC - PubMed

Substances

LinkOut - more resources