. 2024 Jul 23;134(16):e173835.
doi: 10.1172/JCI173835.

Intercellular interaction between FAP+ fibroblasts and CD150+ inflammatory monocytes mediates fibrostenosis in Crohn's disease

Affiliations

Intercellular interaction between FAP+ fibroblasts and CD150+ inflammatory monocytes mediates fibrostenosis in Crohn's disease

Bo-Jun Ke et al. J Clin Invest. .

Abstract

Crohn's disease (CD) is marked by recurring intestinal inflammation and tissue injury, often resulting in fibrostenosis and bowel obstruction, necessitating surgical intervention with high recurrence rates. To elucidate the mechanisms underlying fibrostenosis in CD, we analyzed the transcriptome of cells isolated from the transmural ileum of patients with CD, including a trio of lesions from each patient: non-affected, inflamed, and stenotic ileum samples, and compared them with samples from patients without CD. Our computational analysis revealed that profibrotic signals from a subset of monocyte-derived cells expressing CD150 induced a disease-specific fibroblast population, resulting in chronic inflammation and tissue fibrosis. The transcription factor TWIST1 was identified as a key modulator of fibroblast activation and extracellular matrix (ECM) deposition. Genetic and pharmacological inhibition of TWIST1 prevents fibroblast activation, reducing ECM production and collagen deposition. Our findings suggest that the myeloid-stromal axis may offer a promising therapeutic target to prevent fibrostenosis in CD.

Keywords: Fibrosis; Gastroenterology; Inflammation; Inflammatory bowel disease; Monocytes.


Figures

Figure 1
Figure 1. Single-cell profiling of fibrostenotic ileum from CD and control ileum from CRC.
(A) Experimental workflow for scRNA-Seq of ileum using the 10x Genomics Chromium platform and further analyses and validations in this study. (B) Uniform manifold approximation and projection (UMAP) embedding showing ileal single-cell transcriptomes from 169,547 cells from 10 CD patients with a trio of lesions (proximal, inflamed, and stenotic) and 5 CRC control ilea, depicting cell compartments. ILCs, innate lymphoid cells. (C) UMAP in B split by disease segments. (D) Heatmap depicting relative expression of distinguishing marker genes in each cell compartment.
Figure 2
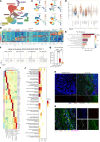
Figure 2. Heterogeneity of stromal cells in fibrostenotic CD.
(A) UMAP representation of reclustered mesenchymal cells across different lesions of the terminal ileum. (B) Heatmap showing relative expression of top marker genes in each subset. (C) Cell subset composition across different lesions of the terminal ileum. (D) Bar plot showing gene set module score for core matrisome collagen genes in each stromal cell subset in different lesions. Horizontal lines indicate medians of respective lesions. (E) Enrichment analysis for Reactome biological pathways in FAP+ fibroblasts (log fold change > 0.5; FDR < 0.1). (F and G) Flow cytometry gating strategy for fibroblast subsets (F) and plot of FAP expression in pan-fibroblasts (7-AADCD45CD31CD326PDPN+THY1+) (G) in different lesions of terminal ileum from 19 CD patients and 8 CRC control ilea. Data are shown as box-and-whisker plots. Statistically significant differences were determined using a 1-way ANOVA test corrected with Tukey’s multiple-comparison test (**P <0.01, ***P <0.005, ****P <0.001). (H) Immunofluorescence staining for PDPN, ADAMDEC1 (indicated by white arrowheads), CD34, and FAP expression in healthy ileum and CD diseased ileum. CD34 and FAP colocalization is indicated by orange arrowheads (scale bars: 200 μm). (I) Heatmap showing relative transcription factor activity in each stromal cell subset based on single-cell regulatory network inference and clustering (SCENIC) analysis. (J) Heatmap showing selected terms after functional enrichment analysis of top 5 regulons using GO terms and core ECM gene set from MatrisomeDB (*statistically significant terms after 1-sided Fisher’s exact test and multiple correction by Benjamini-Hochberg method). (K) Immunofluorescence staining for TWIST1 and CD34 expression in FAP+ fibroblasts in CD diseased ileum (indicated by arrowheads; scale bar: 50 μm).
Figure 3
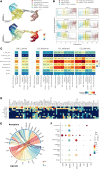
Figure 3. Trajectory analysis of fibroblast subset and stromal-immune interactions.
(A) Pseudotime trajectory projected onto a UMAP of selected fibroblast subsets. (B) Normalized expression levels of selected markers visualized along the pseudotime. (C) Heatmap showing number of interactions (ligand-receptor pairs) between cell compartments and mesenchymal subsets. (D) Niche signaling driving FAP+ fibroblast differentiation, predicted by NicheNet; regulatory potential of each target gene in columns by ligands in rows. (E) Circos plot depicting links between predicted ligands by NicheNet and their receptors. (F) Dot plot showing expression of NicheNet-predicted ligands in all cell compartments.
Figure 4
Figure 4. Heterogeneity of myeloid cells in fibrostenotic CD.
(A and B) UMAP representation of reclustered myeloid cells (A) and cell subset composition (B) across different lesions of the terminal ileum. (C) Heatmap showing the expression of the top marker genes of each myeloid subset. (D) Dot plot showing NicheNet-predicted ligands expressed by myeloid cell subsets. (E) Selected GO terms significantly enriched in myeloid cell subsets. (F) CellPhoneDB dot plot showing ligand-receptor interactions between FAP+ fibroblasts and inflammatory monocytes or neutrophils. First and second interacting molecules correspond to first and second cell types on the y axis, respectively. Black circles indicate significant interactions. (G and H) Flow cytometry gating strategy for myeloid cell subpopulations (G) and plot of CD150 (SLAMF1) expression (H) in CD14+ myeloid cells (7-AADCD45+CD3CD19CD56HLA-DR+/–) in different lesions of terminal ileum from 19 CD patients and 8 CRC control ilea. Data are shown as box-and-whisker plots. Statistically significant differences were determined using a 1-way ANOVA test corrected with Tukey’s multiple-comparison test (**P <0.01, ***P <0.005, ****P <0.001). (I) Immunofluorescence staining for CD68, CD150, and FAP expression in healthy ileum and CD diseased ileum. Original image composed of stitched ×25 images. Scale bars: 200 μm in top panels, 100 μm in bottom panels. White arrowheads indicate the spot of colocalization.
Figure 5
Figure 5. Spatial colocalization of FAP+ fibroblasts and inflammatory monocytes in inflamed and stenotic ileum of fibrostenotic CD patients.
(A) UMAP representation of cell type across different lesions of the terminal ileum from 3 fibrostenotic CD patients. (B) Spatial map showing the location of cell types across different lesions of the terminal ileum. (C) Bar plot showing the proportion of cell types across different lesions of the terminal ileum. (D) Molecular Cartography of indicated genes in the full thickness of proximal and inflamed ileum and in the mucosa/submucosa layer of stenotic ileum. (E) Spatial map showing the colocalization of FAP+ fibroblasts and inflammatory monocytes in different lesions of terminal ileum.
Figure 6
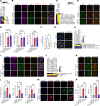
Figure 6. CD150+ monocyte-derived cytokines promote FAP+ fibroblast activation and ECM protein deposition under TWIST1 regulation.
(A) Heatmap showing relative expression of NicheNet-predicted ligands expressed by FACS-sorted myeloid cell subsets (n = 4). (B and C) Immunofluorescence staining (B) and heatmap (C) showing relative expression of FAP, TWIST1, and type III collagen in monocyte-stimulated CCD-18Co fibroblasts (scale bar: 100 μm). (D and E) Immunofluorescence staining (original magnification, ×10) (D) and bar plot (E) showing relative expression of FAP and types I and III collagen in monocyte-stimulated CCD-18Co fibroblasts. Data are shown as bar plots with SEM. Statistically significant differences were determined using 1-way ANOVA test corrected with Tukey’s multiple-comparison test (***P <0.005, ****P <0.001) (scale bars: 1 mm). (F) Bar plot showing TWIST1 expression level after lentivirus transduction. Data are shown as bar plot with SEM. Statistically significant differences were determined using 2-tailed t test (*P <0.05). (G and H) Immunofluorescence staining (original magnification, ×25) (G) and heatmap (H) showing relative expression of FAP, TWIST1, and type III collagen in TWIST1-knockdown CCD-18Co fibroblasts stimulated by profibrotic cues (scale bars: 100 μm). (I and J) Immunofluorescence staining (I) and heatmap (J) showing relative expression of FAP, TWIST1, and type III collagen in CCD-18Co fibroblasts stimulated by profibrotic cues (scale bar: 100 μm). (K and L) Immunofluorescence staining (K) and bar plot (L) showing relative expression of FAP and types I and III collagen in profibrotic cues–stimulated CCD-18Co fibroblasts after TWIST1 inhibition. Data are shown as bar plot with SEM (scale bars: 1 mm). (M and N) Immunofluorescence staining (M) and quantitative analysis (MFI) (N) of FAP and PDPN in intestinal organoids derived from profibrotic cues–stimulated induced pluripotent stem cells, with or without harmine. Data are shown as bar plots with SEM. Statistically significant differences were determined using 1-way ANOVA test corrected with Tukey’s multiple-comparison test (*P <0.05, **P <0.01, ***P <0.005, ****P <0.001) (scale bars: 300 μm).

References

    1. Ng SC, et al. Worldwide incidence and prevalence of inflammatory bowel disease in the 21st century: a systematic review of population-based studies. Lancet. 2017;390(10114):2769–2778. doi: 10.1016/S0140-6736(17)32448-0. - DOI - PubMed
    1. Kaplan GG. The global burden of IBD: from 2015 to 2025. Nat Rev Gastroenterol Hepatol. 2015;12(12):720–727. doi: 10.1038/nrgastro.2015.150. - DOI - PubMed
    1. Kappelman MD, et al. Utilization of healthcare resources by U.S. children and adults with inflammatory bowel disease. Inflamm Bowel Dis. 2011;17(1):62–68. doi: 10.1002/ibd.21371. - DOI - PMC - PubMed
    1. Mowat C, et al. Guidelines for the management of inflammatory bowel disease in adults. Gut. 2011;60(5):571–607. doi: 10.1136/gut.2010.224154. - DOI - PubMed
    1. Carter MJ. Guidelines for the management of inflammatory bowel disease in adults. Gut. 2004;53(suppl 5):V1–V16. doi: 10.1136/gut.2004.043372. - DOI - PMC - PubMed

MeSH terms