. 2024 Jul 23;134(17):e178253.
doi: 10.1172/JCI178253.

Systemic and skin-limited delayed-type drug hypersensitivity reactions associate with distinct resident and recruited T cell subsets

Affiliations

Systemic and skin-limited delayed-type drug hypersensitivity reactions associate with distinct resident and recruited T cell subsets

Pranali N Shah et al. J Clin Invest. .

Abstract

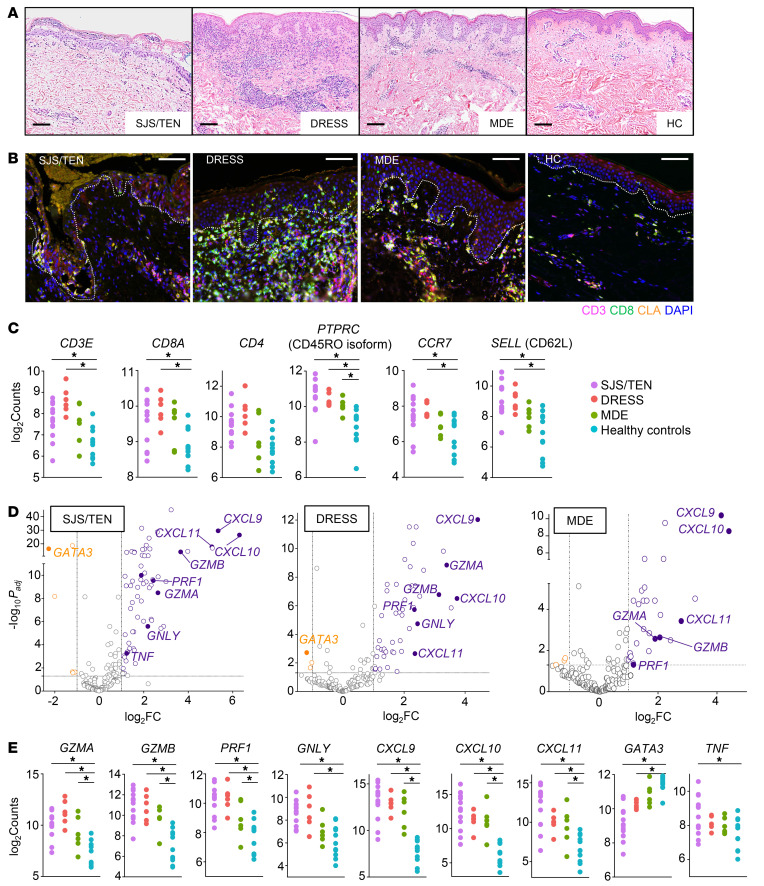
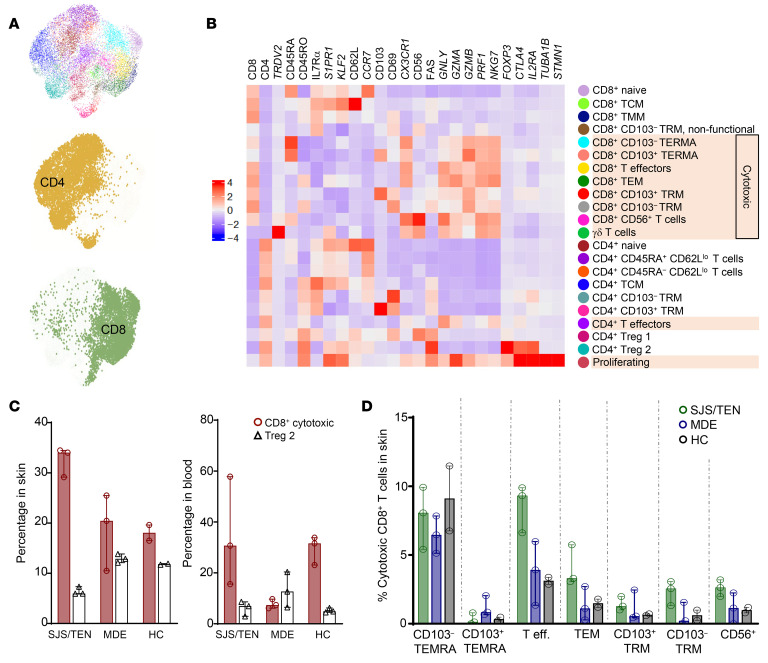
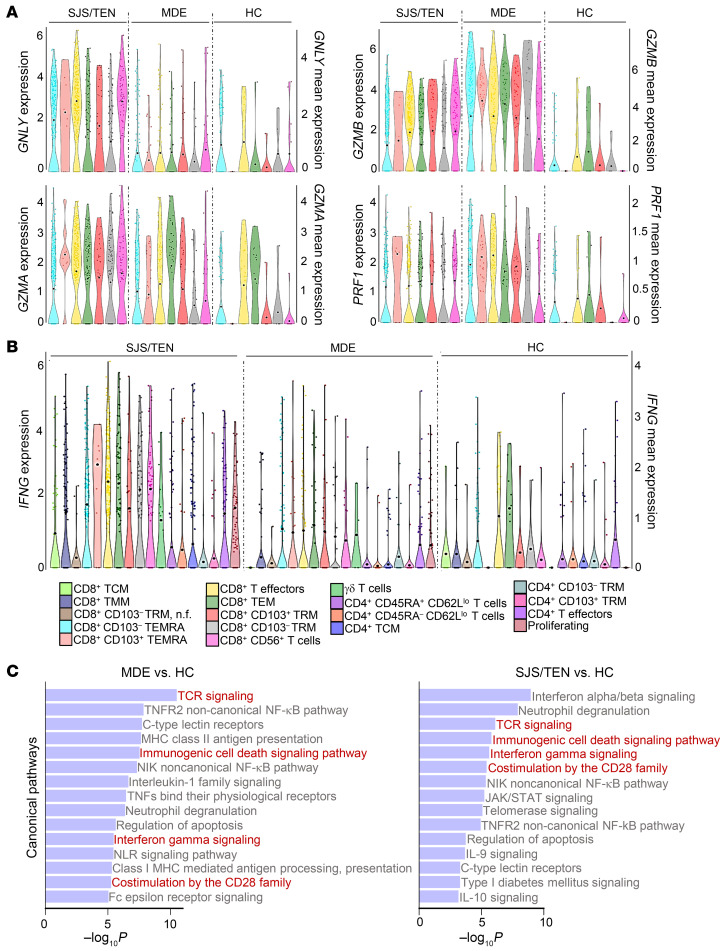
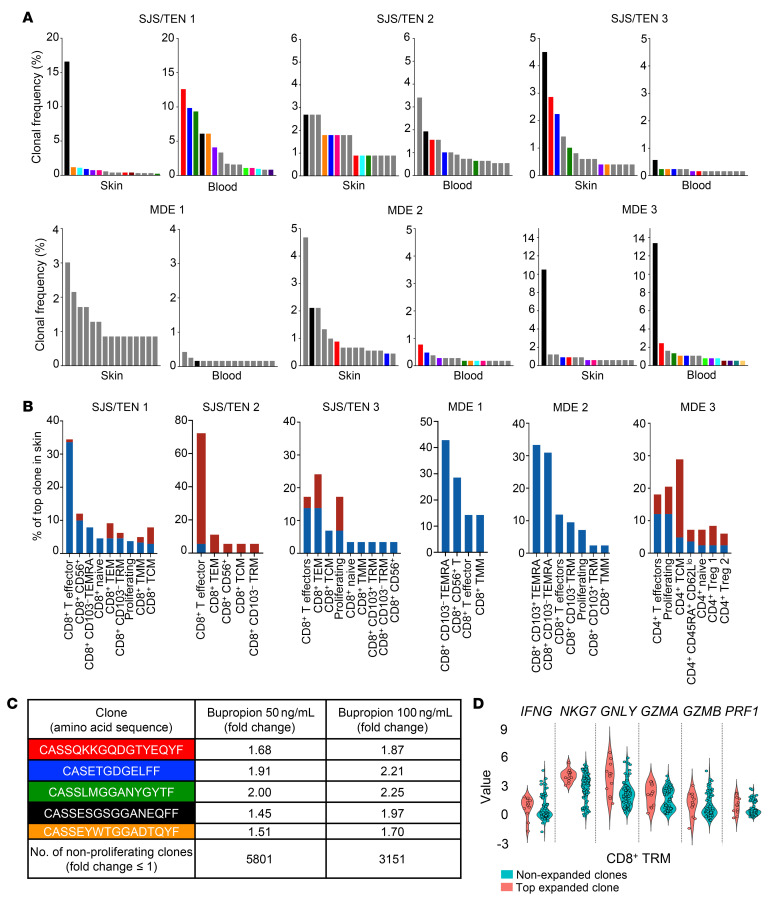
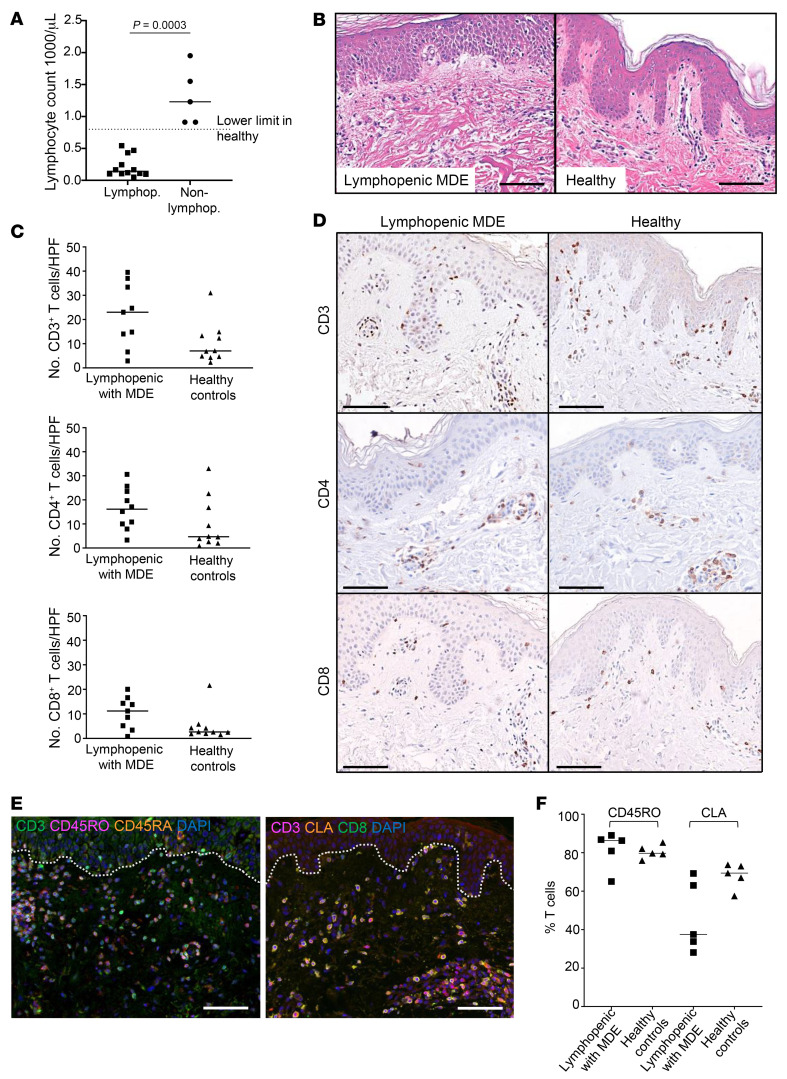
Delayed-type drug hypersensitivity reactions are major causes of morbidity and mortality. The origin, phenotype, and function of pathogenic T cells across the spectrum of severity require investigation. We leveraged recent technical advancements to study skin-resident memory T cells (TRMs) versus recruited T cell subsets in the pathogenesis of severe systemic forms of disease, Stevens-Johnson syndrome/toxic epidermal necrolysis (SJS/TEN) and drug reaction with eosinophilia and systemic symptoms (DRESS), and skin-limited disease, morbilliform drug eruption (MDE). Microscopy, bulk transcriptional profiling, and single-cell RNA-sequencing (scRNA-Seq) plus cellular indexing of transcriptomes and epitopes by sequencing (CITE-Seq) plus T cell receptor sequencing (TCR-Seq) supported clonal expansion and recruitment of cytotoxic CD8+ T cells from circulation into skin along with expanded and nonexpanded cytotoxic CD8+ skin TRM in SJS/TEN. Comparatively, MDE displayed a cytotoxic T cell profile in skin without appreciable expansion and recruitment of cytotoxic CD8+ T cells from circulation, implicating TRMs as potential protagonists in skin-limited disease. Mechanistic interrogation in patients unable to recruit T cells from circulation into skin and in a parallel mouse model supported that skin TRMs were sufficient to mediate MDE. Concomitantly, SJS/TEN displayed a reduced Treg signature compared with MDE. DRESS demonstrated recruitment of cytotoxic CD8+ T cells into skin as in SJS/TEN, yet a pro-Treg signature as in MDE. These findings have important implications for fundamental skin immunology and clinical care.

Keywords: Allergy; Dermatology; Immunology; Skin; T cells.


Figures

Figure 1
Figure 1. Retrospective skin sample analysis demonstrates variable T cell phenotypes and function across dtDHR severity.
(A) Representative H&E images of dtDHR and healthy skin. Scale bars: 100 μm. (B) Immunofluorescent staining of dtDHR and healthy skin for CD3 (magenta), CD8 (green), and CLA (orange), with DAPI nuclear stain (blue). Scale bars: 100 μm. Gray dotted lines depict dermoepidermal junction. (C) The log2 counts of T cell phenotypic genes. (D) Volcano plots highlighting significantly differentially expressed functional markers in diseased versus healthy skin. (E) The log2 counts of functional markers. (A and B) n = 3–6 per group. (CE) n = 13 SJS/TEN, 6 DRESS, 6 MDE, and 11 healthy controls. *Significance defined as absolute value │log2FC │≥ 1 and Padj < 0.05, DESeq2, Wald test.
Figure 2
Figure 2. Prospective analysis by scRNA-Seq plus CITE-Seq reveals differential T cell populations across dtDHR.
(A) UMAP of CD3+ T cells from 17 samples showing 22 clusters identified, with clear separation of CD4+ and CD8+ T cell subsets. (B) Heatmap identifying clusters by phenotypic and functional markers using both genes (italicized) and proteins (not italicized). Each box shows aggregate mean expression value of each marker of each cluster. (C) Median percentage plus range of cytotoxic CD8+ T cells and Treg2 in skin and blood of SJS/TEN, MDE, and healthy control (HC) patients. (D) Median percentage plus range of cytotoxic CD8+ T cells of total T cells in SJS/TEN, MDE, and healthy control skin across cytotoxic CD8+ T cell clusters identified from the heatmap.
Figure 3
Figure 3. Multiple T cell subsets, including skin TRM, may be functional in SJS/TEN and MDE.
(A) Violin plots showing cytotoxic markers GNLY, GZMB, GZMA, and PRF1 in SJS/TEN, MDE, and healthy control skin across cytotoxic CD8+ T cell clusters. (B) Violin plot showing IFNG in SJS/TEN, MDE, and healthy control skin across all potential effector (nonnaive and non-Treg) clusters. (A and B) Violin plots show gene expression (left y axis) and mean expression (right y axis, and visualized by black dots). Cluster legend at figure bottom. n.f., nonfunctional. (C) Fifteen most significant canonical pathways by –log10P value with z score ≥ │2│, Fisher’s exact test, of skin CD8+ (CD103+ and CD103) TRM clusters. Red text highlights pathways directly relevant to TRM activation and Th1/Tc1 function. There were no significant pathways between MDE and SJS/TEN CD8+ TRM clusters.
Figure 4
Figure 4. TCR-Seq identifies clonal expansion in blood of cytotoxic CD8+ T cells in SJS/TEN but not MDE.
(A) Clonal frequency (percentage) of the top 15 clones in skin and blood of each dtDHR patient. Clones found in both skin and blood at any frequency of each patient are color coded (black is 1 clone, red is 1 clone, etc). Clones found only in skin or blood of an individual patient at any frequency are gray. (B) Bar graph showing percentage distribution across T cell clusters of the top clone in skin (blue). If that same clone was also found in blood, it is additionally shown in red. (C) Table showing fold change of clones in blood from SJS/TEN patient 1 cultured with suspected culprit drug, bupropion, at 2 concentrations compared with vehicle. The top 5 clones deemed expanded in blood in vivo (from A) are individually shown and color coded to match (in C). (D) Violin plot showing relative value expression of Th1/Tc1 markers in CD8+ TRM comparing the top expanded clone to all nonexpanded clones (defined as ≥3 consecutive clones of the same frequency) in SJS/TEN patient 1 skin.
Figure 5
Figure 5. Human skin TRM may be sufficient to mediate MDE.
(A) Number of lymphocytes in peripheral blood of MDE patients with or without lymphopenia. Lower limit of healthy depicted as dotted line. (B) Representative H&E images from a lymphopenic MDE patient and healthy control demonstrating similar mononuclear infiltrate in skin. (C) CD3+, CD4+, and CD8+ T cell count per high-powered field (HPF) by immunohistochemistry in lymphopenic MDE patient versus healthy skin. (D) Representative immunohistochemistry images of CD3+, CD4+, and CD8+ T cells from lymphopenic MDE patient and healthy skin. (E) Representative immunofluorescence staining in skin of lymphopenic MDE patient for CD3 (magenta), CD45RO (green), and CD45RA (orange) (left image) and CD3 (magenta), CLA (orange), and CD8 (green) (right image), with DAPI nuclear stain (blue). (F) Percentage of CD45RO+CD3+ T cells and CLA+CD3+ T cells per HPF of lymphopenic MDE patient compared with healthy skin. Scale bars: 100 μm (B, D, and E). (A, C, and F) Lines show median. Significance defined as P < 0.05, 2-tailed Mann-Whitney U test. Only P < 0.05 shown.
Figure 6
Figure 6. Drug-specific skin TRMs are generated in mouse skin after disease resolution.
HLA-B*57:01pos and HLA-B*57:01neg mice treated with systemic drug alone did not develop skin inflammation by (A) ear thickness (mean with SEM shown) or (B) total number of CD3+ T cells and CD8+ T cells in ear skin by flow cytometry. Mice treated with systemic and topical drug developed skin inflammation that slowly resolved by 90 days after treatment as measured by (C) ear thickness (mean + SEM shown) and (D) histology. Scale bars: 200 μm (gray); 50 μm (black). (E) Total number of CD8+ TEMs (CD44hiCD62Llo) in blood, TCMs (CD44hiCD62Lhi) in LN, and total CD8+ T cells in ear skin quantified by flow cytometry (gated on CD3+CD8+ T cells). (F) CD8+ T cells in resolved ear skin show a TRM (CD62LloCD69+CLA+) phenotype by flow cytometry. Plots gated on CD3+CD8+ T cells. (AF) Each experiment repeated at least twice. Pooled results from 2 independent experiments shown. (B and D) Lines show median. Significance defined as P < 0.05, Kruskal-Wallis test followed by Dunn’s multiple-comparisons test between experimental and each control group.
Figure 7
Figure 7. Skin TRMs mediate an MDE-like reaction in mice in the absence of circulating T cells.
(A) Schematic of drug challenge experiment. Endpoint: 107 days. (B) Ear thickness (mean + SEM shown). (C) Representative histology. Scale bars: 200 μm (gray); 50 μm (black). (D) Total number of CD8+ T cells in ear skin. (E) Number of CD3+ T cells, CD8+ T cells, and effector CD8+ T cells (CD44hiCD62Llo) in blood. (F) Percentage of functional CD8+ T cells in ear skin of mice treated or not with FTY720. (AF) Each experiment was repeated at least twice. Pooled results from 2 independent experiments shown. (DF) By flow cytometry. Lines show median. (D and E) Significance defined as P < 0.05, Kruskal-Wallis test followed by Dunn’s multiple-comparisons test. (F) Nonsignificant, P > 0.05; 2-tailed Mann-Whitney U test.

References

    1. Wheatley LM, et al. Report from the National Institute of Allergy and Infectious Diseases workshop on drug allergy. J Allergy Clin Immunol. 2015;136(2):262–271. doi: 10.1016/j.jaci.2015.05.027. - DOI - PMC - PubMed
    1. Hsu DY, et al. Morbidity and mortality of Stevens-Johnson syndrome and toxic epidermal necrolysis in United States adults. J Invest Dermatol. 2016;136(7):1387–1397. doi: 10.1016/j.jid.2016.03.023. - DOI - PubMed
    1. Velasco-Tirado V, et al. Life-threatening dermatoses: Stevens-Johnson syndrome and toxic epidermal necrolysis. impact on the Spanish public health system (2010-2015) PLoS One. 2018;13(6):e0198582. doi: 10.1371/journal.pone.0198582. - DOI - PMC - PubMed
    1. Schunkert EM, Divito SJ. Updates and insights in the diagnosis and management of DRESS syndrome. Curr Dermatol Rep. 2021;10(4):192–204. doi: 10.1007/s13671-021-00348-z. - DOI - PMC - PubMed
    1. Bellón T. Mechanisms of severe cutaneous adverse reactions: recent advances. Drug Saf. 2019;42(8):973–992. doi: 10.1007/s40264-019-00825-2. - DOI - PubMed

MeSH terms