. 2024 Sep 25;30(54):e202401957.
doi: 10.1002/chem.202401957. Epub 2024 Sep 9.

N-Glycosylation-Induced Pathologic Protein Conformations as a Tool to Guide the Selection of Biologically Active Small Molecules

Affiliations

N-Glycosylation-Induced Pathologic Protein Conformations as a Tool to Guide the Selection of Biologically Active Small Molecules

Andrea Magni et al. Chemistry. .

Abstract

Post-translational modifications such as protein N-glycosylation, significantly influence cellular processes. Dysregulated N-glycosylation, exemplified in Grp94, a member of the Hsp90 family, leads to structural changes and the formation of epichaperomes, contributing to pathologies. Targeting N-glycosylation-induced conformations offers opportunities for developing selective chemical tools and drugs for these pathologic forms of chaperones. We here demonstrate how a specific Grp94 conformation induced by N-glycosylation, identified previously via molecular dynamics simulations, rationalizes the distinct behavior of similar ligands. Integrating dynamic ligand unbinding information with SAR development, we differentiate ligands productively engaging the pathologic Grp94 conformers from those that are not. Additionally, analyzing binding site stereoelectronic properties and QSAR models using cytotoxicity data unveils relationships between chemical, conformational properties, and biological activities. These findings facilitate the design of ligands targeting specific Grp94 conformations induced by abnormal glycosylation, selectively disrupting pathogenic protein networks while sparing normal mechanisms.

Keywords: Chaperones; Drug design; Molecular dynamics; Post-translational modifications.


Conflict of interest statement

Conflict of Interests

G.C., S. D.G., S.O., A.R., H. J.P. and S.S. are inventors on patent applications related to the epichaperome portfolio. All other authors declare no conflicts of interest.

Figures
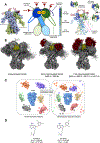
Figure 1.
Figure 1.
Grp94 structure and dynamics. A) Schematic representation of the 3D structure of N-glycosylated Grp94. Left panel: surface representation of the two protomers (protomer A in light blue and protomer B in light green) with licorice representation of covalently bound glycosides on N62 and N217 depicted in red. The 3D structure shown corresponds to PDB ID 5ULS with inhibitor PU-WS13 docked in both active sites. Center panel: a schematic representation of Grp94, highlighting protomers, domains and lids in different colors. Protomer A is shown in a blue palette and protomer B in a green palette, with color intensity gradually decreasing from the pre-NTD domain to the CTD domain. Red triangles represent the four covalent glycosylations, while yellow circles identify the two ATP-lid regions (one for each NTD). The reported residue numbering for each domain and glycosylation is standardized to the Uniprot code. Since the sequence of the two protomers is identical, they share the same numbering, with specification of the referred protomer (A or B) when needed. Right panel: cartoon view of the Grp94 domains, highlighting relevant protein regions. The structure is the same as in the left panel. Protomer A is in blue, while protomer B is in green, with color intensity decreasing from the pre-NTD domain to the CTD domain. The docked PU-WS13, bound to the NTD, is depicted in magenta licorice representation within the binding pocket, while glycosides are shown in red. PU-WS13 binds in the active site and engages residues known to bind analogous inhibitors in previous X-ray structures (see ref. Castelli et al., 10.1016/j.str.2023.05.017, for more details). The ATP-lid region is highlighted in yellow, with a zoomed-in view provided for the lid of protomers A and B, shown in yellow cartoon representation. ATP-lid numbering follows the scheme used in the center panel. B) Simplified pictorial representation of the dynamics of Grp94 in different glycosylation states. Left panel: superposition of 200 snapshots from the Molecular Dynamics simulations of fully unglycosylated Grp94 with PU-WS13 inhibitor bound. Simulating the dynamics of the fully unglycosylated Grp94 allows us to evaluate its intrinsic dynamics, distinguishing the effect of glycans on the conformational space visited by the protein, in comparison to the different glycosylated states. Center panel: superposition of 200 snapshot from Molecular Dynamics simulations of the N62 monoglycosylated Grp94 (glycosides shown in red) with PU-WS13. Right panel: superposition of 200 snapshot from Molecular Dynamics simulations of the fully glycosylated Grp94 (glycosides shown in red) bound to the same small molecule ligand. The yellow ribbons highlight the ATP-lid, showing that this structural element samples different conformational ensembles depending on N-glycosylation. The picture shows the distinct dynamics of the lid in the various forms of the protein. C) Schematic illustration of the N-glycosylation-induced modifications of the interaction networks of Grp94. Structural and dynamic modifications of Grp94 dynamics under disease conditions dismantle the normal interactome of the protein and reshape functional pathways at the systems level, favoring the assembly of epichaperomes. With this mechanism, glycan-mediated remodeling of protein networks has a broader impact than individual protein conformations, causing phenotypic changes at the cell level. D) Representative first-generation Grp94 ligands. 2D chemical structures of small molecule ligands PU-WS13 and PU-WS12 with corresponding affinity and cytotoxicity experimental data.
Figure 2.
Figure 2.
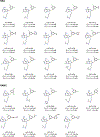
Grp94 ligands investigated in this study. Chemical structures of the congeneric series of ligands with their respective values of affinity for Grp94 and cytotoxicity (i.e., a surrogate measure for productive Glyc62Grp94 engagement in cells). Upper panel, compounds exhibiting high affinity and cytotoxicity (HAC); Lower panel, the compounds showing high affinity and low cytotoxicity (HANC).
Figure 3.
Figure 3.
The conformational variability of the ATP-lid determines ligand unbinding. A) The three NTD conformations isolated from the full-length structure of Grp94. NTDA is shown in blue, NTDB in green and the semi-open conformation NTDS in orange. Each conformation includes compound PU-WS13 represented in magenta licorice, while the ATP-lid is colored in red. In the bottom portion of the figure, the three conformations are superimposed on the backbone, with the different ATP-lid conformations highlighted (circle). B) On the top of the panel, a box plot representation of the distribution of the unbinding times for the two groups of compounds from the semi-open state of Grp94 NTD (NTDS). The blue box represents compounds of the HAC group; the red box represents compounds of the HANC group. At the bottom, a representative schematic cartoon illustrating the unbinding trajectory of ligand PU-WS13 from the NTDS. The reference receptor is represented by the first frame of the simulation: the unbinding trajectory has been fitted on this frame, with different ligand poses sampled and shown at regular intervals. The time evolution of the ligand poses is color coded from blue (the initial stage, where the compound is fully bound) to red (final stage, where unbinding occurs). While this cartoon represents only one of the simulated compounds, the colors correspond to those used for the box plot, with blue indicating the bound state and red indicating the unbound state.
Figure 4.
Figure 4.
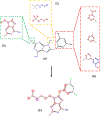
Visual representation of QSAR for the ligands studied here and highlight of functional groups important or detrimental for activity. Red dots indicate functional groups that enhance productive Glyc62Grp94 engagement (as measured by cytotoxicity), while blue dots indicate functional groups that hinder this activity. A) Common scaffold for the congeneric series. B) Phenyl modifications at R2 and R3 that improve (first two structures from the top) and worsen (last structure from the top) cytotoxicity. C) Modifications at R1 that improve (last structure from the top) and worsen (first structure from the top) cytotoxic activity. D) Adenine modifications at R4 that improve cytotoxic activity. E) Representative HJP-VI-69 QSAR, showing the functional groups contributing to cytotoxicity.
Figure 5.
Figure 5.
Pictorial representation of electrostatic potential maps for the congeneric series of compounds. Red volumes represent negatively charged areas, while blue volumes represent positively charged ones. A) EPM of compound PU-WS13. B 1) EPM of the HAC group with amino-charged lateral chain modifications. B 2) EPM of the HANC group with amino-charged lateral chain modifications. C) EPM of the HAC group with adenine F-decoration. D 1) EPM of the HAC group with different phenyl moiety decorations. D 2) EPM of the HANC group with different phenyl moiety decorations.
Figure 6.
Figure 6.
3D representation of the stereoelectronic properties of the active site in the NTD of Grp94. A) PU-WS13 docking pose within the binding site. B) Positively charged bulge (created by Ser169 and Gly170), located near the two negatively charged chlorine groups attached to the phenyl moiety. C) Positively charged depression (formed by Lys114) adjacent to the negatively charged fluorine group attached to the adenine moiety. D) Positively charged depression (formed by Asp149 and Thr245), located near the charged nitrogen of the lateral chain.

References

    1. Hoter A, El-Sabban ME, Naim HY, in The HSP90 Family: Structure, Regulation, Function, and Implications in Health and Disease, Vol. 19, 2018; - PMC - PubMed
    2. Hoter A, El-Sabban ME, Naim HY, Int. J. Mol. Sci. 2018, 19(9), 2560. - PMC - PubMed
    1. Prodromou C, Biochem. J. 2016, 473, 2439–2452; - PMC - PubMed
    2. Schopf FH, Biebl MM, Buchner J, Nat. Rev. Mol. Cell Biol. 2017, 18, 345–360. - PubMed
    1. Butler LM, Ferraldeschi R, Armstrong HK, Centenera MM, Workman P, Mol. Cancer Res. 2015, 13, 1445; - PMC - PubMed
    2. Trepel JB, Mollapour M, Giaccone G, Neckers L, Nat. Rev. Cancer 2010, 10, 537–549. - PMC - PubMed
    1. Joshi A, Ito T, Picard D, Neckers L, Biomolecules 2022, 12, 880; - PMC - PubMed
    2. Rasola A, Neckers L, Picard D, Trends Cell Biol. 2014, 24, 455–463; - PMC - PubMed
    3. Masgras I, Sanchez-Martin C, Colombo G, Rasola A, Front. Oncol. 2017, 7, 58. - PMC - PubMed
    1. Wu BX, Hong F, Zhang Y, Ansa-Addo E, Li Z, Adv. Cancer Res. 2016, 129, 165–190. - PubMed

MeSH terms

LinkOut - more resources