. 2024 Jul 30;121(31):e2402120121.
doi: 10.1073/pnas.2402120121. Epub 2024 Jul 23.

Patagonian dust, Agulhas Current, and Antarctic ice-rafted debris contributions to the South Atlantic Ocean over the past 150,000 years

Affiliations

Patagonian dust, Agulhas Current, and Antarctic ice-rafted debris contributions to the South Atlantic Ocean over the past 150,000 years

Anne E Barkley et al. Proc Natl Acad Sci U S A. .

Abstract

Disentangling inputs of aeolian dust, ice-rafted debris (IRD), and eroded continental detritus delivered by ocean currents to marine sediments provide important insights into Earth System processes and climate. This study uses Sr-Nd-Pb isotope ratios of the continent-derived (lithogenic) fraction in deep-sea core TN057-6 from the subantarctic Southern Ocean southwest of Africa over the past 150,000 y to identify source regions and quantify their relative contributions and fluxes utilizing a mixing model set in a Bayesian framework. The data are compared with proxies from parallel core Ocean Drilling Program Site 1090 and newly presented data from potential South America aeolian dust source areas (PSAs), allowing for an integrated investigation into atmospheric, oceanic, and cryospheric dynamics. PSA inputs varied on glacial/interglacial timescales, with southern South American sources dominating up to 88% of the lithogenic fraction (mainly Patagonia, which provided up to 68%) during cold periods, while southern African sources were more important during interglacials. During the warmer Marine Isotope Stage (MIS) 3 of the last glacial period, lithogenic fluxes were twice that of colder MIS2 and MIS4 at times, and showed unique isotope ratios best explained by Antarctic-derived IRD, likely from the Weddell Sea. The IRD intrusions contributed up to 41% at times and followed Antarctic millennial warming events that raised temperatures, causing instability of icesheet margins. High IRD was synchronous with increased bioavailable iron, nutrient utilization, high biological productivity, and decreased atmospheric CO2. Overall, TN057-6 sediments record systematic Southern Hemisphere climate shifts and cryospheric changes that impacted biogeochemical cycling on both glacial/interglacial and subglacial timescales.

Keywords: Southern Ocean; climate; dust; ice-rafted debris; provenance.


Conflict of interest statement

Competing interests statement:The authors declare no competing interest.

Figures

Fig. 1.
Fig. 1.
Schematic of SH in relation to core TN057-6/ODP 1090 (star). The gray diamonds show the locations of PS2498-1, TN057-21, TN057-10, and TN057-13/IODP 1094. Background shading depicts mean 850 hPa wind speed (m s−1) from 1948 to 2022 from NCAR/NCEP Reanalysis. PSAs of lithogenic material delivered to TN057-6 are shown with colored markers where circles represent previously published samples and squares represent new source data presented in this work. Circles with arrows near southern Africa represent Agulhas Leakage from the Agulhas Current. This figure was made in part using NASA’s Panoply software version 5.2.3 (https://www.giss.nasa.gov/tools/panoply/).
Fig. 2.
Fig. 2.
Sr-Nd-Pb isotope results from TN057-6 and PSAs (AD). Results from the <5 μm grain size fraction from core site TN057-6 showing combinations of Sr-Nd-Pb isotope ratios from this study (filled diamonds) with color indicating MIS. Previously published PSA samples and new samples presented in this work from PSAs are shown in the small circles while square markers with error bars represent the mean and 1σ of the data from each PSA. Note that some circles fall outside the domain of each plot. The black lines show the binary mixing curve between Patagonia and Southern Africa endmembers with hash marks at 5, 10, 25, 50, 75, 90, and 95%. Endmember abbreviations: Pat is Patagonia (>32°S); Nor SSA is Northern Southern South America (22°S to 32°S); Ant is Antarctica; So Afr is Southern Africa.
Fig. 3.
Fig. 3.
Time series of the Sr, Nd, and Pb isotope ratios of the <5 μm grain size in samples from TN057-6, the relative PSA contributions, and PSA lithogenic fluxes. (A) 206Pb/204Pb. (B) Neodymium (Nd) values expressed as εNd. (C) 87Sr/86Sr. 2σ errors are plotted in (AC) but are generally smaller than the markers. (D) Relative contribution estimated by the MixSIAR mixing model. The error bars show the range of the highest density 95% credible interval, and the circle marker shows the midpoint of this interval. (E) Relative contributions estimated by the source apportionment MixSIAR model. (F) TN057-6 lithogenic flux from each PSA, derived from the 230Th-normalized 232Th flux multiplied by the relative contribution estimated by the source apportionment MixSIAR shown in (D) and adjusted for Th concentrations of each source area [Northern SSA (22°S to 32°S) = 13 ppm (36); Patagonia (>32°S) = 9 ppm from ref. ; Southern Africa assumed global mean of 11 ppm; and Antarctica = 17 ppm (37)].
Fig. 4.
Fig. 4.
Time series comparing TN057-6 fluxes to ODP 1090 grain sizes, Pacific Ocean lithogenic fluxes, and Antarctic dust flux. (A) Total lithogenic flux, calculated from the 230Th-normalized 232Th flux measured at TN057-6 (16). (B) Lithogenic flux of PSAs as shown in Fig. 3F. (C) Mean grain size (μm) measured from parallel core ODP 1090 (38). (D) Percentage of grain sizes between 10 and 63 μm from parallel core ODP 1090 (38). (E) Lithogenic flux, calculated from the 230Th-normalized 232Th flux measured at PS75/76-2 and PS75/59-2 in the Pacific Ocean (2). (F) EDC Antarctic dust flux (3).
Fig. 5.
Fig. 5.
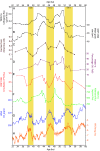
Comparison of proxy time series for 60 to 32 ka, bounding the MIS3 “camel hump” interval. (A) TN057-6 total lithogenic flux as shown in Fig. 4A (16). (B) Mean grain size measured from parallel core ODP 1090 (38). (C) Mixing model results depicting the relative proportion of material from the Antarctica PSA where the error bars represent the range of the highest density 95% credible interval. (D) Relative fraction of Fe(2+) measured from TN057-6 (32). (E) G. bulloides FB-δ15N measured from ODP 1090 (18). (F) 230Th normalized alkenone flux from TN057-6 (18). (G) Atmospheric carbon dioxide (CO2) measured in the WAIS Divide ice core (39). (H) Antarctic temperature record from Antarctic Temperature Stack (ATS) (40). Vertical yellow boxes represent the major AIM events during this interval (41).

References

    1. Winckler G., Anderson R. F., Fleisher M. Q., McGee D., Mahowald N. M., Covariant glacial-interglacial dust fluxes. Science 320, 93–96 (2008). - PubMed
    1. Lamy F., et al. , Increased dust deposition in the Pacific Southern Ocean during glacial periods. Science 343, 403–407 (2014). - PubMed
    1. Lambert F., Bigler M., Steffensen J. P., Hutterli M., Fischer H., Centennial mineral dust variability in high-resolution ice core data from Dome C, Antarctica. Clim. Past 8, 609–623 (2012).
    1. Martin J. H., Glacial-interglacial CO2 change: The iron hypothesis. Paleoceanography 5, 1–13 (1990).
    1. Tegen I., Miller R., A general circulation model study on the interannual variability of soil dust aerosol. J. Geophys. Res. 103, 25975–25995 (1998).

LinkOut - more resources