. 2025 Apr 1;81(4):1228-1243.
doi: 10.1097/HEP.0000000000001018. Epub 2024 Jul 23.

Endothelial RUNX3 controls LSEC dysfunction and angiocrine LRG1 signaling to prevent liver fibrosis

Affiliations

Endothelial RUNX3 controls LSEC dysfunction and angiocrine LRG1 signaling to prevent liver fibrosis

Uttam Ojha et al. Hepatology. .

Abstract

Background and aims: Liver fibrosis represents a global health burden, given the paucity of approved antifibrotic therapies. Liver sinusoidal endothelial cells (LSECs) play a major gatekeeping role in hepatic homeostasis and liver disease pathophysiology. In early tumorigenesis, runt-related transcription factor 3 (RUNX3) functions as a sentinel; however, its function in liver fibrosis in LSECs remains unclear. This study aimed to investigate the role of RUNX3 as an important regulator of the gatekeeping functions of LSECs and explore novel angiocrine regulators of liver fibrosis.

Approach and results: Mice with endothelial Runx3 deficiency develop gradual and spontaneous liver fibrosis secondary to LSEC dysfunction, thereby more prone to liver injury. Mechanistic studies in human immortalized LSECs and mouse primary LSECs revealed that IL-6/JAK/STAT3 pathway activation was associated with LSEC dysfunction in the absence of RUNX3. Single-cell RNA sequencing and quantitative RT-PCR revealed that leucine-rich alpha-2-glycoprotein 1 ( LRG1 ) was highly expressed in RUNX3-deficient and dysfunctional LSECs. In in vitro and coculture experiments, RUNX3-depleted LSECs secreted LRG1, which activated HSCs throughTGFBR1-SMAD2/3 signaling in a paracrine manner. Furthermore, circulating LRG1 levels were elevated in mouse models of liver fibrosis and in patients with fatty liver and cirrhosis.

Conclusions: RUNX3 deficiency in the endothelium induces LSEC dysfunction, LRG1 secretion, and liver fibrosis progression. Therefore, endothelial RUNX3 is a crucial gatekeeping factor in LSECs, and profibrotic angiocrine LRG1 may be a novel target for combating liver fibrosis.


Conflict of interest statement

The authors have no conflicts to report.

Figures

None
Graphical abstract
FIGURE 1
FIGURE 1
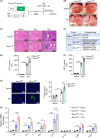
Endothelial Runx3 deficiency induces sinusoidal capillarization in young mice and spontaneous liver fibrosis in aged mice. (A) Representative images of mouse (2–3 mo old) liver sections with IF stain against CD31, n = 5 per group. (B) Representative images of mouse (2–3 mo old) liver sections with IF stain against CD34 and IHC stain against LYVE1, n = 5 per group. (C) Expression of the indicated genes in the mouse livers (2–3 mo old) analyzed by qRT-PCR, n = 5 per group. (D) Representative images of mouse (2–3 mo old) liver sections with IHC stain against vWF, n = 5 per group. (E) Mouse (1 y old) liver sections with IF stain against CD31, n = 5 per group. (F) Mouse (1 y old) liver sections with IF stain against CD34, n = 5 per group. (G) H&E, SR, and MT staining on mouse (1 y old) liver sections, n = 5 per group. (H) Representative immunoblot analysis of α-SMA and collagen I in mouse (1 y old) liver samples, n = 5 per group. (I) Relative mRNA abundance of Acta2 (gene for α-SMA) and Col1a1 on mouse (1 y old) livers, n = 5 per group. All data are shown as mean ± SD. *p < 0.05, **p < 0.01, ***p < 0.001, ****p < 0.0001. Unpaired t test (A, B, D, E, F, G, and H) and two-way ANOVA, followed by the Sidak test (C and I). Abbreviations: Acta2, actin alpha 2 (gene for α-SMA); CD31, cluster of differentiation 31; CD34, cluster of differentiation 34; H&E, hematoxylin and eosin; IF, immunofluorescence; IHC, immunohistochemistry; LSECs, liver sinusoidal endothelial cells; LYVE1, lymphatic vessel endothelial hyaluronan receptor 1; MT, Masson’s trichrome; qRT-PCR, quantitative real-time polymerase chain reaction; SR, Sirius Red; vWF, von Willebrand factor; α-SMA, alpha-smooth muscle actin.
FIGURE 2
FIGURE 2
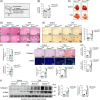
Endothelial Runx3 deficiency aggravates TAA-induced inflammation and liver dysfunction in mice. (A) Experimental scheme to induce acute liver injury using TAA in mice. (B) Macroscopic images of the liver samples. (C) Mouse liver sections stained with H&E. Encircled areas indicate hemorrhagic necrosis, and arrowheads represent inflammatory cell infiltration. (D) Microscopic findings assessed from H&E-stained mouse liver sections in C. (E, F) Serum ALT and AST levels, n = 5 per group. (G) IF staining against F4/80 on mouse liver sections, n = 5 per group. (H) Expression of the indicated genes in the mouse livers analyzed by qRT-PCR, n = 5 per group. All data are shown as mean ± SD. *p < 0.05, **p < 0.01, ***p < 0.001, ****p < 0.0001. Two-way ANOVA followed by the Tukey test. Abbreviations: ALT, alanine transaminase; AST, aspartate transaminase; H&E, hematoxylin and eosin; IF, immunofluorescence; qRT-PCR, quantitative real-time polymerase chain reaction; TAA, thioacetamide.
FIGURE 3
FIGURE 3
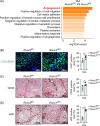
Endothelial Runx3 deficiency aggravates TAA-induced liver fibrosis in mice. (A) Experimental scheme for TAA-induced liver fibrosis in mice. (B) Liver-to-body weight ratio. (C) Macroscopic images of the liver samples. (D, E) H&E-stained and SR-stained liver sections from saline-injected or TAA-injected mice. Encircled areas represent necrosis, and arrowheads represent collagen deposition for creating bridging fibrosis. (F) Histological scores for liver fibrosis and injury in TAA-injected mice from (D) and (E). (G) IF and IHC staining against α-SMA and collagen I on mouse liver sections. (H) Relative mRNA abundance of Acta2 and Col1a1 on mouse livers analyzed by qRT-PCR. (I) Representative immunoblot analysis of α-SMA and collagen I in mouse liver samples. All data are shown as mean ± SD (n = 5 per group). *p < 0.05, **p < 0.01, ***p < 0.001, ****p < 0.0001. Two-way ANOVA followed by the Tukey test. Abbreviations: Acta2, actin alpha 2; Col1a1, collagen type I alpha 1 chain; H&E, hematoxylin and eosin; IF, immunofluorescence; IHC, immunohistochemistry; qRT-PCR, quantitative real-time polymerase chain reaction; α-SMA, alpha-smooth muscle actin; TAA, thioacetamide.
FIGURE 4
FIGURE 4
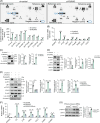
Endothelial loss of Runx3 aggravates TAA-induced sinusoidal capillarization and pathological angiogenesis in the liver. (A) Bar plot demonstrating the top 10 enriched biological process terms of Gene Ontology in ECs from TAA-injected Runx3 fl/fl and Runx3 ΔEC mice. (B–D) IF and IHC staining against CD31, CD34, and vWF on TAA-injected mouse liver sections. All data are shown as mean ± SD (n = 5 per group). *p < 0.05, **p < 0.01, ***p < 0.001, unpaired t test. Abbreviations: CD31, cluster of differentiation 31; CD34, cluster of differentiation 34; ECs, endothelial cells; IF, immunofluorescence; IHC, immunohistochemistry; TAA, thioacetamide; vWF, von Willebrand factor.
FIGURE 5
FIGURE 5
IL-6/JAK/STAT3 pathway is involved in the dysfunctional phenotype of RUNX3-deficient TMNK-1 cells. (A) Cytokine array using CM from TMNK-1 cells transfected with control or RUNX3-targeted siRNA for 36 hours. Left bottom shows densitometric quantification for secreted cytokines. (B) qRT-PCR analysis to check the relative mRNA expression of indicated genes in TMNK-1 cells revealed from cytokine array in (A). (C) TMNK-1 cell transfection with control or RUNX3-targeted siRNA for 36 hours, followed by immunoblotting of cell lysates and protein precipitates from CM. (D) TMNK-1 cell transfection with the indicated siRNAs for 36 hours, followed by immunoblotting. (E) TMNK-1 cell pretreatment with ruxolitinib (2 μM) and transfection with control or RUNX3-targeted siRNA for 36 hours, followed by immunoblotting of cell lysates and protein precipitates from CM. (F) TMNK-1 cell pretreatment with ruxolitinib (2 μM), transfection with siRNAs of control and RUNX3 for 36 hours, and qRT-PCR analysis. (G) Fresh isolation of primary mouse (2–3 mo old) LSECs, followed by immunoblotting, n = 5 per group. All data are shown as mean ± SD, n = 3 per group (B–F). *p < 0.05, **p < 0.01, ***p < 0.001, ****p < 0.0001. Two-way ANOVA followed by the Sidak test (A and B); unpaired t test (C, D, and G); one-way ANOVA followed by the Tukey test (E); and two-way ANOVA followed by the Tukey test (F). Abbreviations: CM, culture medium; qRT-PCR, quantitative real-time polymerase chain reaction.
FIGURE 6
FIGURE 6
LSECs secrete LRG1 in the absence of RUNX3 through the IL-6/JAK/STAT3 pathway. (A) Volcano plot demonstrating the DEGs in ECs from TAA-injected Runx3 fl/fl and Runx3 ΔEC mice. Orange and blue dots reflect Runx3 ΔEC-enriched and Runx3 fl/fl-enriched genes, respectively. (B) Relative mRNA expression level of Lrg1 by real-time qRT-PCR in freshly isolated mouse primary LSECs, n = 5 per group. (C) TMNK-1 cell transfection with control or RUNX3 siRNA for 36 hours, followed by immunoblotting of cell lysates and protein precipitates from CM. (D–G) TMNK-1 cell pretreatment with ruxolitinib (2 μM) or tocilizumab (10 μg/mL) and transfection with control or RUNX3 siRNA for 36 hours, followed by real-time qRT-PCR of cell lysates (D, F) and immunoblotting of cell lysates and protein precipitates from CM (E, G). All data are shown as mean ± SD, n = 3 per group (C–G). *p < 0.05, **p < 0.01, ***p < 0.001. Two-way ANOVA followed by the Tukey test (B), unpaired t test (C), and one-way ANOVA followed by the Tukey test (D–G). Abbreviations: CM, culture medium; DEGs, differentially expressed genes; ECs, endothelial cells; LSECs, liver sinusoidal endothelial cells; LRG1, leucine-rich alpha-2-glycoprotein 1.
FIGURE 7
FIGURE 7
LSEC-derived LRG1 activates HSCs through the TGFBR1-SMAD2/3 pathway. (A, B) LX-2 cells were serum-starved overnight and then treated with LRG1 (10 ng/mL) for 48 hours in the complete growth medium. Cell lysates were subjected to immunoblotting (A) and qRT-PCR (B). (C, D) LX-2 cells were cultured using CM from control or RUNX3-deficient TMNK-1 cells, followed by immunoblotting (C) and qRT-PCR (D) of cell lysates. (E, F) LX-2 cells were serum-starved overnight and treated with LRG1 (10 ng/mL) for the indicated time points, followed by immunoblotting of the indicated proteins. (G, H) LX-2 cells were serum-starved overnight and pretreated with galunisertib, followed by LRG1 (10 ng/mL) treatment for 15 minutes (G) and 48 hours (H). Cell lysates underwent immunoblotting to evaluate the expression of the indicated proteins. All data are shown as mean ± SD (n = 3 per group). *p < 0.05, **p < 0.01, ***p < 0.001. Unpaired t test (A–D), one-way ANOVA followed by the Dunnett test (E and F), and one-way ANOVA followed by the Tukey test (G and H). Abbreviations: CM, culture medium; LRG1, leucine-rich alpha-2-glycoprotein 1; LSECs, liver sinusoidal endothelial cells; qRT-PCR, quantitative real-time polymerase chain reaction.
FIGURE 8
FIGURE 8
In both humans and mice, serum LRG1 levels are elevated during liver fibrogenesis. (A) Serum level of mouse LRG1 measured using ELISA. (B, C) Serum level of human LRG1 quantified using ELISA and immunoblotting. All data are shown as mean ± SD. *p < 0.05, **p < 0.01, ***p < 0.001, ****p < 0.0001. Two-way ANOVA followed by the Tukey test (n = 5 per group) (A), one-way ANOVA followed by the Dunnett test (n = 11, 28, and 26 for the normal, MAFLD, and cirrhosis groups, respectively) (B), and one-way ANOVA followed by the Tukey test (n = 8, 9, and 10, for the control, MAFLD, and cirrhosis groups, respectively) (C). Abbreviations: LRG1, leucine-rich alpha-2-glycoprotein 1; MAFLD, metabolic dysfunction–associated fatty liver disease.

References

    1. Devarbhavi H, Asrani SK, Arab JP, Nartey YA, Pose E, Kamath PS. Global burden of liver disease: 2023 update. J Hepatol. 2023;79:516–537. - PubMed
    1. Zuo T, Xie Q, Liu J, Yang J, Shi J, Kong D, et al. . Macrophage-derived cathepsin S remodels the extracellular matrix to promote liver fibrogenesis. Gastroenterology. 2023;165:746–761.e16. - PubMed
    1. Shao M, Wang Y, Dong H, Wang L, Zhang X, Han X, et al. . From liver fibrosis to hepatocarcinogenesis: Role of excessive liver H(2)O(2) and targeting nanotherapeutics. Bioact Mater. 2023;23:187–205. - PMC - PubMed
    1. Sinha S, Hassan N, Schwartz RE. Organelle stress and alterations in interorganelle crosstalk during liver fibrosis. Hepatology. 2024;79:482–501. - PubMed
    1. Fondevila MF, Fernandez U, Heras V, Parracho T, Gonzalez-Rellan MJ, Novoa E, et al. . Inhibition of carnitine palmitoyltransferase 1A in hepatic stellate cells protects against fibrosis. J Hepatol. 2022;77:15–28. - PubMed

MeSH terms