. 2024 Sep 10;8(17):4633-4646.
doi: 10.1182/bloodadvances.2023011934.

T-cell dysfunction in CLL is mediated through expression of Siglec-10 ligands CD24 and CD52 on CLL cells

Affiliations

T-cell dysfunction in CLL is mediated through expression of Siglec-10 ligands CD24 and CD52 on CLL cells

Jaco A C van Bruggen et al. Blood Adv. .

Abstract

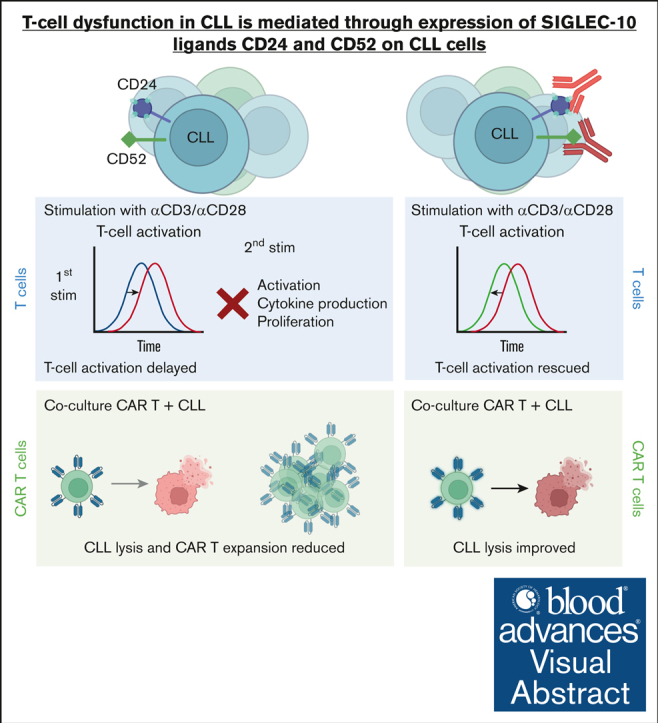
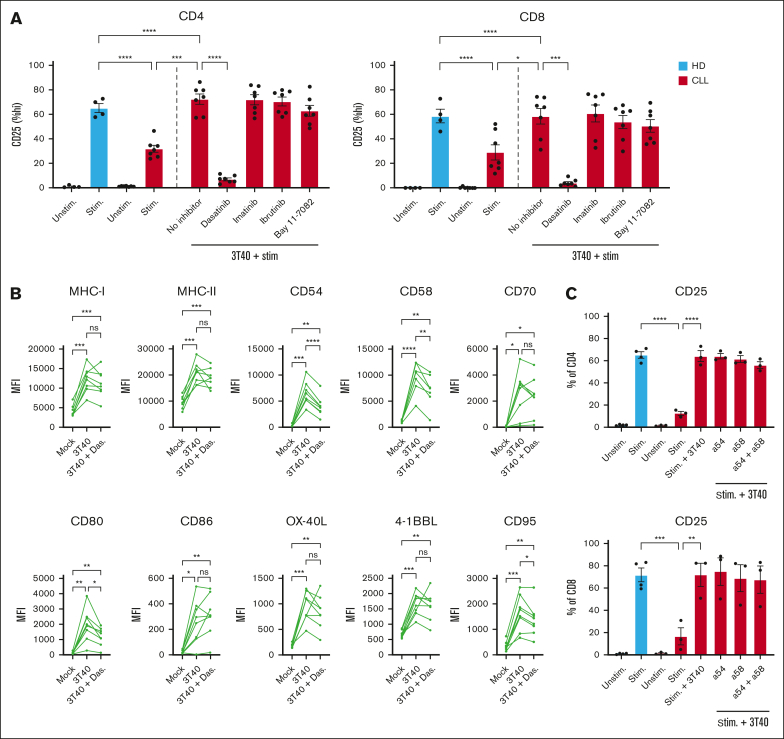
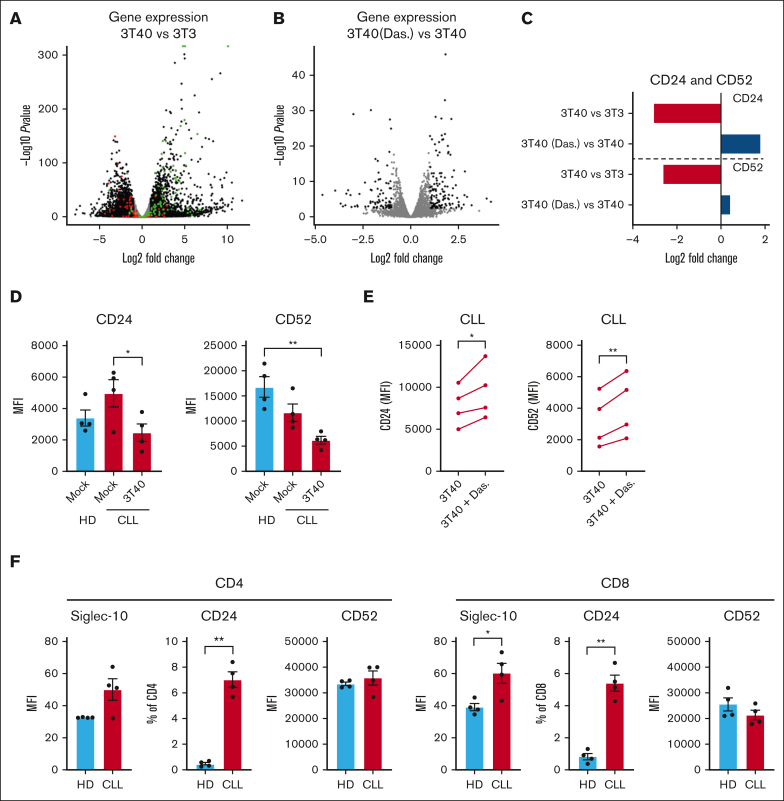
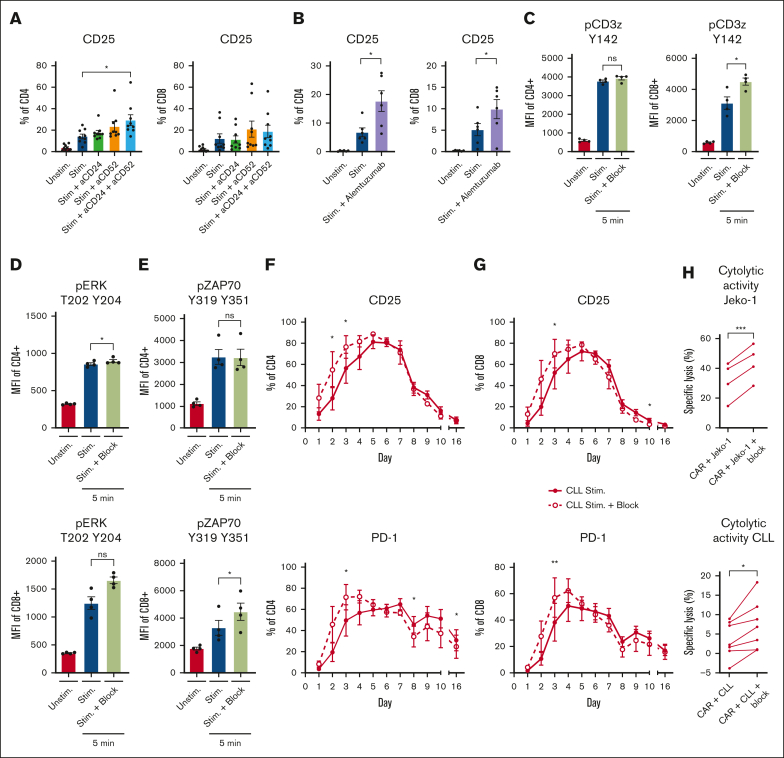
Autologous T-cell-based therapies, such as chimeric antigen receptor (CAR) T-cell therapy, exhibit low success rates in chronic lymphocytic leukemia (CLL) and correlate with a dysfunctional T-cell phenotype observed in patients. Despite various proposed mechanisms of T-cell dysfunction in CLL, the specific CLL-derived factors responsible remain unidentified. This study aimed to investigate the mechanisms through which CLL cells suppress CAR T-cell activation and function. We found that CLL-derived T cells get activated, albeit in a delayed fashion, and specifically that restimulation of CAR T cells in the presence of CLL cells causes impaired cytokine production and reduced proliferation. Notably, coculture of T cells with CD40-activated CLL cells did not lead to T-cell dysfunction, and this required direct cell contact between the CD40-stimulated CLL cells and T cells. Inhibition of kinases involved in the CD40 signaling cascade revealed that the Spare Respiratory Capacity (SRC) kinase inhibitor dasatinib prevented rescue of T-cell function independent of CD40-mediated increased levels of costimulatory and adhesion ligands on CLL cells. Transcriptome profiling of CD40-stimulated CLL cells with or without dasatinib identified widespread differential gene expression. Selecting for surface receptor genes revealed CD40-mediated downregulation of the Sialic acid-binding Ig-like lectin 10 (Siglec-10) ligands CD24 and CD52, which was prevented by dasatinib, suggesting a role for these ligands in functional T-cell suppression in CLL. Indeed, blocking CD24 and/or CD52 markedly reduced CAR T-cell dysfunction upon coculture with resting CLL cells. These results demonstrated that T cells derived from CLL patients can be reinvigorated by manipulating CLL-T-cell interactions. Targeting CD24- and CD52-mediated CLL-T-cell interaction could be a promising therapeutic strategy to enhance T-cell function in CLL.


Conflict of interest statement

Conflict-of-interest disclosure: The authors declare no competing financial interests.

Figures

None
Graphical abstract
Figure 1.
Figure 1.
Delayed activation in CLL-derived T cells and diminished effector function after restimulation. (A-B) PBMCs from HDs and patients with CLL were thawed and T cells were stimulated once with soluble stimulating CD3/CD28 antibodies and kept in culture for 16 days. (A) Expression of CD25 and PD-1 was measured daily (HD, n = 6; CLL, n = 10-12). (B) On day 14, all cells were washed, stained with Cell Trace Violet (CTV), and resuspended in culture medium with or without a single dose of CD3/CD28 antibodies. After 48 hours, T-cell activation was measured by analyzing CD25 expression. (C) In addition, the proliferation and replication index was calculated (using FlowJo) based on CTV intensity 5 days after restimulation (HD, n = 6; CLL, n = 10). (D) In addition, after an initial 14 days of single stimulation with CD3/CD28 antibodies, T cells were restimulated and kept for 2 days, and IFN-γ, TNFα, IL-2, and degranulation (CD107a) were measured on CD8 T cells (HD, n = 4; CLL, n = 3). (E) In a repeated stimulation experiment, PBMCs from HDs and patients with CLL were thawed and at start and on day 5 and day 10, PBMCs were washed and resuspended with the addition of CD3/CD28 antibodies. Every 5 days, the proliferation (population doublings) of T cells was analyzed using counting beads (HD, n = 3; CLL, n = 3). P values were calculated using a t test (A), a Welch t test (B), a Mann-Whitney test (C), a 2-way analysis of variance (ANOVA) that corrected for multiple comparisons using a Tukey test (D), or a 1-way ANOVA (E). Data are presented as mean ± standard error of the mean (SEM); ∗P ≤ .05, ∗∗P ≤ .01, ∗∗∗P ≤ .001, ∗∗∗∗P ≤ .0001.
Figure 2.
Figure 2.
Effector function of CAR T cells is reduced in presence of CLL cells. (A) A pure population of T cells were obtained from PBMCs from HDs and patients with CLL. These purified T cells were transduced with a CD19BBζ CAR construct or left untransduced (UTD) and expanded for 14 days. The phenotype of the HD and CLL (CAR) T cells was characterized before T-cell selection (PBMC) or after transduction (UTD, transduced; CAR T cells) based on CD27 and CD45RA expression as follows: naive were CD27+CD45RA+, central memory (CM) were CD27+CD45RA, effector memory (EM) were CD27CD45RA, and EM RA+ (EMRA) were CD27CD45+ (HD, n = 3-10; CLL, n = 3-6). (B) CAR T cells were cultured with either JeKo-1 or autologous CLL cells, and after 1 day, specific lysis was calculated using TO-PRO and MitoTracker Orange (CLL, n = 5). In this same experiment, (C) UTD T cells and CAR T cells were analyzed for expression of CD25. (D) In a repeated stimulation assay, CAR T cells were cocultured in a 1:1 ratio with either JeKo-1 or autologous CLL cells, which were added every 5 days, and proliferation was measured every 5 days using counting beads (HD, n = 3; CLL, n = 3). (E-H) After 1 day of CAR T cells and (autologous) CLL or JeKo-1 coculture, expression of CD107a (E), IL-2 (F), IFN-γ (G), and TNF-α (H) was measured intracellularly (HD, n = 6-13; CLL, n = 2-5). P values were calculated using a Mann-Whitney test for panel A, a paired t test for panel B, a 1-way ANOVA for panels C,E-H, or a 2-way ANOVA for panel D. The data are presented as mean ± SEM; ∗P ≤ .05, ∗∗P ≤ .01, ∗∗∗P ≤ .001, ∗∗∗∗P ≤ .0001.
Figure 3.
Figure 3.
CD40 ligation of CLL cells alleviates CLL-mediated T-cell suppression in a contact-dependent manner. PBMCs derived from patients with CLL were thawed and cultured for 2 days on a layer of CD40L expressing fibroblasts. Two days after CD40 stimulation, CLL cells were harvested and fresh PBMCs derived from patients with CLL and HDs were thawed, CTV labeled and cocultured with or without the CD40-stimulated CLL cells in a 1:1 ratio. (A) T cells in presence or absence of CD40-stimulated CLL cells were stimulated for 2 days with soluble stimulatory CD3/28 antibodies, after which expression of CD25 was measured (HD, n = 4; CLL, n = 3). (B) In a different experiment, PBMCs from HDs and patients with CLL were thawed and stimulated with CD3/28 antibodies in the presence of CD40L expressing fibroblasts. Fibroblasts were removed after 24 hours, and T-cell activation (CD25) was analyzed for 6 days (HD, n = 4; CLL, n = 6). (C) To analyze cell-cell contact dependency, PBMCs derived from patients with CLL were first cultured on a layer of CD40L-expressing fibroblasts and harvested after 2 days and were plated either in the transwell insert or not with autologous PBMCs (schematic overview: supplemental Figure 2). After plating the cells in the transwell or together, T cells were stimulated for 2 days with CD3/28 antibodies after which CD25 expression was analyzed (HD, n = 10; CLL, n = 10). Red bars indicate T cells present from the start of the experiment and blue bars indicate T cells that were added during the transwell set up. P values were calculated using a 1-way ANOVA for panels A,C or a t test for panel B. The data are presented as mean ± SEM; ∗P ≤ .05, ∗∗P ≤ .01, ∗∗∗P ≤ .001, ∗∗∗∗P ≤ .0001. Stim, stimulated.
Figure 4.
Figure 4.
Dasatinib inhibits the effects of CD40 ligation but does not restrict the expression of accessory molecules on CLL cells. (A) PBMCs from patients with CLL were first cultured on a layer of CD40L expressing fibroblasts with or without dasatinib (1 μM/mL), imatinib (1 μM/mL), ibrutinib (1 μM/mL), or Bay 11-7082 (0.1 μM/mL) for 2 days, after which the CLL cells were thoroughly washed to remove the inhibitors. The untreated and treated CLL cells were resuspended in fresh media and cultured in a 1:1 ratio with autologous PBMCs for 2 days with soluble stimulatory CD3/CD28 antibodies after which expression of CD25 was measured on T cells (HD, n = 4; CLL, n = 7). In a similar experiment, expression of (B) MHC-I, MHC-II, CD54, CD58, CD70, CD80, CD86, 4-1BBL, OX40L, and CD95 were measured on CLL cells after incubation with 1 μM dasatinib for 2 days using the 3T40 system (CLL, n = 8). (C) Before culturing CD40-stimulated CLL cells with autologous T cells, CLL cells were preincubated for 1 hour with CD54 and CD58 blocking antibodies after which T cells were stimulated for 2 days and analyzed for expression of CD25 (HD, n = 4; CLL, n = 2-3). P values were calculated using a 1-way ANOVA for panels A-C. Data are presented as mean ± SEM; ∗P ≤ .05, ∗∗P ≤ .01, ∗∗∗P ≤ .001, ∗∗∗∗P ≤ .0001. MFI, mean fluorescence intensity; Stim, stimulated.
Figure 5.
Figure 5.
RNA sequencing reveals expression of CD24 and CD52 as drivers of T-cell dysfunction. PBMCs from 4 patients with CLL were thawed and cultured on a layer of CD40L expressing fibroblasts for 2 days with or without 1 μM dasatinib. (A) Volcano plot depicting gene expression changes between CLL cells cultured on 3T40 vs those cultured on 3T3 (control). The black dots depict genes that were significantly differentially expressed (false discovery rate [FDR] <0.05; fold change >2), green dots represent known genes induced by CD40 signaling, and red dots are known genes that are down regulated after CD40 signaling (retrieved from Molecular Signatures Database; MSigDB [down = M1899 and up = M8493, CLL, n = 3-4]). (B) Volcano plot depicting gene expression changes between CLL cells cultured on 3T40 in the presence or absence of dasatinib. In black are genes that were significantly differentially expressed (FDR <0.05; fold change >2; CLL, n = 3-4). (C) Bar graph depicting the fold change of CD24 and CD52 transcription in CD40 stimulated CLL cells treated with or without dasatinib. (D) PBMCs from HDs or patients with CLL were cultured on a layer of mock or CD40L expressing fibroblasts for 2 days, and CD52 and CD24 expression was measured (HD, n = 4; CLL, n = 4). (E) PBMCs from patients with CLL were cultured on a layer of CD40L-expressing fibroblasts for 2 days with or without dasatinib, and CD24 and CD52 expression was measured (CLL, n = 4). (F) Expression of Siglec-10, CD24, and CD52 was measured on freshly thawed T cells from HD and patients with CLL ex vivo (HD, n = 4; CLL, n = 4). P values were calculated using a 1-way ANOVA (D) or a paired t test (E) or a Welch t test (F). Data are presented as mean ± SEM; ∗P ≤ .05, ∗∗P ≤ .01, ∗∗∗P ≤ .001, ∗∗∗∗P ≤ .0001. MFI, mean fluorescence intensity.
Figure 6.
Figure 6.
Inhibition of CD24 and CD52 signaling rescues T-cell function in CLL. (A-B) PBMCs from HDs and patients with CLL were thawed and preincubated for 1 hour with 1 μg/mL CD24 and 1 μg/mL CD52 antibodies (A) or alemtuzumab (1 μg/mL) (B) and subsequently stimulated with soluble stimulatory CD3/28 antibodies for 2 days. T cells were analyzed for expression of CD25 afterwards (n = 6-9). (C-E) CLL-derived T cells were stimulated with soluble CD3/28 antibodies in the presence or absence of CD24 and CD52 blocking antibodies. Five minutes after activation, the T cells were stained and analyzed for phosphorylation of CD3ζ (C; n = 4), ERK (D; n = 4), and ZAP70 (E; n = 4). (F-G) PBMCs from patients with CLL were cultured for 16 days in the presence of a single dose of CD3/28 antibodies with or without CD24 and CD52 blocking antibodies. During the culturing period, T-cell activation (CD25) and the expression of PD-1 was measured on CD4 (F) and CD8 (G) T cells. (H) 19BBζ CAR T cells were generated from T cells derived from patients with CLL and cocultured in a 1:1 ratio with either JeKo-1 cells or primary CLL cells, a single dose of blocking antibodies for CD24 and CD52 was added to the culture, and, after 1 day, the cell death of JeKo-1 cells or CLL cells was analyzed and specific lysis was calculated. P values were calculated using a t test for panels A,C,E, a paired t test for panel H, or a 1-way ANOVA for panel B. Data are presented as mean ± SEM; ∗P ≤ .05, ∗∗P ≤ .01, ∗∗∗P ≤ .001. MFI, mean fluorescence intensity.

References

    1. Killock D. Can FCR be curative in CLL? Nat Rev Clin Oncol. 2015;12(12):684. 684. - PubMed
    1. Lucas F, Larkin K, Gregory CT, et al. Novel BCL2 mutations in venetoclax-resistant, ibrutinib-resistant CLL patients with BTK/PLCG2 mutations. Blood. 2020;135(24):2192–2195. - PMC - PubMed
    1. Melenhorst JJ, Chen GM, Wang M, et al. Decade-long leukaemia remissions with persistence of CD4+ CAR T cells. Nature. 2022;602(7897):503–509. - PMC - PubMed
    1. Fraietta JA, Lacey SF, Orlando EJ, et al. Determinants of response and resistance to CD19 chimeric antigen receptor (CAR) T cell therapy of chronic lymphocytic leukemia. Nat Med. 2018;24(5):563–571. - PMC - PubMed
    1. Gribben JG, Zahrieh D, Stephans K, et al. Autologous and allogeneic stem cell transplantations for poor-risk chronic lymphocytic leukemia. Blood. 2005;106(13):4389–4396. - PMC - PubMed

Publication types

MeSH terms