. 2024 Nov 21;31(11):1926-1941.e11.
doi: 10.1016/j.chembiol.2024.06.012. Epub 2024 Jul 22.

A highly potent bi-thiazole inhibitor of LOX rewires collagen architecture and enhances chemoresponse in triple-negative breast cancer

Affiliations

A highly potent bi-thiazole inhibitor of LOX rewires collagen architecture and enhances chemoresponse in triple-negative breast cancer

Metin Cetin et al. Cell Chem Biol. .

Abstract

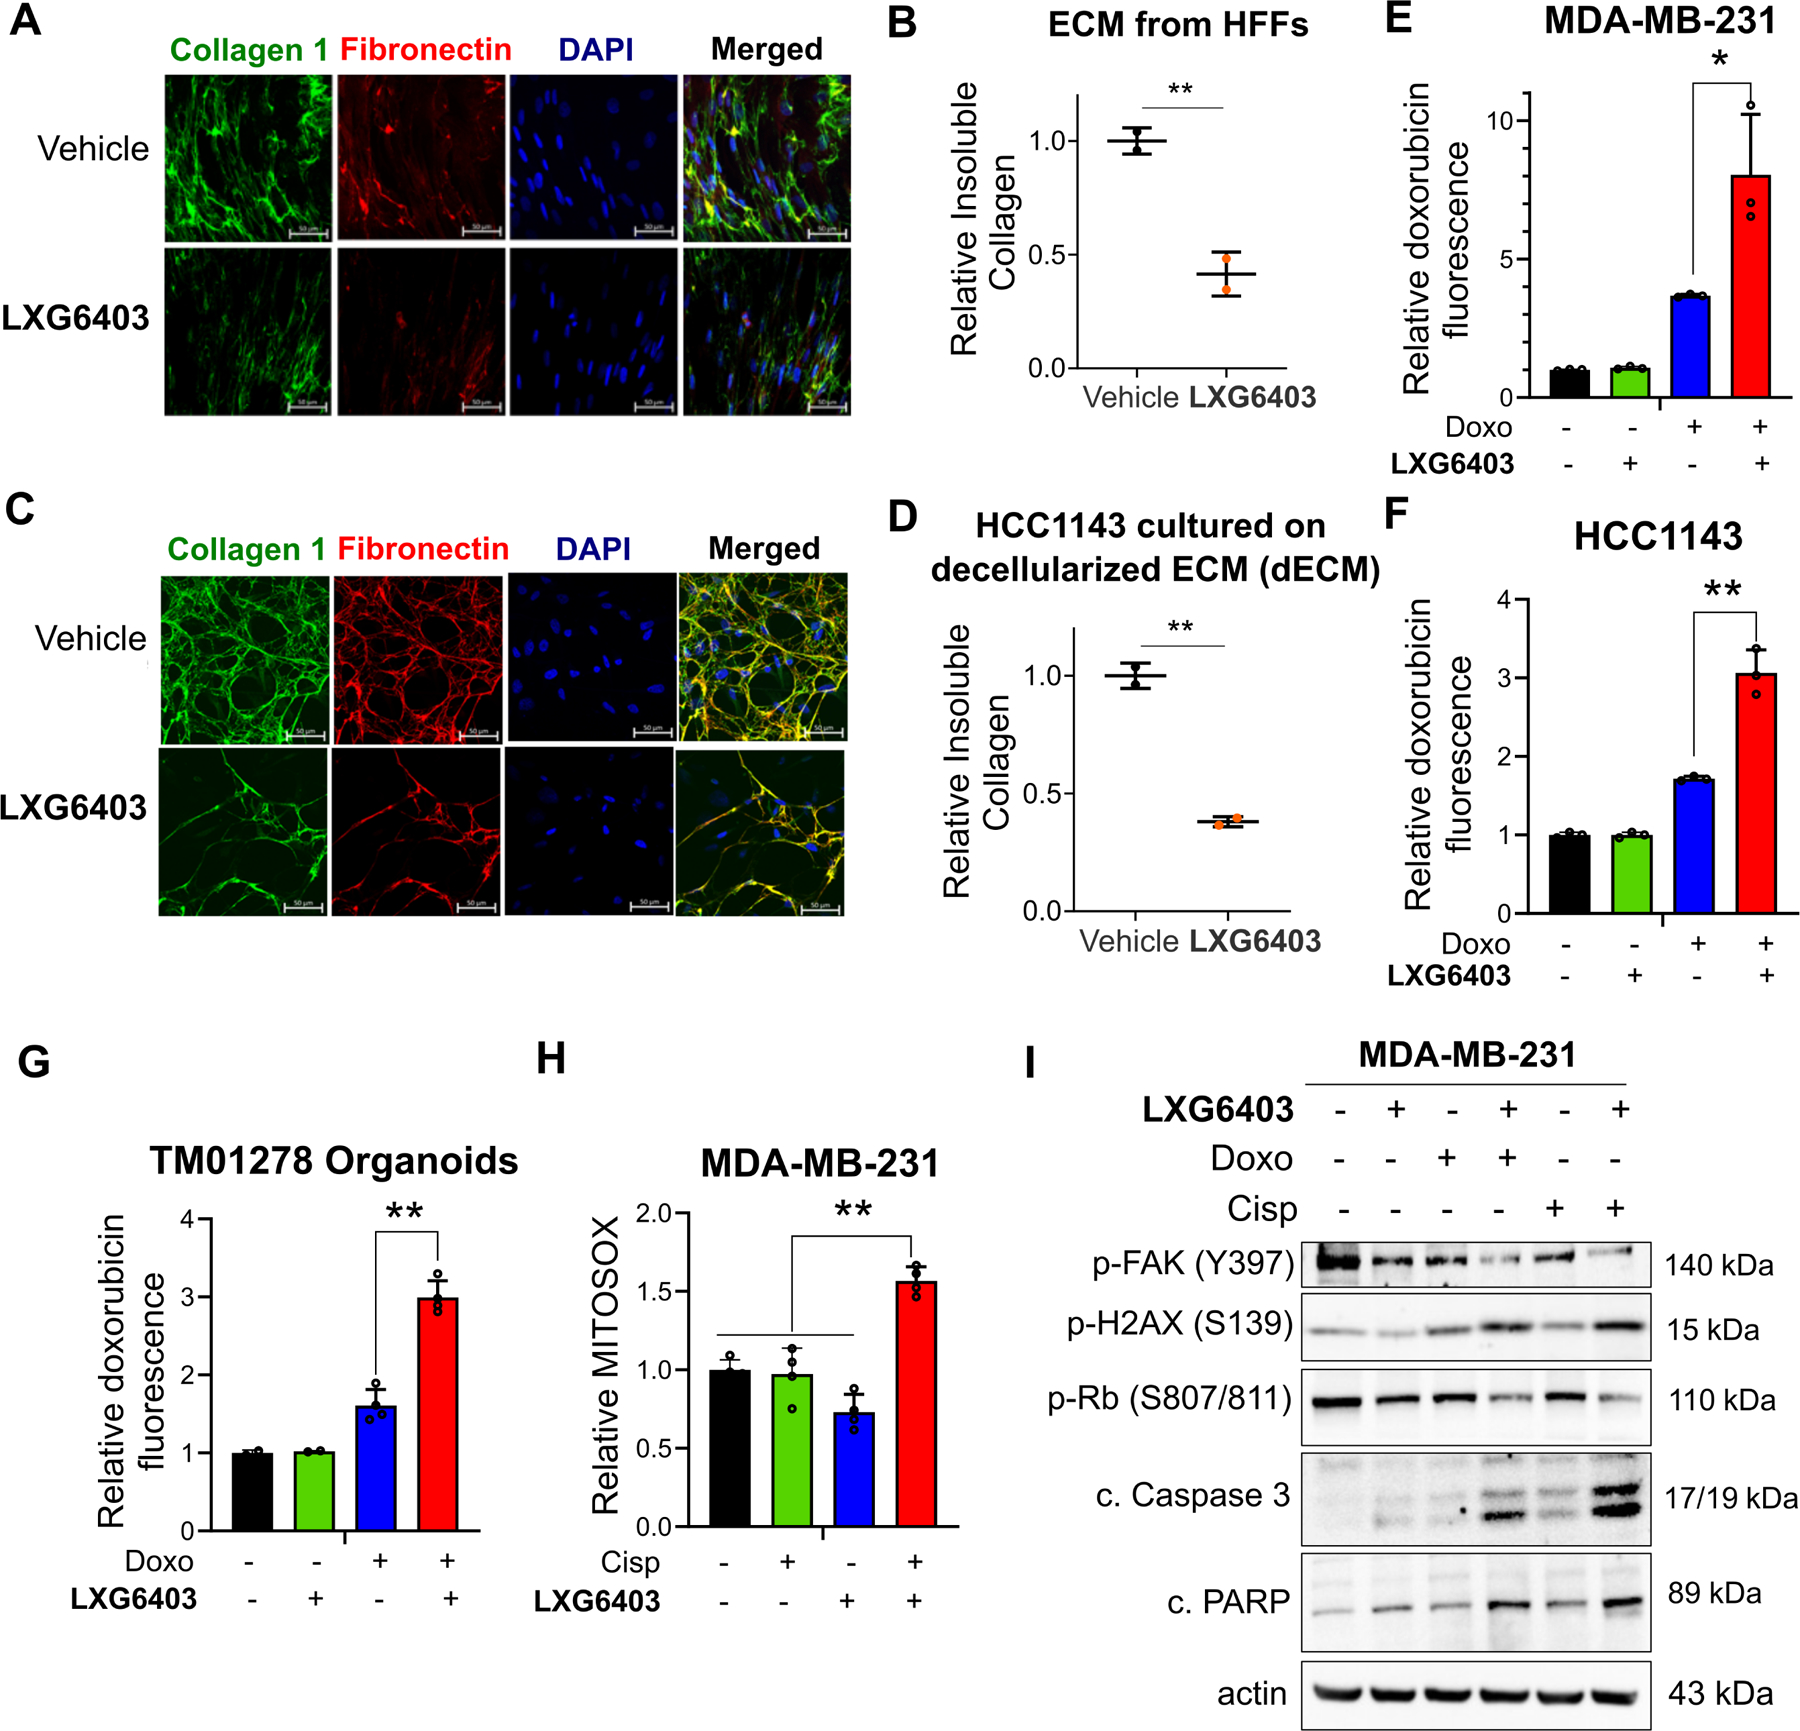
Lysyl oxidase (LOX) is upregulated in highly stiff aggressive tumors, correlating with metastasis, resistance, and worse survival; however, there are currently no potent, safe, and orally bioavailable small molecule LOX inhibitors to treat these aggressive desmoplastic solid tumors in clinics. Here we discovered bi-thiazole derivatives as potent LOX inhibitors by robust screening of drug-like molecules combined with cell/recombinant protein-based assays. Structure-activity relationship analysis identified a potent lead compound (LXG6403) with ∼3.5-fold specificity for LOX compared to LOXL2 while not inhibiting LOXL1 with a competitive, time- and concentration-dependent irreversible mode of inhibition. LXG6403 shows favorable pharmacokinetic properties, globally changes ECM/collagen architecture, and reduces tumor stiffness. This leads to better drug penetration, inhibits FAK signaling, and induces ROS/DNA damage, G1 arrest, and apoptosis in chemoresistant triple-negative breast cancer (TNBC) cell lines, PDX organoids, and in vivo. Overall, our potent and tolerable bi-thiazole LOX inhibitor enhances chemoresponse in TNBC, the deadliest breast cancer subtype.

Keywords: ECM; FAK; LOX inhibitor; ROS; TNBC chemoresistance; collagen architecture; lysyl oxidase.


Conflict of interest statement

Declaration of interests O. Sahin is the co-founder and manager of OncoCube Therapeutics LLC, founder and president of LoxiGen, and member of scientific advisory board of A2A Pharmaceuticals Inc. M.C., O. Saatci, A.-H.R., C.B., C.M., and O.S. are inventors on patent US 11,712,437.

Figures

Figure 1.
Figure 1.. Discovery of LOX inhibitors by high-throughput screen (HTS) of a diversified small-molecule library (See also Figure S1, Data S1).
A. Summary of our LOX inhibitor discovery pipeline. B The percentage remaining cellular lysyl oxidase activity upon treatment of MDA-MB-231 cells with 6336 compounds for 48 hours. The region containing the 128 hit compounds that inhibit >75% of the cellular lysyl oxidase activity was highlighted. C. Inhibition of cell-based LOX activity and cell viability upon treatment with top 20 candidate LOX inhibitors at 10 µM. The five hits mediating doxorubicin sensitization shown in D are marked. D. Doxorubicin sensitization upon combination of the selected 5 compounds (5 µM) with doxorubicin (1 µM) (n=4, 5 for vehicle, n=3 for treated). E, F. Lysyl oxidase activity assay with the recombinant LOX (E) and LOXL2 (F) proteins incubated with 10 µM of 1, 2, 3, 4 and 5, and 10 mM BAPN. (µM = microM). Data represents mean values ± standard deviation (SD). P-values were calculated with the unpaired, two-tailed Student’s t test. (* P<0.05; ** P<0.01).
Figure 2.
Figure 2.. Characterization of a bi-thiazole LOX inhibitor, LXG6403 in terms of potency, selectivity, and inhibition modality (See also Figure S2, Table S1).
A-C. Dose-dependent inhibition of recombinant LOX (A), LOXL1 (B) and LOXL2 (C) proteins upon incubation with increasing doses of LXG6403. D. Dose response curves of LOX and LOXL2 activity upon incubation with increasing doses of LXG6403 using data from A-C. E, F. Dose dependent inhibition of concentrated LOX (rLOX-CM, E) and LOXL2 (rLOXL2-CM, F) upon incubation with increasing doses of LXG6403 or the LOXL2 inhibitor PAT-1251. G. Dose response curves of rLOX-CM and rLOXL2-CM activity upon incubation with increasing doses of LXG6403. H. Time- and concentration-dependent irreversible inhibition by LXG6403. Relative recovery of enzymatic activity after pre-incubating rLOXL2 with 10X, 30X and 50X IC50 of LXG6403 for 30, 60 or 120 min. I, J. Substrate competition assay with rLOX-CM (I) and rLOXL2-CM (J) incubated with increasing doses of LXG6403 at different substrate concentrations. Data represents mean values ± standard deviation (SD) (n=2). P-values were calculated with the unpaired, two-tailed Student’s t test. (* P<0.05; ** P<0.01).
Figure 3.
Figure 3.. Chemosensitization in TNBC cell lines and organoids by the bi-thiazole LOX inhibitor, LXG6403 (See also Figure S2, S3).
A-D. Percentage cellular lysyl oxidase activity in LXG6403-treated TNBC cell lines (n=3). E. DARTS assay showing the binding of LXG6403 to cellular LOX proteins. LXG6403 doses are written in µM. Dashed lines are added to separate different pronase dilutions. F, G. Quantification of band intensities from E at 1:5000 (F) and 1:2000 (G) pronase dilutions. The bands of LOX, LOXL1 and LOXL2 were normalized to input (i.e., no pronase), as well as to the non-targeted protein controls with similar sizes as the LOX proteins (cyclin B1 for LOX and LOXL1, and vinculin for LOXL2) (n=2). H-M. Percent growth inhibition upon 48 hours of doxorubicin (1 µM), cisplatin (40 µM) or paclitaxel (20 nM) treatment in combination with 15 µM of LXG6403 in MDA-MB-231 and HCC1143 cells (n=3–5 for vehicle, n=3 for treated). N, O. Percent growth inhibition (N) and representative images (O) of TNBC PDX organoids upon 9 days treatment with paclitaxel, cisplatin or doxorubicin with or without LXG6403. Data represents mean values ± standard deviation (SD) (n=3). P-values were calculated with One way ANOVA (A-C), one-tailed Student’s t test to show protection of LOX proteins by LXG6403 (F, G), or the unpaired, two-tailed Student’s t test (I-O). (* P<0.05; ** P<0.01; n.s. not significant).
Figure 4.
Figure 4.. Effects of LXG6403 on collagen crosslinking/deposition, drug penetration in 3D culture, and ROS/FAK/DNA damage axis (See also Figure S4).
A, B. Collagen I/Fibronectin staining (A) and insoluble collagen assay (B) in ECM derived from HFF-1 cells treated with vehicle or 15 µM of LXG6403 (n=2). C, D. Collagen I/Fibronectin staining (C) and insoluble collagen assay (D) in decellularized ECM (dECM) incubated with HCC1143 cells treated with 10 µM of 1 or LXG6403 (n=2). E-G. Relative doxorubicin autofluorescence in MDA-MB-231 (E) (n=3), HCC1143 (F) (n=3) cells and TNBC organoids (G) (n=2 for vehicle and LXG6403, and n=4 for doxorubicin and doxorubicin+LXG6403) embedded in collagen I and treated with the LOX inhibitor. H. Relative mitochondrial ROS levels in MDA-MB-231 cells treated with cisplatin with or without LXG6403 (n=4). I. Western blot analysis in MDA-MB-231 cells treated with cisplatin or doxorubicin with or without LXG6403. Actin was used as the loading control. Data represents mean values ± standard deviation (SD). P-values were calculated with the unpaired, two-tailed Student’s t test. (* P<0.05; ** P<0.01).
Figure 5.
Figure 5.. Chemosensitization by LXG6403 in TNBC PDXs in vivo (See also Figure S5, S6, Table S2).
A. Tumor growth in TM01278 TNBC PDX model treated with doxorubicin (2 mg/kg, I.V, weekly), LXG6403 (50 mg/kg, P.O., daily) or their combination (n=6 for vehicle, Doxo, and LXG6403; n=5 for Combo). B. Tumor weights from mice in A. C, D. Quantification (C) and representative images (D) of Picrosirius Red staining in tumors from A (n=15). E. Insoluble collagen content of the tumors from A (n=3 different tumors with 2 replicates). F, G. Quantification (F) and representative images (G) of MP-SHG microscopy imaging from mice in A. H, I. Quantification (H) and representative images (I) of doxorubicin autofluorescence in tumors from A (n=3 different tumors with 2 replicates). Scale bar = 500 µm. J, K. Quantification (J) and representative images (K) of DCFDA staining to show ROS levels in from A (n=3 different tumors with 2 replicates). Scale bar = 500 µm. L. Western blot analysis in tumors from A. Actin was used as the loading control. Data represents mean values ±SD for the bar graphs and box plots, while it represents mean values ± standard error of the mean (SEM) for the tumor volume graph. P-values for the bar graphs and box plots were calculated with the unpaired, two-tailed Student’s t test. Significance for the tumor volume graph was calculated by two-way ANOVA. (* P<0.05; ** P<0.01; n.s., not significant).
Figure 6.
Figure 6.. Detection of the alterations in collagen architecture via ECM-targeted proteomics coupled to MALDI-MSI in LXG6403-treated TNBC PDXs tumors (See also Figure S7, Data S3, S4).
A. Schematic summary of our quantitative pharmacodynamics approach to characterize the global alterations in the ECM composition and organization upon targeting LOX with LXG6403. This figure is prepared by BioRender. B. Heatmap of all proteins identified by the ECM-targeted proteomics, showing differential expression of ECM proteins in different treatment groups of TNBC PDXs. * significant when comparing LXG6403-treated tumors to tumors without LXG6403 treatment; † significant when comparing Doxo+ LXG6403 group to vehicle. The protein/peptide expression values are mapped to colors using the minimum and maximum of each row independently, setting the minimum to 0 and maximum to 1 for all protein/peptides. C. Image segmentation analysis of the MALDI-MSI data in TNBC PDXs under different treatment conditions. Data represents peptides (majorly collagen peptides and smaller fraction of non-collagen ECM proteins) heuristically clustered by spatial location and intensity. Clustering was done using the bisecting k-means method with Manhattan metric. D. The heat map showing the abundance and PTMs of collagen peptides in TM01278 PDX tumors treated with doxorubicin in combination with LXG6403. The protein/peptide expression values are mapped to colors using the minimum and maximum of each row independently, setting the minimum to 0 and maximum to 1 for all protein/peptides. E. Selected modified fibrillar collagen peptides matched by high mass accuracy to sequence information from the same tissues as in C. Peptide modifications are reported with site probability ≥ 95%. Significance among treatment groups was calculated using unpaired two-tailed student’s t-test (n=6). (* P<0.05; ** P<0.01; *** P<0.001). COL6A2, Collagen Type VI Alpha 2 Chain; COL6A3, Collagen Type VI Alpha 3 Chain; Collagen Type V Alpha 2 Chain; POSTN, Periostin; COL5A1, Collagen Type V Alpha 1 Chain; TSBH2-TSBH1, Thrombospondin 2–1; TNC, Tenascin C; TGFB1, Transforming Growth Factor Beta 1, VIM, Vimentin; BGN, Biglycan; FN1, Fibronectin 1; COL1A2, Collagen Type I Alpha 2 Chain; COL6A1, Collagen Type VI Alpha 1 Chain; LUM, Lumican; COL1A1, Collagen Type I Alpha 1 Chain; FGB, Fibrinogen Beta Chain; HIST1H2BA, H2B Clustered Histone 1; ANXA2, Annexin A2; PPIB, Peptidylprolyl Isomerase B; DHX9, DExH-Box Helicase 9; COL3A1, Collagen Type III Alpha 1 Chain; LMNA, Lamin A/C; LRP1, LDL Receptor Related Protein 1; LGALS3, Galectin 3; PEBP1, Phosphatidylethanolamine Binding Protein 1; P4HB, Prolyl 4-Hydroxylase Subunit Beta; GSN, Gelsolin; GST, Dystonin; VDAC1, Voltage Dependent Anion Channel 1; SERPINH1, Serpin Family H Member 1; TLN1, Talin 1; MYH10, Myosin Heavy Chain 10; ENO1, Enolase 1; PDIA6, Protein Disulfide Isomerase Family A Member 6; DCC, DCC Netrin 1 Receptor; PLEC, Plectin.

References

    1. Kagan HM Li W (2003). Lysyl oxidase: properties, specificity, and biological roles inside and outside of the cell. Journal of cellular biochemistry. 88: 660–672. 10.1002/jcb.10413. - DOI - PubMed
    1. Payne SL, Fogelgren B, Hess AR, Seftor EA, Wiley EL, Fong SF, Csiszar K, Hendrix MJ Kirschmann DA (2005). Lysyl oxidase regulates breast cancer cell migration and adhesion through a hydrogen peroxide-mediated mechanism. Cancer Res 65: 11429–11436. 10.1158/0008-5472.CAN-05-1274. - DOI - PubMed
    1. Saatci O, Kaymak A, Raza U, Ersan PG, Akbulut O, Banister CE, Sikirzhytski V, Tokat UM, Aykut G, Ansari SA et al. (2020). Targeting lysyl oxidase (LOX) overcomes chemotherapy resistance in triple negative breast cancer. Nat Commun 11: 2416. 10.1038/s41467-020-16199-4. - DOI - PMC - PubMed
    1. Zhang Q, Jin XS, Yang ZY, Wei M, Zhu XC, Wang P, Liu BY Gu QL (2013). Upregulated expression of LOX is a novel independent prognostic marker of worse outcome in gastric cancer patients after curative surgery. Oncol Lett 5: 896–902. 10.3892/ol.2012.1092. - DOI - PMC - PubMed
    1. Miller BW, Morton JP, Pinese M, Saturno G, Jamieson NB, McGhee E, Timpson P, Leach J, McGarry L Shanks E (2015). Targeting the LOX/hypoxia axis reverses many of the features that make pancreatic cancer deadly: inhibition of LOX abrogates metastasis and enhances drug efficacy. EMBO molecular medicine. 7: 1063–1076 - PMC - PubMed

MeSH terms

LinkOut - more resources