. 2024 Aug 14;32(8):1315-1330.e5.
doi: 10.1016/j.chom.2024.06.014. Epub 2024 Jul 22.

A small intestinal bile acid modulates the gut microbiome to improve host metabolic phenotypes following bariatric surgery

Affiliations

A small intestinal bile acid modulates the gut microbiome to improve host metabolic phenotypes following bariatric surgery

Yingjia Chen et al. Cell Host Microbe. .

Abstract

Bariatric surgical procedures such as sleeve gastrectomy (SG) provide effective type 2 diabetes (T2D) remission in human patients. Previous work demonstrated that gastrointestinal levels of the bacterial metabolite lithocholic acid (LCA) are decreased after SG in mice and humans. Here, we show that LCA worsens glucose tolerance and impairs whole-body metabolism. We also show that taurodeoxycholic acid (TDCA), which is the only bile acid whose concentration increases in the murine small intestine post-SG, suppresses the bacterial bile acid-inducible (bai) operon and production of LCA both in vitro and in vivo. Treatment of diet-induced obese mice with TDCA reduces LCA levels and leads to microbiome-dependent improvements in glucose handling. Moreover, TDCA abundance is decreased in small intestinal tissue from T2D patients. This work reveals that TDCA is an endogenous inhibitor of LCA production and suggests that TDCA may contribute to the glucoregulatory effects of bariatric surgery.

Keywords: bariatric surgery; bile acid-inducible operon; bile acids; lithocholic acid; metabolism; small intestine; taurodeoxycholic acid; type 2 diabetes.


Conflict of interest statement

Declaration of interests S.N.C., D.A.H., E.G.S., and A.S.D. are co-inventors on patents related to this work. A.S.D. is an ad hoc consultant for Axial Therapeutics. S.N.C. is an ad hoc consultant for Metis Therapeutics. E.G.S. is an ad hoc consultant for Vicarious Surgical, Inc. and has educational support/speaker fees from Cine-Med and Intuitive Surgical, Inc. A.T. is a cofounder and consultant for AltrixBio.

Figures
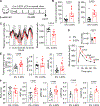
Figure 1.
Figure 1.. LCA treatment increases host glucose intolerance and adiposity
(A) Schematic of LCA feeding experiments. Mice were fed normal chow with or without 0.03% LCA (w/w) for 6 weeks. At week 4, mice were singly housed in CLAMS cages. OGTT was performed at week 6. (B) LCA levels in cecum and colon. (C) LCA-treated mice exhibited decreased RER. (D-E) LCA feeding impaired glucose regulation as determined by OGTT (D) and increased insulin resistance as determined by HOMA-IR (E). (F) LCA feeding increased inguinal (i) WAT, gonadal (g) WAT, mesenteric (m) WAT and retroperitoneal (rp) WAT without altering body weight. Data are presented as pooled mean ± SEM from two independent experiments (n = 12 per group for all experiments except: n = 10 for CLAMS due to limited number of metabolic cages; n=6 per group for mWAT and rpWAT, which were only collected for the second cohort). Student’s t tests was used and Welch’s correction was applied when variances were unequal. For OGTT data, statistical analysis reflects the comparison of treatment groups at individual time points. Data not marked with p value(s) were not significant. See also Figure S1 and Table S1.
Figure 2.
Figure 2.. SG SI contents inhibit LCA production in cecal culture.
(A-C) Factors in DIO mouse SI contents promote LCA production. Sterile-filtered SI contents from DIO mice were added to cecal contents of DIO mice in vitro (no exogenous BA added) (A). Cecal culture LCA levels (B) and baiCD gene expression (normalized to 16S) (C) were significantly higher in cecal cultures incubated with DIO SI contents compared to PBS controls, while the absolute abundance of bacteria (measured as 16S) remained the same (n = 5 per group). (D-F) Factors from post-SG and post-sham SI contents differentially affect LCA production. Filtered SI contents from post-sham or post-SG DIO mice were added to cecal contents of DIO mice in vitro (no exogenous BA added) (D). LCA levels (E) and baiCD gene expression (normalized to 16S) (F) were significantly higher in cecal cultures incubated with sham SI contents, while the absolute abundance of bacteria (measured as 16S) remained the same (E) (n = 3 per group in (E), n = 5 in each group in (F)). (G-J) Factors from post-SG SI contents reduce de novo LCA production but do not affect DCA production. Filtered SI contents from post-sham or post-SG DIO mice were added to cecal contents of DIO mice in vitro in the presence of CDCA-d4 and CA-d4 (100 μM each) (G). Cecal microbiota treated with SG SI contents exhibited significantly lower baiCD gene expression (H). No difference in DCA-d4 production was observed (I). LCA-d4 levels were significantly lower in cecal cultures incubated with SG SI contents (J) (n = 6 per group). (K-M) Factors from post-SG SI contents reduce de novo LCA production to levels similar to those supported by lean mice SI contents but do not affect DCA production. Filtered SI contents from no surgery lean mice, no surgery DIO mice, or post-sham or post-SG DIO mice were added to cecal contents of DIO mice in vitro in the presence of CDCA-d4 and CA-d4 (100 μM each) (K). Cecal microbiota treated with SG and no surgery lean SI contents produced significantly less LCA-d4 than cecal microbiota treated with no surgery DIO and sham SI contents (L), while no differences were observed in DCA-d4 levels (M) (n = 3 in each group). All experiments were reproduced at least three times, each in biological triplicate, with similar results. Data from representative cohorts are presented as mean ± SEM. Welch’s t test was used for two-group comparisons and one-way ANOVA followed by Dunnett’s multiple comparisons was used for four-group comparisons. Data not marked with p value(s) were not significant.
Figure 3.
Figure 3.. SG SI extracts inhibit LCA production in Clostridium scindens ATCC and cecal culture
(A-D) Factors from post-SG SI contents inhibit LCA production by C. scindens ATCC. Filtered SI contents from post-sham or post-SG DIO mice were added to C. scindens ATCC monoculture in the presence of CDCA (100 μM) (A). SI contents did not affect growth of C. scindens ATCC (B). SG SI contents significantly inhibited LCA production (C) and baiCD gene expression (D) (n = 3 per group in B, n = 6 per group in C). (E-H) Soluble molecules from post-SG SI contents inhibit LCA production by C. scindens ATCC. Organic extracts of SI contents from post-sham or post-SG DIO mice were added to C. scindens ATCC monoculture in the presence of CDCA (100 μM) (E). SI extracts did not affect C. scindens ATCC growth (F), but significantly inhibited LCA production (G) and baiCD gene expression (H) (n = 3 per group in F-G, n = 6 per group in H). (I-K) Soluble molecules from post-SG SI contents inhibit LCA production by cecal culture. Organic extracts of SI contents from post-sham or post-SG DIO mice were added to cecal contents of DIO mice in vitro in the presence of CDCA-d4 (100 μM) (I). SI extracts did not affect bacterial growth (J), but significantly inhibited LCA production and baiCD gene expression (K) (n = 3 per group in (J) and (K), LCA concentration, n = 6 per group in (K), baiCD expression). All experiments were reproduced at least three times, each in biological triplicate, with similar results. Data from representative cohorts are presented as mean ± SEM. Welch’s t test was used for two-group comparisons. Data not marked with p value(s) were not significant. See also Figure S2.
Figure 4.
Figure 4.. TDCA is increased in SI post-SG and inhibits LCA production without affecting bacterial growth
(A) BA profiling of SI contents from post-sham or post-SG DIO mice showed a significant increase in TDCA levels post-SG, with no change in other BAs or total BA levels. LCA was below the limit of detection (sham n = 15, SG n = 18). (B-E) Incubation of C. scindens ATCC with TDCA (100 μM) and CA and CDCA (100 μM each) (B) resulted in a significant decrease in LCA production (C) and baiCD gene expression (D) without altering DCA production (E) (n = 6 per group). (F and G) Incubation of C. scindens ATCC with DCA (100 μM) and CDCA (100 μM) resulted in a significant decrease in LCA production (F) and baiCD gene expression (G) (n = 6 per group). (H) Incubation of C. scindens ATCC with 100 μM TLCA and CDCA (100 μM) did not affect LCA production (n = 6 per group). (I) TDCA, DCA or TLCA (100 μM) did not affect C. scindens ATCC growth or viability (CFU/mL) (n = 3 per group). (J-L) TDCA inhibits LCA production by cecal culture. TDCA (100 μM) was added to cecal contents of DIO mice in vitro in the presence of CDCA-d4 (100 μM) (J). TDCA significantly inhibited the production of LCA (K) and baiCD gene expression (L) (n = 3 per group in K, n = 6 per group in L). All experiments were reproduced at least twice, each in biological triplicate, with similar results. Data from representative cohorts are presented as mean ± SEM. Welch’s t test was used for two-group comparison and one-way ANOVA was used for four group comparison. Data not marked with p value(s) were not significant. See also Figure S3.
Figure 5.
Figure 5.. TDCA reduces LCA levels and improves glucose tolerance and hepatic steatosis
(A) Schematic of TDCA dosing experiments. Ten-week-old DIO mice were gavaged with 10 mg/kg TDCA or water daily for 4 weeks. (B and C) LCA levels in the colon (B) and fecal baiCD expression (C) were significantly decreased in TDCA-treated mice. (D) TDCA treatment improved glucose tolerance in DIO mice. OGTT was performed at weeks 2 and 4. (E-F) TDCA treatment decreased liver weight (E) and steatosis (F) in DIO mice. (G) Representative liver images (200x) from each group. Scale bar represents 100 μm. (H) Host gene expression analysis (RNA-seq) performed on the distal ileum revealed decreased expression of genes in oxidative, metabolic, and toxin stress response pathways in TDCA-treated mice. Selected significant differently regulated Gene Ontology (GO) pathways are shown (FDR < 0.05). (I) Heatmaps show expression of selected individual genes from RNA-seq. Genes in red are regulated by Nrf2. Log2fold change, p value, and adjusted p value for each gene are listed in Table S2. For A-G, data are pooled from two independent experiments (n = 12 mice per group) and presented as mean ± SEM. Student’s t test was used and Welch’s correction was applied when variances were unequal. For OGTT data, statistical analysis reflects the comparison of treatment groups at individual time points. Data not marked with p value(s) were not significant. For H-I, 5 mice were randomly selected from each group. See Table S2 for p and adjusted p values. See also Figure S4–S5.
Figure 6.
Figure 6.. Metabolic benefits of TDCA require the gut microbiome and are diminished by LCA feeding.
(A) Schematic of TDCA antibiotic experiments. DIO mice were treated with antibiotics for 10 days then gavaged daily with 10 mg/kg TDCA or water and maintained on antibiotics. Lean, antibiotic-treated mice were gavaged with water as a control. (B-E) A microbiome is necessary for the glucoregulatory effects of TDCA. OGTTs were performed at weeks 2 and 4 (B). No differences in glucose tolerance (B), liver weights (C), or steatosis (D-E) were observed between vehicle- and TDCA-treated DIO mice. TDCA- and vehicle-treated microbiome-depleted DIO mice exhibited impaired glucose clearance compared to microbiome-depleted lean mice, indicating that the DIO mice remained glucose intolerant when treated with antibiotics. For (A-E), data are pooled from two independent experiments (n = 8), and presented as mean ± SEM. In (E), representative liver images (400x) are shown, and scale bar represents 100 μm. One-way ANOVA followed by Tukey’s multiple comparisons was used for OGTT in (B). Statistics reflect comparison of treatment groups at individual time points. P values in black, red and green show differences between water-NC abx and water abx, water-NC abx and TDCA abx, and water abx and TDCA abx, respectively. Student’s t test was used in (C). Data not marked with p value(s) were not significant. (F) Schematic of TDCA+LCA experiments. DIO mice were gavaged with water or 10 mg/kg TDCA daily for 4 weeks. One group of TDCA-treated mice was fed 0.03% LCA (w/w) in food. (G-I) LCA feeding substantially abrogated the beneficial effects of TDCA treatment. OGTTs were performed at weeks 2 and 4 (G). Glycemic curves and their corresponding total AUC were reduced by TDCA treatment and partially reversed by LCA feeding. (H) Liver weight was decreased by TDCA but not TDCA+LCA when compared to the water-treated group. (I) Representative liver images (400x) showed that steatosis was decreased by TDCA treatment, and the protective effects were reversed by LCA feeding. Scale bar represents 100 μm. For (F-I), data are pooled from two independent experiments (n = 8 for water, n = 10 for TDCA and TDCA+LCA), and presented as mean ± SEM. One-way ANOVA followed by Tukey’s multiple comparisons was used. For OGTT data, statistics reflect comparison of treatment groups at individual time points. P values in black, pink and green show differences between water and TDCA, TDCA and TDCA+LCA, and water and TDCA+LCA, respectively. Data not marked with p value(s) were not significant. See also Figure S6.
Figure 7.
Figure 7.. TDCA abundance is decreased in the proximal jejunum of diabetic patients
BAs were quantified in the proximal jejunum of obese patients undergoing bariatric surgery. Patients were grouped as non-diabetic (female n = 30, male n = 10), pre-diabetic (female n = 17, male n = 6) or T2D (female n = 21, male n = 5, female in black and male in red). The abundance of TDCA, measured as the percent TDCA of the total concentration of detectable BAs in the proximal jejunum, was decreased in patients with T2D compared to patients without T2D, while the abundance of TCA was increased. Data are presented as mean ± SEM. One-way ANOVA followed by Tukey’s multiple comparisons was used.

References

    1. Cho N, Kirigia J, Ogurstova K, Reja A. IDF Diabetes Atlas, tenth edition. Published online 2017:1–150. Accessed July 25, 2023. https://www.mendeley.com/catalogue/f3c67578-c2bc-3d94-8dc5-450b49fe6102/...
    1. Feldman H, ElSayed NA, McCoy RG, et al. Standards of Care in Diabetes—2023 Abridged for Primary Care Providers. Clin Diabetes. 2023;41(1):4–31. doi: 10.2337/CD23-AS01 - DOI - PMC - PubMed
    1. Hanipah ZN, Rubino F, Schauer PR. Remission with an Intervention: Is Metabolic Surgery the Ultimate Solution? Endocrinol Metab Clin North Am. 2023;52(1):65–88. doi: 10.1016/j.ecl.2022.09.002 - DOI - PubMed
    1. Eisenberg D, Shikora SA, Aarts E, et al. 2022 American Society of Metabolic and Bariatric Surgery (ASMBS) and International Federation for the Surgery of Obesity and Metabolic Disorders (IFSO) Indications for Metabolic and Bariatric Surgery. Obes Surg 2022 331. 2022;33(1):3–14. doi: 10.1007/S11695-022-06332-1 - DOI - PMC - PubMed
    1. Luo JN, Tavakkoli A. Physiologic Mechanisms of Weight Loss Following Metabolic/Bariatric Surgery. Surg Clin North Am. 2021;101(2):223–237. doi: 10.1016/j.suc.2020.12.006 - DOI - PubMed