. 2024 Jul 23;12(7):e008989.
doi: 10.1136/jitc-2024-008989.

rhIL-7-hyFc, a long-acting interleukin-7, improves efficacy of CAR-T cell therapy in solid tumors

Affiliations

rhIL-7-hyFc, a long-acting interleukin-7, improves efficacy of CAR-T cell therapy in solid tumors

Dan Li et al. J Immunother Cancer. .

Erratum in

Abstract

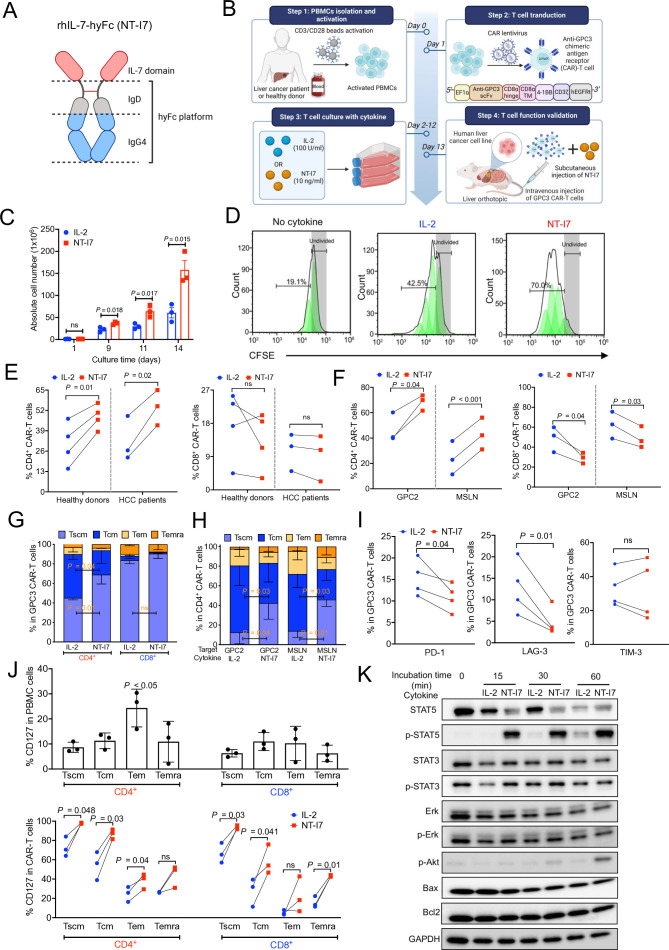
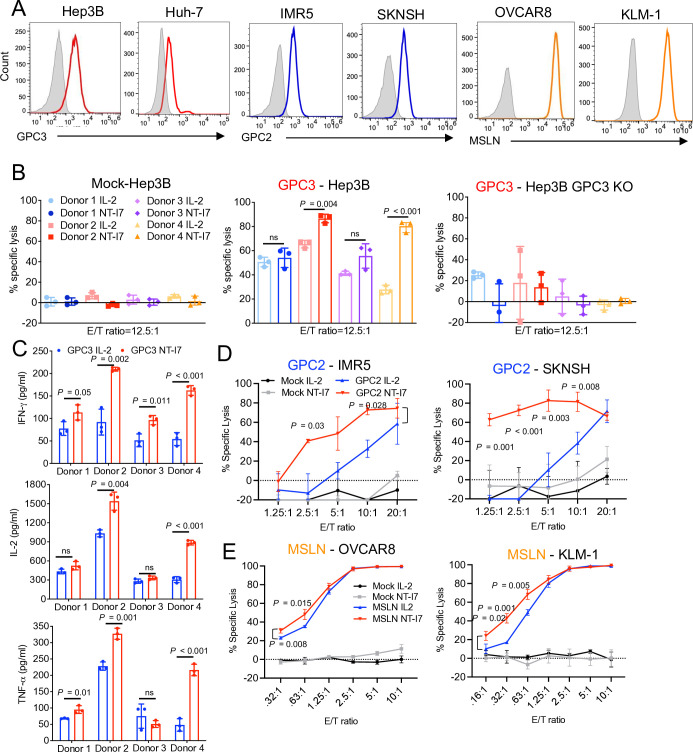
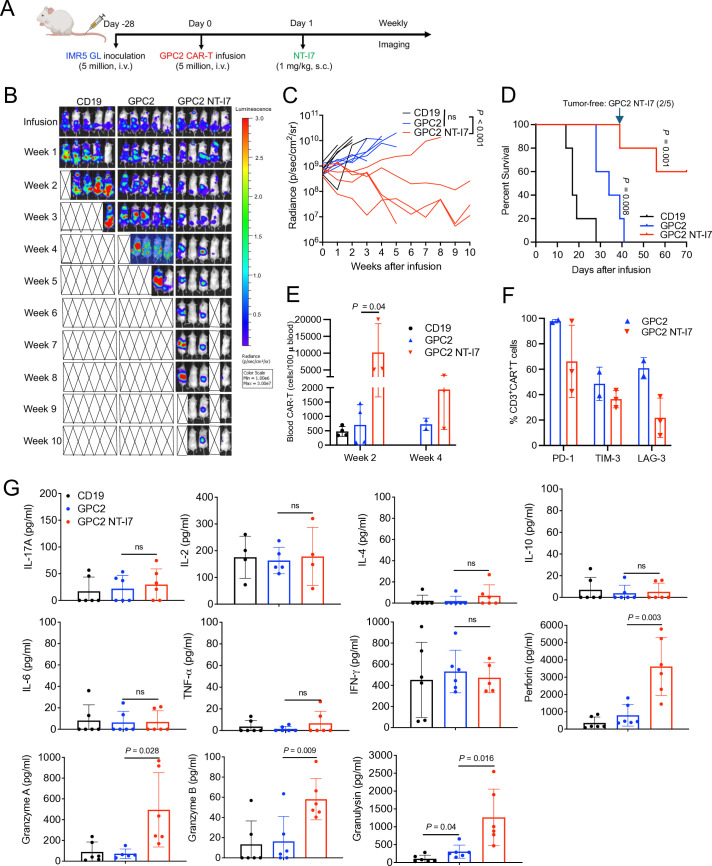
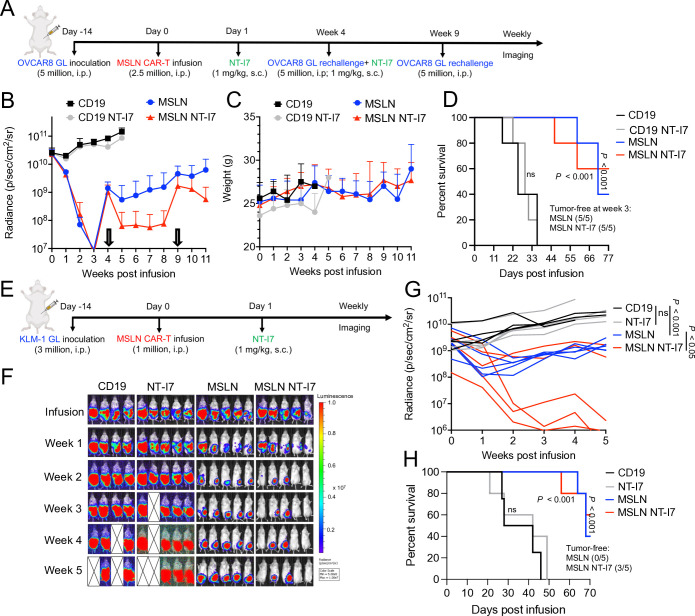
Background: Chimeric antigen receptor T-cell (CAR-T) therapy has achieved remarkable remission in patients with B-cell malignancies. However, its efficacy in treating solid tumors remains limited. Here, we investigated a combination therapy approach using an engineered long-acting interleukin (IL)-7 (rhIL-7-hyFc or NT-I7) and CAR-T cells targeting three antigens, glypican-2 (GPC2), glypican-3 (GPC3), and mesothelin (MSLN), against multiple solid tumor types including liver cancer, neuroblastoma, ovarian cancer, and pancreatic cancer in mice.

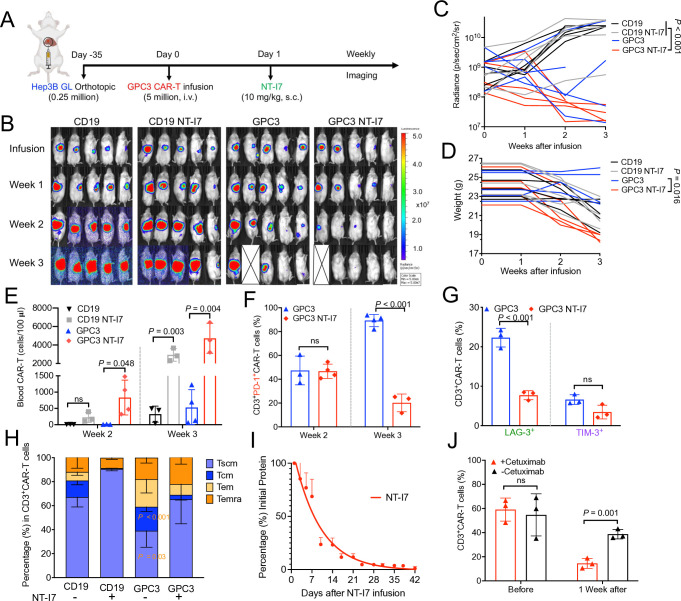
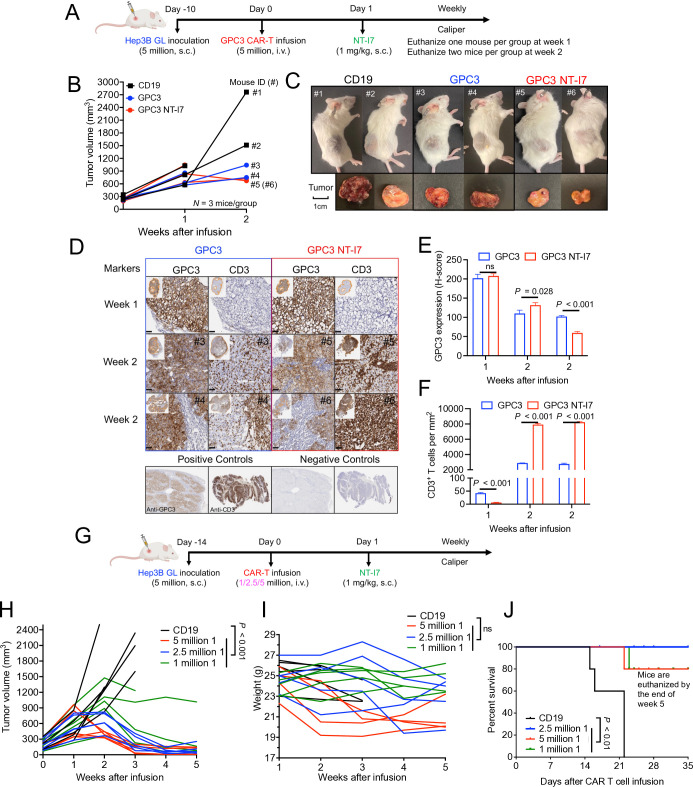
Methods: CAR-T cells targeting GPC2, GPC3, and MSLN were used in combination with NT-I7 to assess the anticancer activity. Xenograft tumor models, including the liver cancer orthotopic model, were established using NOD scid gamma mice engrafted with cell lines derived from hepatocellular carcinoma, neuroblastoma, ovarian cancer, and pancreatic cancer. The mice were monitored by bioluminescence in vivo tumor imaging and tumor volume measurement using a caliper. Immunophenotyping of CAR-T cells on NT-I7 stimulation was evaluated for memory markers, exhaust markers, and T-cell signaling molecules by flow cytometry and western blotting.

Results: Compared with the IL-2 combination, preclinical evaluation of NT-I7 exhibited regression of solid tumors via enhanced occupancy of CD4+ CAR-T, improved T-cell expansion, reduced exhaustion markers (programmed cell death protein 1 or PD-1 and lymphocyte-activation gene 3 or LAG-3) expression, and increased generation of stem cell-like memory CAR-T cells. The STAT5 pathway was demonstrated to be downstream of NT-I7 signaling, mediated by increased expression of the IL-7 receptor expression in CAR-T cells. Furthermore, CAR-T cells improved efficacy against tumors with low antigen density when combined with NT-I7 in mice, presenting an avenue for patients with heterogeneous antigenic profiles.

Conclusion: This study provides a rationale for NT-I7 plus CAR-T cell combination therapy for solid tumors in humans.

Keywords: Adoptive cell therapy - ACT; Chimeric antigen receptor - CAR; Hepatocellular Carcinoma; Monoclonal antibody; Solid tumor.


Conflict of interest statement

Competing interests: MH and DL are inventors on the related patent application no. 63/196556 assigned to the NIH, “Combination immunotherapy for the treatment of glypican-3 (GPC3)-expressing tumors”. MH and DL have patents related to antibody and cell-based immunotherapies and may receive blind royalties from the NIH. MH received research funds from NeoImmuneTech via Cooperative Research and Development Agreement (CRADA) assigned to the NIH. AW, SF-M, and BHL are employees of NeoImmuneTech. The authors declare no other conflicts of interest.

Figures

Figure 1
Figure 1. NT-I7 improved the generation of GPC3 CAR-T cells cultured in vitro. (A) NT-I7 is a homodimeric IL-7 fused to the hyFc platform, which consists of the IgD CH2 region followed by the C-terminal region of the IgG4 domain. (B) Schematic of GPC3 CAR-T cell production and evaluation in HCC mouse models. IL-2 100 U/mL or NT-I7 10 ng/mL were used to culture CAR-T cells in vitro. (C) In vitro proliferation of GPC3 CAR-T cells stimulated with NT-I7 or IL-2 during 14 days after transduction. n=3 healthy donors/group. (D) GPC3 CAR-T cells were labeled with CFSE before being cultured with NT-I7 or IL-2. CFSE dilution was determined by flow cytometry on day 5. n=3 independent experiments. (E–F) The percentage of CD4+ CAR-T and CD8+ CAR-T subpopulations targeting GPC3, GPC2, and MSLN cultured with NT-I7 or IL-2, by flow cytometry on day 9. The GPC3 CAR-T cells (E) were produced from individual healthy donors (n=4) and patients with HCC (n=3). GPC2 and MSLN CAR-T cells (F) were generated from three healthy donors. (G) Relative proportions of stem cell-like memory (Tscm: CD62L+CD45RA+CD95+), central memory (Tcm: CD62L+CD45RA−CD95+), effector memory (Tem: CD62L−CD45RA−CD95+), and terminally differentiated effector memory (Temra: CD62L−CD45RA+CD95+) subsets defined by CD62L, CD45RA, and CD95 expression in GPC3 CAR-T cell subpopulations cultured with NT-I7 or IL-2 on day 9 after transduction. n=3 donors/group. (H) Phenotype of memory CD4+ CAR-T cells targeting GPC2 or MSLN with NT-I7 or IL-2. n=3 donors/group. (I) Expression of exhaustion markers (PD-1, TIM-3, and LAG-3) across different healthy donor-derived GPC3 CAR-T cells cultured with NT-I7 or IL-2 on day 9. n=4 donors/group. (J) The CD127 expression in the relative proportions of Tscm, Tcm, Tem, and Temra subsets in the CD4+ and CD8+ T-cell subpopulations of PBMCs or in vitro cultured GPC3 CAR-T cells. Three donors were used in this analysis. (K) Western blot analysis of T-cell signaling molecules of CAR-T cells on stimulation with NT-I7 or IL-2 at different time courses. Values represent mean±SEM. P value was calculated by two-tailed unpaired Student’s t-test or two-way analysis of variance with Tukey (or Šidák)’s multiple-comparison test; ns, not significant. CAR, chimeric antigen receptor; CFSE, carboxyfluorescein succinimidyl ester; GPC2, glypican-2; GPC3, glypican-3; HCC, hepatocellular carcinoma; hyFc, hybrid Fc; IL, interleukin; LAG-3, lymphocyte-activation gene 3; MSLN, mesothelin; PBMCs, peripheral blood mononuclear cells; PD-1, programmed cell death protein 1; TIM-3, T-cell immunoglobulin and mucin domain 3.
Figure 2
Figure 2. NT-I7 improved the cytotoxicity of CAR-T cells against tumor cells in vitro. (A) Cell surface antigens (GPC3, GPC2, and MSLN) expression in multiple human solid tumor cell lines by flow cytometry. (B) Cytolytic activity of GPC3 CAR-T cells and non-transduced mock-T cells against Hep3B and Hep3B GPC3 KO cells, at an E/T ratio of 12.5:1, for 24 hours of incubation. These cells were produced from four distinct donors. n=3 independent experiments. (C) Cytokines (IFN-γ, IL-2, and TNF-α) released by NT-I7 or IL-2 stimulated GPC3 CAR-T cells (the same four individual donors as in (B)) in the culture supernatant after 24 hours co-culture with Hep3B cells. n=3 independent experiments. (D) Cytolytic activity of GPC2 CAR-T cells against IMR5 and SKNSH cells at different E/T ratios for 72 hours. n=3 independent experiments. GPC2 CAR-T cells were sourced from a separate donor than those used for GPC3 CAR-T cells. (E) Cytolytic activity of MSLN CAR-T cells (derived from the same donor as used for GPC2 CAR-T cells) against OVCAR8 and KLM-1 cells at different E/T ratios for 72 hours. n=3 independent experiments. Values represent mean±SEM. P value was calculated by one-way ANOVA with Tukey’s multiple-comparison test or two-way ANOVA with Šidák’s multiple-comparison test; ns, not significant. ANOVA, analysis of variance; CAR, chimeric antigen receptor; E:T, effector:target; GPC2, glypican-2; GPC3, glypican-3; IFN, interferon; IL, interleukin; KO, knockout; MSLN, mesothelin; TNF, tumor necrosis factor
Figure 3
Figure 3. Enhanced antitumor activity of GPC3 CAR-T cells stimulated with NT-I7 in orthotopic HCC mice. (A) Experimental schema of the orthotopic HCC mouse model. Orthotopic Hep3B GL tumor-bearing NSG mice were intravenous infused with 5×10⁶ GPC3 CAR-T cells or an equivalent amount of irrelevant CD19 CAR-T cells 35 days post tumor inoculation, followed by an s.c. injection of NT-I7 at 10 mg/kg 1 day after CAR-T infusion. n=5 mice/group. The CAR-T cells used in this figure were produced using donor 1’s peripheral blood mononuclear cells. (B–C) Representative tumor bioluminescence image of mice (B) and tumor growth curve (C) measured by bioluminescence in the treatment groups as shown in (A). (D) Individual mouse body weight. (E) Absolute CAR-T cell number (cells/100 µL blood) was identified in mouse peripheral blood after week 2 and week 3 of infusion. (F–G) PD-1 expression in circulating CD3+ CAR-T cells weeks after infusion (F) and the expression of LAG-3 and TIM-3 (G) at week 3 after infusion. (H) Relative proportions of circulating CAR-T cell immunophenotypes treated with or without NT-I7 after 3 weeks after infusion. (I) Mouse serum concentration-time profiles of the NT-I7. A single s.c. injection of NT-I7 10 mg/kg was administered on day 0. n=3 mice/group. (J) Percentage of mouse circulating GPC3 CAR-T cells before or after 1-week treatment with 0.5 mg cetuximab. n=3 mice/group. Values represent mean±SEM. P value was calculated by was calculated by two-way analysis of variance with Tukey’s multiple-comparison test; ns, not significant. CAR, chimeric antigen receptor; GPC3, glypican-3; HCC, hepatocellular carcinoma; s.c., subcutaneous; LAG-3, lymphocyte-activation gene 3; PD-1, programmed cell death protein 1; TIM-3, T-cell immunoglobulin and mucin domain 3; Tcm, central memory T cells; Tem, effector memory T cells; Temra, terminally differentiated effector memory; Tscm, stem cell-like memory T cells.
Figure 4
Figure 4. Enhanced antitumor activity of GPC3 CAR-T cells and low dose NT-I7 against low antigen-density hepatocellular carcinoma tumors. (A) Experimental schema of the Hep3B i.p. xenograft model. The mice were intravenous infused with 5×10⁶ GPC3 CAR-T cells or an equivalent amount of irrelevant CD19 CAR-T cells after 14 days of tumor inoculation, followed by a single s.c. injection of NT-I7 at a gradually decreasing dose regimen (ranging from 10 to 0.25 mg/kg). n=5 mice/group. The CAR-T cells were obtained from the NCI clinical center (source from a different donor). (B–C) Hep3B tumor growth curve measured by bioluminescence in the treatment groups of CAR-T combined with different dosages of NT-I7 at 10–3 mg/kg (B) or 3–0.25 mg/kg (C). (D) The relative proportion of the circulating CD4+ and CD8+ CAR-T cells immunophenotypes in combination with different doses of NT-I7 at week 3 after infusion. n=3 samples/group. (E) Absolute CAR-T number (cells/100 µL blood) was identified in mouse peripheral blood after week 1 and week 3 of infusion. n=3 individual samples/group. (F) The expression of PD-1 and LAG-3 in circulated CD4+ CAR-T and CD8+ CAR-T subpopulations at week 3 of infusion. n=3 samples/group. (G) Experimental schema of the Huh-7 s.c. xenograft model. The mice were intravenous infused with 5×10⁶ GPC3 CAR-T cells, followed by a single s.c. injection of 1 mg/kg NT-I7. The CAR-T cells were obtained from the NCI clinical center (source from a different donor). (H) Huh-7 tumor growth curve was measured by caliper in the CAR-T treatment groups, as shown in (G). n=5 mice/group. (I) The sizes of Huh-7 tumors in individual mice from four different treatment groups at the end of the study. (J) Mouse body weight. (K) Kaplan-Meier survival curve in the Huh-7 s.c. mice. (L) The percentage of tumor-infiltrated CD4+ and CD8+ CAR-T subpopulations recovered from mice spleen. (M) Ex vivo cytotoxicity of mouse-recovered CD19 or GPC3 CAR-T cells against Huh-7 cells for 24 hours incubation. Values represent mean±SEM. P value was calculated by two-tailed unpaired Student’s t-test or two-way analysis of variance with Tukey (or Šidák)’s multiple-comparison test; ns, not significant. CAR, chimeric antigen receptor; E:T, effector:target; GPC3, glypican-3; i.p., intraperitoneal; PD-1, programmed cell death protein 1; s.c., subcutaneous; Tcm, central memory T cells; Tem, effector memory T cells; Temra, terminally differentiated effector memory; Tcm, stem cell-like memory T cells.
Figure 5
Figure 5. NT-I7 enhances GPC3 CAR-T cells efficacy via increased T-cell infiltration in hepatocellular carcinoma tumors. (A) Experimental schema of the Hep3B s.c. xenograft model. Mice were intravenous infused with 5×10⁶ CAR-T cells, followed by a single s.c. injection of 1 mg/kg NT-I7. n=3 mice/group. (B) Hep3B tumor growth curves measured by caliper during 2 weeks of treatment. Mouse ID (#) of individual mice from treatment groups is shown for week 2. The CAR-T cells were produced using donor 1’s PBMCs. (C) Visualization of mice and their respective tumors at week 2. (D) GPC3 CAR-T cell infiltration in Hep3B tumor tissues. Microscopic examination of immunochemical tissue sections were conducted and positive staining was quantified. The combination of anti-CD3 mAb and anti-GPC3 monoclonal antibody was used for primary staining. Scale bar, 50 µm. (E and F) Quantification of GPC3 expression (E) and number of CD3+ T cells (cell number/mm2) (F) in Hep3B tumor tissues in (D). n=3 independent calculation/group. (G) Experimental schematic of Hep3B i.p. model. Mice were intravenous infused with GPC3 CAR-T cells at different doses (5, 2.5, or 1×10⁶), followed by a single s.c. injection of 1 mg/kg NT-I7. n=5 mice/group. The CAR-T cells were produced using donor 1’s peripheral blood mononuclear cells. (H–J) Tumor growth curves (H) and body weight (I) and Kaplan-Meier survival curves (J) of mice from different treatment groups during 5 weeks of treatment. Values represent mean±SEM. P value was calculated by two-tailed unpaired Student’s t-test or two-way analysis of variance with Tukey’s multiple-comparison test; ns, not significant. CAR, chimeric antigen receptor; GPC3, glypican-3; i.p., intraperitoneal; s.c., subcutaneous.
Figure 6
Figure 6. NT-I7 enhances GPC2 CAR-T efficacy against neuroblastoma. (A) Experimental schema of the IMR5 intravenous xenograft model. Mice were intravenous infused with 5×10⁶ CAR-T cells, followed by a single s.c. injection of 1 mg/kg NT-I7. n=5 mice/group. The CAR-T cells were produced using donor 2’s peripheral blood mononuclear cells. (B–C) Representative tumor bioluminescence image of mice (B) and tumor growth curve (C) in the treatment groups as shown in (A). (D) Kaplan-Meier survival curve of mice. (E) Absolute CAR-T cells number (cells/100 µL blood) was identified in mouse peripheral blood after week 2 and week 4 of infusion. n=2/3 samples/group. (F) Expression of PD-1, TIM-3, and LAG-3 in circulating CAR-T cells at week 4 after infusion. n=2/3 individual samples/group. (G) Mouse plasma cytokine detection at week 2 after infusion. n=3 individual mice/group from replicate assays. Values represent mean±SEM. P value was calculated by two-way analysis of variance with Tukey’s multiple-comparison test or a two-tailed unpaired Student’s t-test; ns, not significant. CAR, chimeric antigen receptor; GPC2, glypican-2; IFN, interferon; IL, interleukin; LAG-3, lymphocyte-activation gene 3; PD-1, programmed cell death protein 1; s.c., subcutaneous; TIM-3, T-cell immunoglobulin and mucin domain 3; TNF, tumor necrosis factor.
Figure 7
Figure 7. NT-I7 enhances MSLN CAR-T cells efficacy against ovarian and pancreatic cancer. (A) Experimental schema of the OVCAR8 i.p. xenograft model. Mice were i.p. infused with 2.5×10⁶ CAR-T cells, followed by a single s.c. injection of 1 mg/kg NT-I7. Two tumor rechallenges were performed at weeks 4 and 9 after CAR-T cells infusion. The second injection of NT-I7 was performed after tumor rechallenge at week 4. n=5 mice/group. The CAR-T cells were produced using donor 2’s PBMCs. (B) Tumor growth curves were measured by bioluminescence. (C) Mice body weight in the treatment groups. (D) Kaplan-Meier survival curve of OVCAR8 mice. (E) Experimental schema of the KLM-1 i.p. xenograft model. Mice were i.p. infused with 1×10⁶ CAR-T cells, followed by a single s.c. injection of 1 mg/kg NT-I7. n=4/5 mice/group. The CAR-T cells were produced using donor 2’s PBMCs. (F–G) Representative tumor bioluminescence image of mice (F) and tumor growth curve (G) measured by bioluminescence in the treatment group. (H) Kaplan-Meier survival curve of KML-1 mice. CAR, chimeric antigen receptor; i.p., intraperitoneal; MSLN, mesothelin; PBMCs, peripheral blood mononuclear cells; s.c., subcutaneous.

References

    1. Curran KJ, Pegram HJ, Brentjens RJ. Chimeric antigen receptors for T cell immunotherapy: current understanding and future directions. J Gene Med. 2012;14:405–15. doi: 10.1002/jgm.2604. - DOI - PMC - PubMed
    1. Chen YJ, Abila B, Mostafa Kamel Y. CAR-T: what is next? Cancers (Basel) 2023;15:663. doi: 10.3390/cancers15030663. - DOI - PMC - PubMed
    1. Thistlethwaite FC, Gilham DE, Guest RD, et al. The clinical efficacy of first-generation carcinoembryonic antigen (CEACAM5)-specific CAR T cells is limited by poor persistence and transient pre-conditioning-dependent respiratory toxicity. Cancer Immunol Immunother. 2017;66:1425–36. doi: 10.1007/s00262-017-2034-7. - DOI - PMC - PubMed
    1. Shi D, Shi Y, Kaseb AO, et al. Chimeric antigen receptor-glypican-3 T-cell therapy for advanced hepatocellular carcinoma: results of phase I trials. Clin Cancer Res. 2020;26:3979–89. doi: 10.1158/1078-0432.CCR-19-3259. - DOI - PubMed
    1. Hartmann J, Schüßler-Lenz M, Bondanza A, et al. Clinical development of CAR T cells-challenges and opportunities in translating innovative treatment concepts. EMBO Mol Med. 2017;9:1183–97. doi: 10.15252/emmm.201607485. - DOI - PMC - PubMed

LinkOut - more resources