. 2024 Jul 23;15(1):6222.
doi: 10.1038/s41467-024-50251-x.

CAR T-cells targeting FGFR4 and CD276 simultaneously show potent antitumor effect against childhood rhabdomyosarcoma

Affiliations

CAR T-cells targeting FGFR4 and CD276 simultaneously show potent antitumor effect against childhood rhabdomyosarcoma

Meijie Tian et al. Nat Commun. .

Abstract

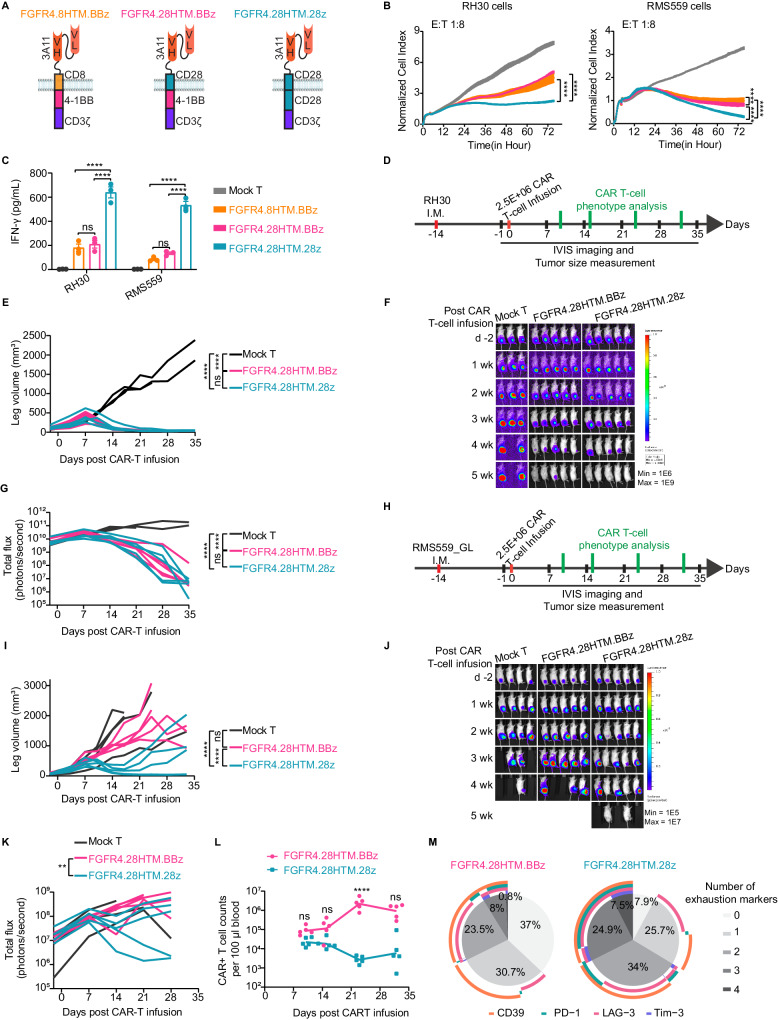
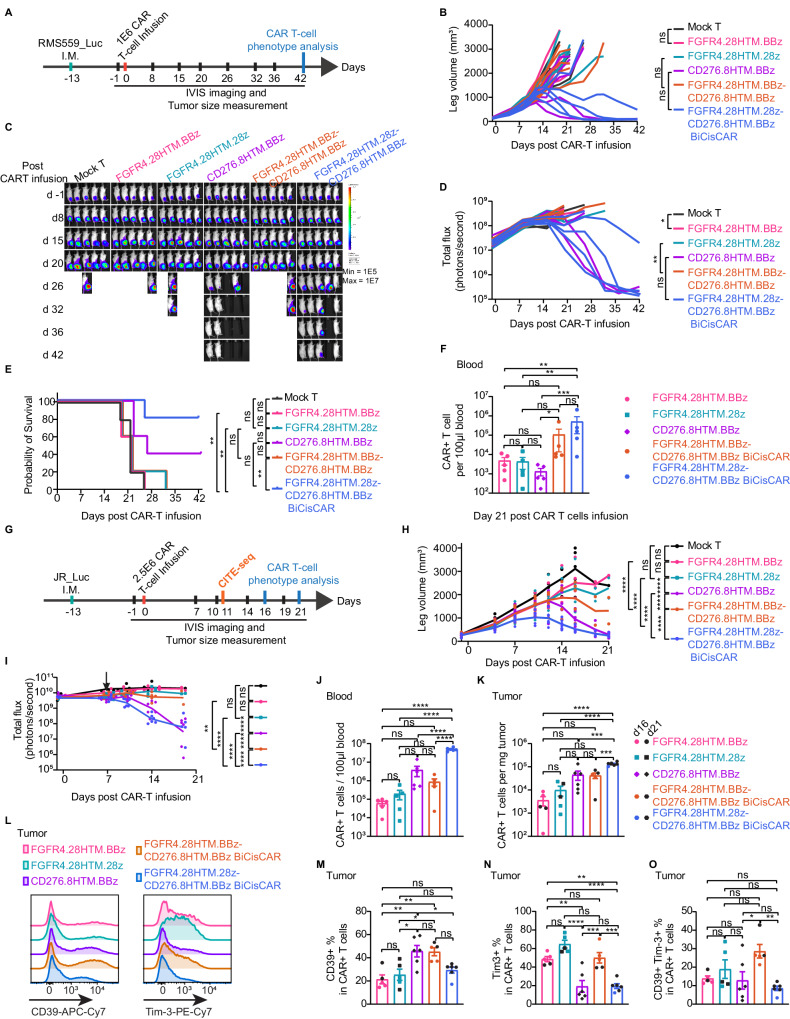
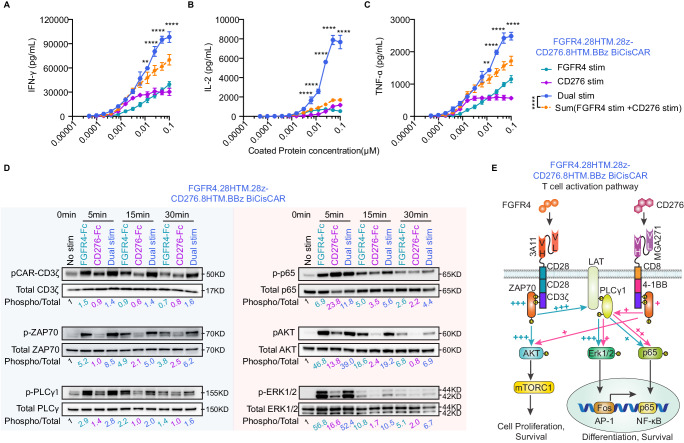
Chimeric antigen receptor (CAR) T-cells targeting Fibroblast Growth Factor Receptor 4 (FGFR4), a highly expressed surface tyrosine receptor in rhabdomyosarcoma (RMS), are already in the clinical phase of development, but tumour heterogeneity and suboptimal activation might hamper their potency. Here we report an optimization strategy of the co-stimulatory and targeting properties of a FGFR4 CAR. We replace the CD8 hinge and transmembrane domain and the 4-1BB co-stimulatory domain with those of CD28. The resulting CARs display enhanced anti-tumor activity in several RMS xenograft models except for an aggressive tumour cell line, RMS559. By searching for a direct target of the RMS core-regulatory transcription factor MYOD1, we identify another surface protein, CD276, as a potential target. Bicistronic CARs (BiCisCAR) targeting both FGFR4 and CD276, containing two distinct co-stimulatory domains, have superior prolonged persistent and invigorated anti-tumor activities compared to the optimized FGFR4-specific CAR and the other BiCisCAR with the same 4-1BB co-stimulatory domain. Our study thus lays down the proof-of-principle for a CAR T-cell therapy targeting both FGFR4 and CD276 in RMS.


Conflict of interest statement

J. K. and A.T.C. are inventors on international patent application no. PCT/US2016/052496. The 3A11 CAR sequence is in this patent application (see https://patents.justia.com/patent/11078286) filed on September 19, 2016, titled “Monoclonal antibodies specific for fibroblast growth factor receptor 4 (FGFR4) and methods of their use”. J.K. and M.T. are inventors on international patent provisional application no. 63/634,330, titled “Chimeric Antigen Receptors Targeting FGFR4 and/or CD276 and Use Thereof for the Treatment of Cancer”. The remaining authors have declared that no conflict of interest exists.

Figures

Fig. 1
Fig. 1. Altering HTM and CSDs significantly improves FGFR4 CAR.
A FGFR4 CARs with different hinge and transmembrane (HTM) or co-stimulatory domains (CSD). B A representative cytotoxicity data from three independent experiments using T-cells from 3 donors at an E:T ratio of 1:8. Two-way repeated measures (RM) ANOVA was performed. ****p < 0.0001. C IFN-γ released by FGFR4 CAR T-cells after a 72-h coculture with RMS cells. Means and SEM of three independent experiments are plotted. ****p < 0.0001, ns not significant, by two-way ANOVA with Tukey’s multiple-comparison test. D Schema of testing CAR T-cells from donor 3 in an RH30 intramuscular (I.M.) xenograft model. Mock or FGFR4 CAR T-cells were infused after 14 days when tumors reached a mean size represented by leg volume of 200 mm3. E Leg volume in an RH30 I.M. xenograft model. Each line represents a mouse (n = 3/5 per group). Two-way RM ANOVA or mixed-effects analysis is used for p values. ****p < 0.0001; ns for not significant. Bioluminescent images (F) or total flux (photons/second, G) of RH30 tumor burden. Two-way RM ANOVA or mixed-effects analysis was used. ****p < 0.0001; ns not significant. H Schema of testing 2.5E6 FGFR4 CAR T-cells from donor 3 in an RMS559 I.M. xenograft mouse model. I Leg volume was measured to represent tumor size (n = 4/5 per group). ****p < 0.0001; ns not significant, by mixed-effects analysis between two groups. Bioluminescent images (J) and total flux (photons/second, K) of RMS559 tumor burden. **p = 0.0026, by mixed-effects analysis. L Expansion of FGFR4 CAR T-cells represented as counts in 100 μl blood from mice bearing RH30 I.M. tumors treated with 2.5E6 CAR T-cells at day 10, 15, 23, and 32 (n = 5). Each dot represents a mouse. Two-way ANOVA with Sidak’s multiple-comparison test was performed at each time point. ****p < 0.0001. M Percentage of CAR T-cells expressing exhaustion markers CD39, PD-1, LAG-3, and TIM-3 at day 32 after T-cell infusion into RH30-bearing mice. Source data is provided as a Source Data file.
Fig. 2
Fig. 2. Direct targeting and establishment of enhancers at the CD276 locus by PAX3-FOXO1 and MYOD1, and heterogenous expression of FGFR4 and CD276 on RMS cell lines, CDXs or PDXs.
A H3K27ac (top), MYOD1 (middle), and PAX3-FOXO1 (bottom) ChIP-seq at the CD276 locus in FP-RMS cell lines (red, dark blue, and purple, respectively) and FN-RMS cell lines (orange, green). B Scatterplot of FGFR4 and CD276 mRNA demonstrated a generally high level of expression for CD276 but more variable expression of FGFR4 in RMS tumors or cells compared to normal tissues. CF Flow cytometry was used to measure FGFR4 or CD276 expression on patient-derived RMS cell lines (C) or patient-derived xenografts (PDX, E) by staining with anti-human FGFR4 antibody (3A11) and anti-human CD276 antibody (MGA271). Co-staining of FGFR4 and CD276 showed heterogeneity of expression of both targets on RMS cells and PDXs. Cell line or PDX IDs and tumor types are listed in the right tables (C and E). Quantification of FGFR4 or CD276 molecules on each RMS cell and CDX (D) or PDXs (F) was performed using a phycoerythrin (PE) fluorescence quantitation kit. Dots with error bars representing mean ± SD in Figure D show protein expression measured by flow cytometric analysis from 3 independent experiments. Source data is provided as a Source Data file.
Fig. 3
Fig. 3. Dual targeting CAR T-cells using distinct CSDs exhibit faster tumor killing with persistence and limited exhaustion.
A Schematic a CD276 targeting CAR, CD276.8HTM.BBz, containing a CD8HTM and 4-1BB CSD. B Leg (tumor) volumes of mice bearing RH30 I.M tumors after 2.5E + 6 CD276.8HTM.BBz CAR T-cell infusion at day 7 post-implantation. Each line represents tumor volume in a mouse (n = 6 in Mock-T group, n = 7 in CD276.8HTM.BBz group). ****p < 0.0001, determined by two-way RM ANOVA. C Representative bioluminescence images of RH30 tumor on day 21 post-CAR T-cells infusion. D Kaplan–Meier survival analysis of RH30 mouse model. **p = 0.0069, by a log-rank test. E Schematic FGFR4 and CD276 dual targeting BiCisCARs. F Cytotoxicity of two BiCisCAR T-cells against RMS559 at an effector (E): target (T) ratio of 1:10. Representative of 3 independent experiments with T cells from 3 donors. Two-way RM ANOVA was performed. ****p < 0.0001. G Schema of testing BiCisCAR T-cells in an RMS559 I.M. xenograft mouse model. H Leg volumes after CAR T-cell infusion. Each line represents tumor volume from a mouse (n = 4 in Mock T group, or n = 5 in CAR T-cell groups). ****p < 0.0001, as determined by two-way RM ANOVA. Bioluminescence images (I) and total flux (J) of RMS559 tumor. ns, not significant, determined by two-way RM ANOVA analysis. Mock T-cells cohort is also used in Fig. 1J, as both experiments were performed at the same time. K Expansion of BiCisCAR T-cells was analyzed as counts per 100 μl blood after 2.5E6 CAR T-cells infusion by flow cytometry at day 11, 15, 23, and 32 (n = 5). **p = 0.0023 as determined by two-way RM ANOVA for comparing two series of BiCisCAR and mock T-cells. Two-way ANOVA with Sidak’s multiple-comparison test was performed to compare CAR T-cell counts of two groups at each time point. ***p = 0.0004. L Fractions of CAR T-cells expressing exhaustion markers CD39, PD-1, LAG-3, and TIM-3 at day 32 after T-cell infusion in the RMS559 I.M. model. Source data is provided as a Source Data file.
Fig. 4
Fig. 4. Dual targeting BiCisCAR with two different CSDs shows enhanced expansion, tumor-infiltrating and limited exhaustion.
A Schema of testing 1E + 6 CAR T-cells in an RMS559 I.M. mouse model. Tumor size (B), bioluminescence images (C), and total bioluminescence flux (D) were monitored for RMS559_Luc orthotopic xenograft. *p = 0.05, **p = 0.0042, by mixed-effects analysis. (E) Kaplan–Meier survival analysis (n = 5 per group). **p < 0.01, ns, not significant, by Log-rank test. F Mean counts ± SEM of CAR+ T-cells (gating from CD45+CD3+ T-cells) in blood 21 days after CAR T-cell infusion. n  =  5 per group. One-way ANOVA with Holm-Sidak’s multiple comparison tests was performed for Log10(CAR+ T-cell counts). *p < 0.05, **p < 0.01, ***p < 0.001. G Schema of testing CAR T-cells in a JR I.M xenograft NSG mouse model. n = 5 per treated group, except for CD276.8HTM.BBz CAR and FGFR4.28HTM.28z-CD276.8HTM.BBz BiCisCAR T-cells group (n = 6) in figures HO. Tumor size (H) or bioluminescence kinetics (I) for JR_Luc orthotopic xenografts. **p = 0.0063, ****p < 0.0001, by mixed-effects analysis. CAR T-cells (CD45+CD3+ CAR+) in blood (J) or tumor (K) 16 or 21 days after CAR T-cell treatment. Data are shown as individual values (shapes) and mean ± SEM (bar graphs). ***p = 0.0002, ****p < 0.0001, by ordinary one-way ANOVA with Tukey’s multiple comparisons tests. Data from day 16 are shown as colored shapes; while data from day 21 are shown as black shapes in Figures K, MO. L A representative flow cytometry experiment detects CD39 and Tim-3 expression on CAR+ T-cells from JR xenografts at day 21 post-infusion. Percentages of CD39+ (M), Tim-3+ (N), and CD39+ Tim-3+ (O) CAR+ T-cells in tumors from mice 16 or 21 days after CAR T-cells infusion. Values are represented as mean ± SEM. *p < 0.05, **p < 0.01, ***p < 0.001, and ****p < 0.0001, by one-way ANOVA with Tukey’s multiple comparisons tests. The full lists of p values in E, F, M, N, and O can be found in the Source Data file. All data is provided in the Source Data file.
Fig. 5
Fig. 5. Multimodal single-cell profiling reveals that the FGFR4.28HTM.28z-CD276.8HTM.BBz BiCisCAR exhibits the highest cytotoxicity activity.
A Workflow of CITE-Seq for simultaneous protein and transcript analysis of tumor-infiltrating CAR T-cells at day 11 post-infusion using a JR IM orthotopic model (created with BioRender.com). ADT, antibody-derived tag; HTO, hashtag oligonucleotide. B WNN UMAP visualization of tumor-infiltrating T-cells from mice treated using five CAR T-cells with biological replicates. Each dot represents a single cell and cell clusters are labeled by numbers. The black perimeter lines encircle the cell clusters C1, C3, and C7, and the percentages of cells in these clusters are shown. C The percentages (means of 2 biological replicates) of each cell subpopulation from five CAR T-cells treated mice. D Volcano plot of differentially expressed genes (DEGs) between the 28HTM.28z-8HTM.BBz BiCisCAR and 4 other CAR T-cells infiltrating in JR I.M xenografts. Genes with an -Log10 P (adjusted P, two-sided nonparametric Wilcoxon rank-sum test) <20 and │log2 fold change│ > 0.5 are shown in red (n = 18). The top 20 highly expressed genes ranked by average log2 fold change are labeled and associated with T-cell cytotoxicity. E Heatmap of these top 20 genes expressed in CAR T-cells isolated from JR I.M xenograft tumors. The FGFR4.28HTM.28z-CD276.8HTM.BBz BiCisCAR T-cells exhibited the highest expression of T-cell cytotoxicity genes among all CAR T cells. The colored scale bar represents z-score values for gene expression. Source data is provided as a Source Data file.
Fig. 6
Fig. 6. BiCisCAR T-cells overcome heterogeneous expression of FGFR4 and CD276 in vivo.
A A representative flow-cytometric plot demonstrating the surface expression of FGFR4 and CD276 in RH30 (red), RH30-FGFR4KO (blue), or RH30-CD276KO (orange) cells. The top table shows the means of FGFR4 or CD276 molecules per cell. BD Cytotoxicity assays using an xCELLigence RTCA show FGFR4.28HTM.28z-CD276.8HTM.BBz BiCisCAR T-cells continued to effectively kill FGFR4KO or CD276KO RH30 cells at an E:T ratio of 1:1. In contrast, FGFR4.28HTM.28z CAR or CD276.8HTM.BBz CAR did not induce cytolysis to FGFR4-KO or CD276KO RH30 cells respectively at an E:T ratio of 1:1. The orange vertical arrows indicate the time point at which CAR T-cells were added to the plate seeded with the target cells. E Schema of the heterogeneous RH30 I.M model infused with 2.5E6 CAR T-cells on day 14 following RH30-FGFR4KO (right) or RH30-CD276KO (left) tumor inoculation (created with BioRender.com). F Representative bioluminescence images of RH30-FGFR4KO or RH30-CD276KO cell growth in the I.M. model before and after CAR T-cell treatment. G, H Tumor size was monitored over 35 days by measuring leg volume before and after receiving mock or CAR T-cell treatment. Each replicate per group (n = 5) is shown. Two-way repeated measures (RM) ANOVA analysis was used to calculate the p-values between each paired group. ***p = 0.0001, ****p < 0.0001, by two-way RM ANOVA. Show bioluminescence kinetics of RH30-FGFR4KO (I) or RH30-CD276KO (J) following CAR T-cell treatment, using total flux values (photons per second). Data is presented as means ± SEM, n = 5. *p = 0.0352, **p = 0.0099, ****p < 0.0001 in I; *p = 0.0278 for Mock T versus CD276.8HTM.BBz, *p = 0.014 for Mock T versus FGFR4.28HTM.28z-CD276.8HTM.BBz BiCisCAR, and ****p < 0.0001 in J, as determined by two-way RM ANOVA. Source data is provided as a Source Data file.
Fig. 7
Fig. 7. Presence of both CD28 and 4-1BB CSDs in FGFR4 and CD276 dual-targeting CAR T-cells leads to heightened and sustained T-cell activation signaling.
IFN-γ (A), IL-2 (B), and TNF-α (C) were released by FGFR4.28HTM.28z-CD276.8HTM.BBz BiCisCAR T-cells following a 20-h stimulation with plate-coated FGFR4-Fc, CD276-Fc, or both proteins. Data are shown as the mean ± SD for 3 independent experiments. The orange dotted line shows the sum of cytokine release after a single protein stimulation. Two-way ANOVA Sidak’s multiple comparisons test was performed for the difference between two proteins dual stimulation and the sum of single stimulation. **p = 0.0069 in A, **p = 0.0052 in C, ****p < 0.0001; ns not significant. D Western blot analyses of CAR-CD3ζ, ZAP70, PLCγ1, p65, Akt and Erk1/2 phosphorylation in FGFR4.28HTM.28z-CD276.8HTM.BBz BiCisCAR T-cells after CAR stimulation (FGFR4-Fc protein for FGFR4 CAR, CD276-Fc protein for B7-H3, or both proteins for dual CAR activation) in a time course experiment. Numbers under the gel images indicate the ratio of signal intensity obtained with phospho-specific antibodies relative to that of the total protein. Relative values were normalized to one of the unstimulated controls. These results are representative of three independent experiments conducted with distinct T-cell donors. E Summary diagram outlining the activation signaling pathway of FGFR4.28HTM.28z-CD276.8HTM.BBz BiCisCAR T-cells following dual stimulation with FGFR4 and CD276. Source data is provided as a Source Data file.

References

    1. Majzner, R. G. & Mackall, C. L. Clinical lessons learned from the first leg of the CAR T cell journey. Nat. Med.25, 1341–1355 (2019). 10.1038/s41591-019-0564-6 - DOI - PubMed
    1. June, C. H., O’Connor, R. S., Kawalekar, O. U., Ghassemi, S. & Milone, M. C. CAR T cell immunotherapy for human cancer. Science359, 1361–1365 (2018). 10.1126/science.aar6711 - DOI - PubMed
    1. Wagner, J., Wickman, E., DeRenzo, C. & Gottschalk, S. CAR T Cell Therapy for Solid Tumors: Bright Future or Dark Reality? Mol. Ther.28, 2320–2339 (2020). 10.1016/j.ymthe.2020.09.015 - DOI - PMC - PubMed
    1. Srivastava, S. & Riddell, S. R. Chimeric Antigen Receptor T Cell Therapy: Challenges to Bench-to-Bedside Efficacy. J. Immunol.200, 459–468 (2018). 10.4049/jimmunol.1701155 - DOI - PMC - PubMed
    1. Labanieh, L., Majzner, R. G. & Mackall, C. L. Programming CAR-T cells to kill cancer. Nat. Biomed. Eng.2, 377–391 (2018). 10.1038/s41551-018-0235-9 - DOI - PubMed

MeSH terms

LinkOut - more resources