. 2024 Jul 23;15(1):6193.
doi: 10.1038/s41467-024-50133-2.

Multi-antigen intranasal vaccine protects against challenge with sarbecoviruses and prevents transmission in hamsters

Affiliations

Multi-antigen intranasal vaccine protects against challenge with sarbecoviruses and prevents transmission in hamsters

Ankita Leekha et al. Nat Commun. .

Abstract

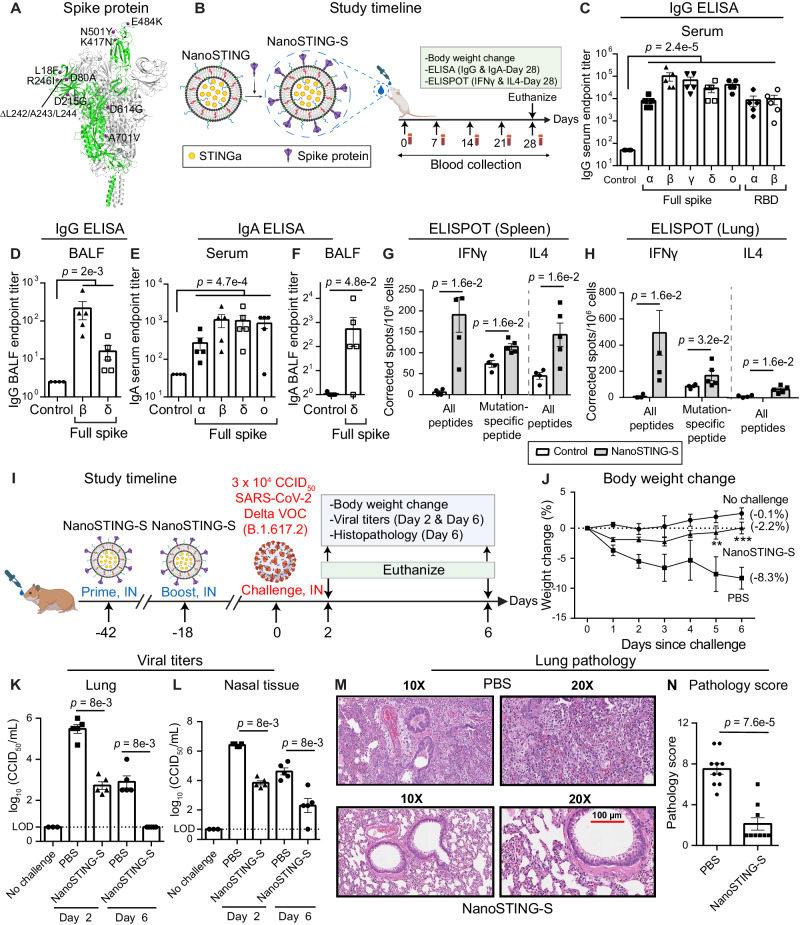
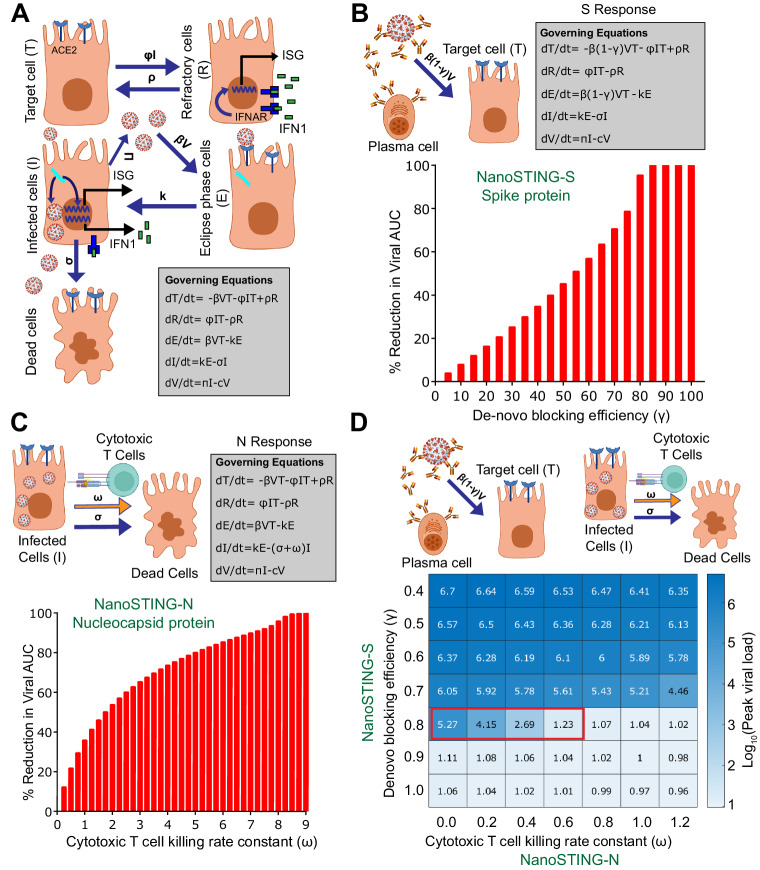
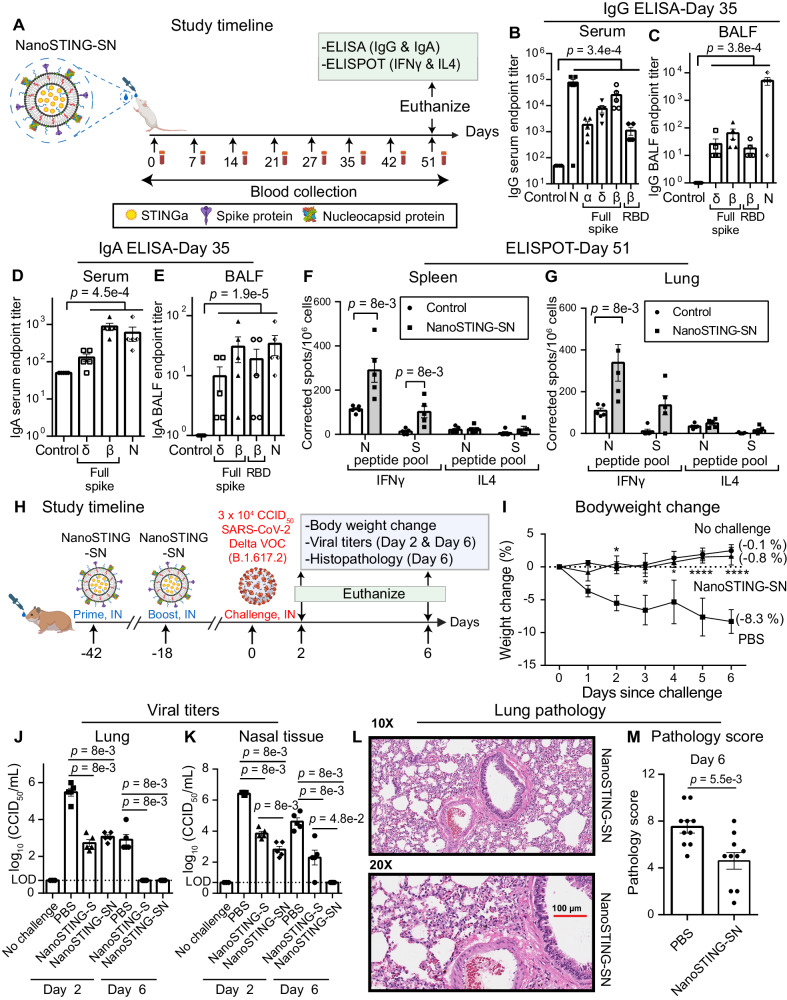
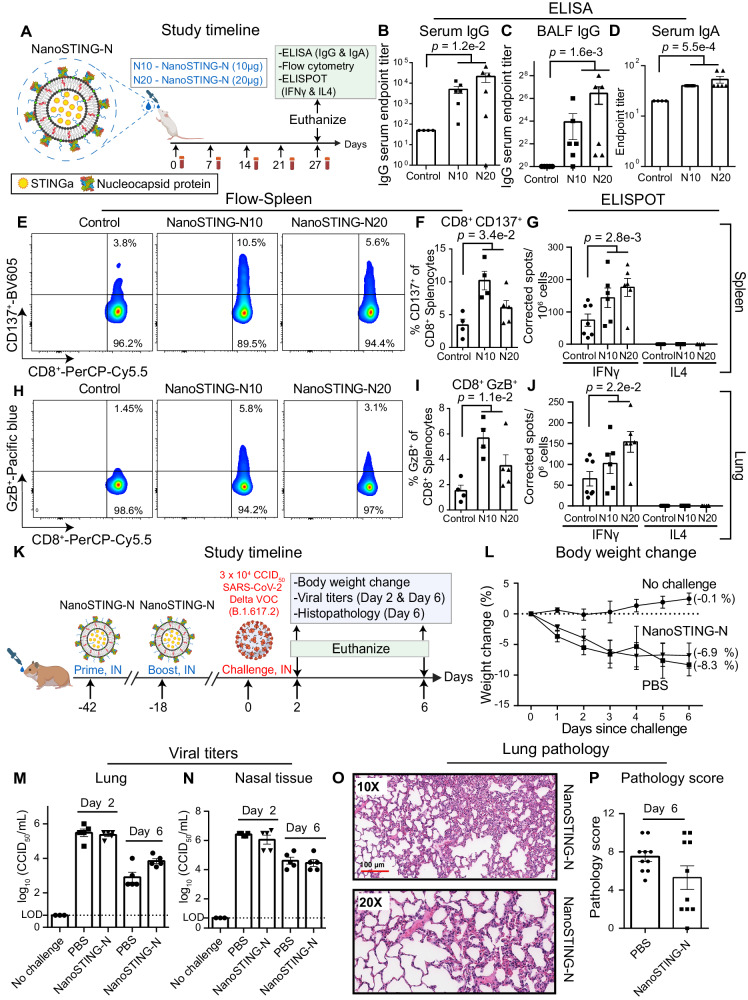
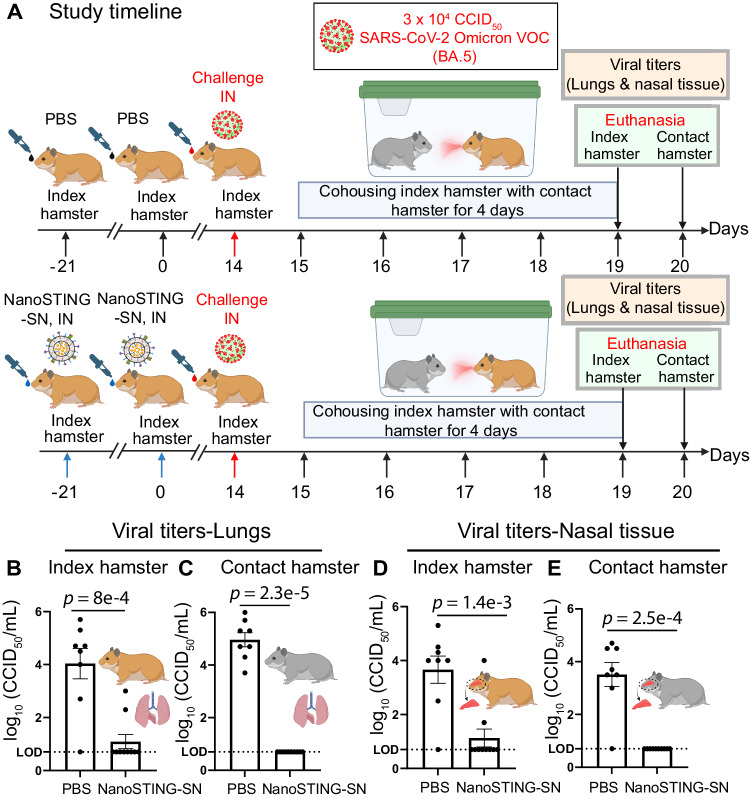
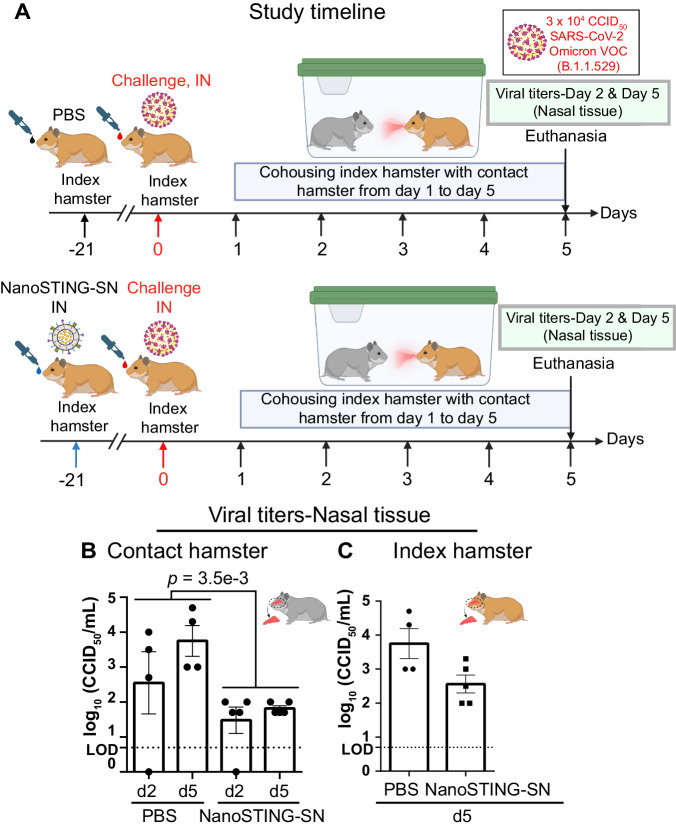
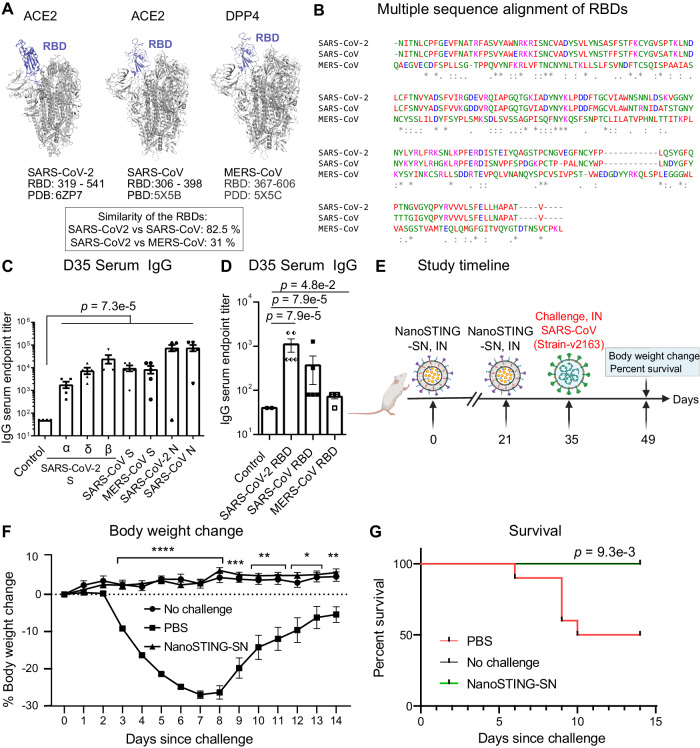
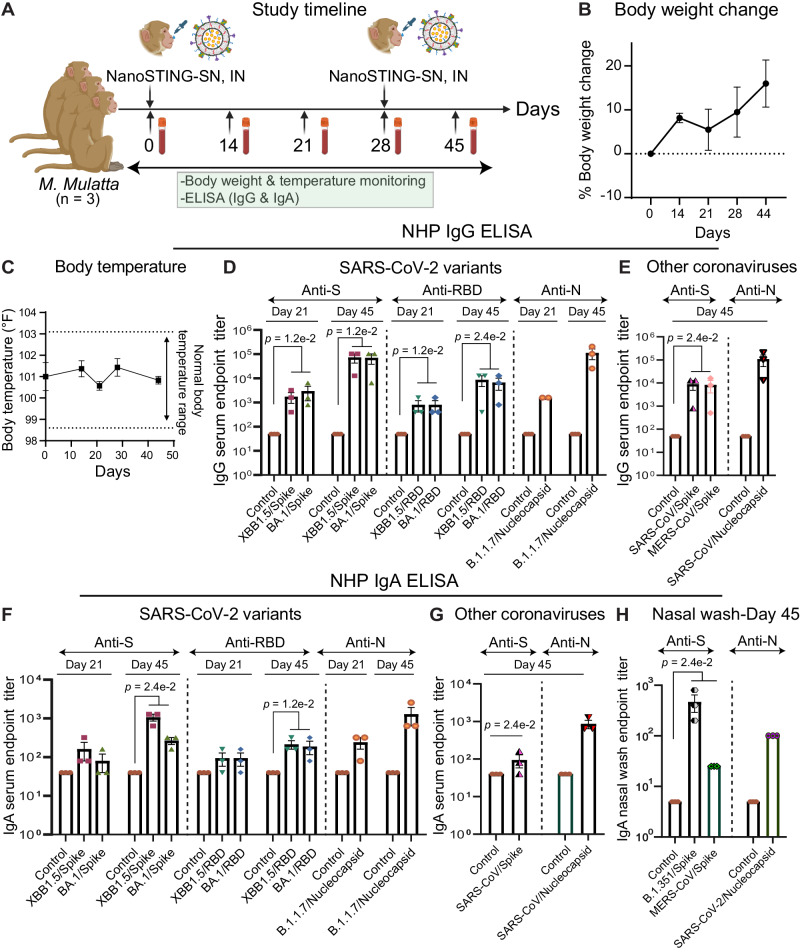
Immunization programs against SARS-CoV-2 with commercial intramuscular vaccines prevent disease but are less efficient in preventing infections. Mucosal vaccines can provide improved protection against transmission, ideally for different variants of concern (VOCs) and related sarbecoviruses. Here, we report a multi-antigen, intranasal vaccine, NanoSTING-SN (NanoSTING-Spike-Nucleocapsid), eliminates virus replication in both the lungs and the nostrils upon challenge with the pathogenic SARS-CoV-2 Delta VOC. We further demonstrate that NanoSTING-SN prevents transmission of the SARS-CoV-2 Omicron VOC (BA.5) to vaccine-naïve hamsters. To evaluate protection against other sarbecoviruses, we immunized mice with NanoSTING-SN. We showed that immunization affords protection against SARS-CoV, leading to protection from weight loss and 100% survival in mice. In non-human primates, animals immunized with NanoSTING-SN show durable serum IgG responses (6 months) and nasal wash IgA responses cross-reactive to SARS-CoV-2 (XBB1.5), SARS-CoV and MERS-CoV antigens. These observations have two implications: (1) mucosal multi-antigen vaccines present a pathway to reducing transmission of respiratory viruses, and (2) eliciting immunity against multiple antigens can be advantageous in engineering pan-sarbecovirus vaccines.


Conflict of interest statement

UH has filed a provisional patent based on the findings of this study. N.V. and L.J.N.C. are co-founders of AuraVax Therapeutics and CellChorus. The remaining authors declare no competing interests.

Figures

Fig. 1
Fig. 1. NanoSTING-S vaccine yields cross-reactive humoral and cellular immunity in mice and provides protective efficacy against Delta VOC in hamsters.
A 3D structure of trimeric S protein (B.1.351) with the twelve mutations indicated (PDB: 7VX1). B Study timeline: We immunized BALB/c mice (n = 5/group) with a single dose of NanoSTING-S intranasally, followed by the collection of serum every week. We monitored the body weights of the animals every week after the immunization. We euthanized the animals by cervical dislocation at day 28 and then collected BALF, serum, lungs, and spleen. Primary endpoints were the body weight change, ELISA (IgG & IgA), and ELISPOT (IFNγ and IL4). Naïve BALB/c mice were used as controls (n = 4/group). CF Humoral immune responses in the serum and BALF were evaluated using S-protein-based IgG & IgA ELISA. Splenocytes (G) or lung cells (H) were stimulated ex vivo with overlapping peptide pools, and IFNγ & IL4 responses were detected using an ELISPOT assay. I Experimental setup for challenge study in hamsters: We immunized Syrian golden hamsters (n = 10/group) intranasally with two doses of NanoSTING-S (first dose at day -42 and second dose at day -18, and challenged the hamsters intranasally with 3 × 104 CCID50 of the SARS-CoV-2 Delta VOC on day 0. Post challenge, we monitored the animals for 6 days for changes in their body weight. We euthanized half of the hamsters on day 2 and the other half at day 6 for histopathology of the lungs, with viral titers of lung and nasal tissues measured on day 2 and day 6. J Percent body weight change of hamsters compared to the baseline at the indicated time intervals. K, L Viral titers were measured by end-point titration assay in lungs and nasal tissues post-day 2 and day 6 of infection. The dotted line indicates the limit of detection of the assay (LOD). M, N Pathology score and a representative hematoxylin and eosin (H & E) image of the lung showing histopathological changes in hamsters treated with NanoSTING-S and PBS; all images were acquired at 10× & 20×; scale bar, 100 µm. Individual data points represent independent biological replicates taken from separate animals; vertical bars show mean values with error bars representing SEM. Each dot represents an individual mouse/hamster. For (CH, K, L, N), the analysis was performed using two-tailed Mann-Whitney U-test: ****p < 0.0001; ***p < 0.001; **p < 0.01; *p < 0.05; ns: not significant. For (J), the data was compared via mixed-effects model for repeated measures analysis. Lines depict group mean body weight change from day 0; error bars represent SEM. For (J), the exact p values comparing the NanoSTING-S group to the PBS group are Day 5: p = 5e-3, Day 6: p = 3.5e-4. Asterisks indicate significance compared to the PBS-treated animals at each time point. Data presented as combined results from two independent experiments [AH: Immunogenicity study with NanoSTING-S, IN: Challenge study with Delta VOC)], each involving one independent animal experiment. Gender was not tested as a variable, and only female mice were included in the study (AH). Gender was tested as a variable with equal number of male and female hamsters included in study (IN). See also Supplementary Figs. 1, 2, 3. B, I Created with BioRender.com released under a Creative Commons Attribution-NonCommercial-NoDerivs 4.0 International license (https://creativecommons.org/licenses/by-nc-nd/4.0/deed.en). Abbreviations - IN Intranasal. Number of animals used: AH: n = 4–5/group, IN: n = 10/group Source data are provided as a Source Data file.
Fig. 2
Fig. 2. Quantitative modeling of the combined immune response against both proteins predict synergistic protection.
A Schematic and governing equations describing viral dynamics without vaccination, with spike protein immunization, or nucleocapsid protein immunization (IFNAR interferon-α/β receptor, IFN1 type-I interferons, ISG interferon-stimulated gene). In the nasal compartment, SARS-CoV-2 (V) infects target epithelial cells (T) at the rate βV. The infected cells remain in an eclipse phase (E) before they become infected cells (I) with a rate constant (k) and start producing viral particles at rate π. The infected cells produce antiviral responses, which make the target cells refractory (R) with a rate constant directly proportional to the number of infected cells (ɸI). The infected cells die with a rate constant (σ). The refractory cells become target cells at rate (ρ). B Upon immunization with spike protein, the rate constant of target cell infection is reduced from βV to βV(1-γ) where γ is antibody-mediated blocking efficiency. The bar graph shows a percent reduction in viral area under the curve (AUC) with increasing de-novo blocking efficiency (antibodies against the spike protein). C Upon immunization with N protein, the rate constant of elimination of infected cells is increased by ω due to the killing of infected cells by T cells. The bar graph shows a percent reduction in viral AUC upon cytotoxic T cell-mediated killing of infected cells. D Upon immunization with N and S protein the rate constant of elimination of infected cells is increased by ω and the rate constant of target cell infection is reduced from βV to βV(1-γ). The heatmap shows the effectiveness of the combined effect of de-novo blocking (S response) and T cell-mediated killing (N response). The red box indicates the synergistic effect of N and S response in achieving multifactorial immunity. See also Supplementary Fig. 5, Supplementary Methods, Sup Note 1. Parts of (AD) were created with BioRender.com released under a Creative Commons Attribution-NonCommercial-NoDerivs 4.0 International license (https://creativecommons.org/licenses/by-nc-nd/4.0/deed.en). Abbreviations - ACE2 angiotensin-converting enzyme 2, ISG interferon-stimulated gene, IFN1 type-I interferons, IFNAR interferon-α/β receptor, AUC area under the curve. Source data are provided as a Source Data file.
Fig. 3
Fig. 3. NanoSTING-SN vaccine yields balanced humoral and cellular immunity targeting both proteins and eliminates virus in both the lung and nasal compartments upon challenge with the SARS-CoV-2 Delta VOC.
A Experimental setup: We immunized two groups (n = 5/group) of mice by intranasal administration with NanoSTING-SN followed by serum collection every week. We monitored the body weights of the animals every week after the immunization until the end of the study. We euthanized the animals at day 51 followed by the collection of BALF, serum, lungs, and spleen. Body weight change, ELISA (IgG & IgA), and ELISPOT (IFNγ and IL4) were primary endpoints. Naïve BALB/c mice were used as controls (n = 5/group). BE Humoral immune responses in the serum and BALF were evaluated using S-protein and N-protein based IgG & IgA ELISA. Splenocytes (F) or lung cells (G) were stimulated ex vivo with overlapping peptide pools, and IFNγ & IL4 responses were detected using an ELISPOT assay. H Timeline for challenge study done in Syrian golden hamsters: We immunized hamsters intranasally with two doses of NanoSTING-SN (first dose at day -42 and the second dose at day -18) and challenged the hamsters intranasally with 3 × 104 CCID50 of the SARS-CoV-2 Delta VOC on day 0. Post-challenge, we monitored the animals for 6 days for changes in their body weight. We euthanized half of the hamsters on day 2 and the other half on day 6 for histopathology of the lungs, with viral titers of lung and nasal tissues measured on day 2 and day 6. I Percent body weight change of hamsters compared to the baseline at the indicated time intervals. J, K Viral titers were measured by end-point titration assay in lungs and nasal tissues post-day 2 and day 6 of infection. The dotted line indicates LOD. L, M A representative hematoxylin and eosin (H & E) image and pathology scores of the lung showing histopathological changes in hamsters treated with NanoSTING-SN and PBS; all images were acquired at 10x & 20×; scale bar, 100 µm. Individual data points represent independent biological replicates taken from separate animals; vertical bars show mean values with error bars representing SEM. Each dot represents an individual mouse/hamster. For (BG, J, K, M), the analysis was performed using a two-tailed Mann-Whitney U-test: ****p < 0.0001; ***p < 0.001; **p < 0.01; *p < 0.05; ns: not significant. For (I), the data was compared via mixed-effects model for repeated measures analysis. Lines depict group mean body weight change from day 0; error bars represent SEM. For (I), the exact p values comparing the NanoSTING-SN group to the PBS group are Day 2: p = 1.9e-2, Day 3: p = 1.0e-2, Day 4: p = 2.0e-2, Day 5: p = 7.3e-5, Day 6: p = 1.3e-5. Asterisks indicate significance compared to the PBS-treated animals at each time point. Data presented as combined results from two independent experiments [AG: Immunogenicity study with NanoSTING-SN, HM: Challenge study with Delta VOC], each involving one independent animal experiment. Gender was not tested as a variable, and only female mice were included in the study (AG). Gender was tested as a variable with equal number of male and female hamsters included in the study (HM). See also Supplementary Figs. 6, 7. A, H were created with BioRender.com released under a Creative Commons Attribution-NonCommercial-NoDerivs 4.0 International license (https://creativecommons.org/licenses/by-nc-nd/4.0/deed.en). Abbreviations: IN Intranasal. Number of animals used: AG: n = 4–5/group, HM: n = 10/group Source data are provided as a Source Data file.
Fig. 4
Fig. 4. NanoSTING-N vaccine yields durable humoral and cellular immunity in mice but is insufficient to confer protection against the highly infectious Delta VOC in hamsters.
A Experimental setup: We immunized two groups (n = 5–6/group) of mice by intranasal administration with NanoSTING-N10 or NanoSTING-N20 followed by serum collection every week. We monitored the body weights of the animals every week after the immunization until the end of the study. We euthanized the animals at day 27 and then collected BALF, serum, lungs, and spleen. Body weight change, ELISA (IgG & IgA), flow cytometry (CD8+ T cells), and ELISPOT (IFNγ and IL4) were used as primary endpoints. Naïve BALB/c mice were used as controls (n = 4/group). B, C Humoral immune responses in the serum and BALF were evaluated using N-protein-based IgG ELISA. D Humoral immune responses in the serum were evaluated using N-protein-based IgA ELISA. Splenic CD8+ T cells were stimulated ex vivo with overlapping peptide pools, and (E, F) CD137 expression was quantified by flow cytometry (G) IFNγ & IL4 responses were detected using an ELISPOT assay. Splenic CD8+ T cells were stimulated ex vivo with overlapping peptide pools, and (H, I) GzB expression was quantified by flow cytometry (J) IFNγ & IL4 ESLIPOT from lung cells stimulated ex vivo with indicated peptide pools. K Experimental setup for challenge studies in Syrian golden hamsters. We immunized hamsters (n = 10/group) intranasally with two doses of NanoSTING-N (first dose at day -42 and the second dose at day -18 and challenged the hamsters intranasally with 3 × 104 CCID50 of the SARS-CoV-2 Delta VOC on day 0. Post-challenge, we monitored the animals for 6 days for changes in body weight. We euthanized half of the hamsters on day 2 and the other half on day 6 for histopathology of the lungs, with viral titers of lung and nasal tissues measured on day 2 and day 6. L Percent body weight change of hamsters compared to the baseline at the indicated time intervals. M, N Viral titers were measured by end-point titration assay in lungs and nasal tissues post-day 2 and day 6 of infection. The dotted line indicates LOD. O, P Pathology score and a representative H & E image of the lung showing histopathological changes in hamsters treated with NanoSTING-N and PBS; all images were acquired at 10x & 20×; scale bar, 100 µm. Individual data points represent independent biological replicates taken from separate animals; vertical bars show mean values with error bars representing SEM. Each dot represents an individual mouse/hamster. For (BG, J, K, M), the analysis was performed using two-tailed Mann-Whitney U-test: ****p < 0.0001; ***p < 0.001; **p < 0.01; *p < 0.05; ns: not significant. For (I), the data was compared via mixed-effects model for repeated measures analysis. Lines depict group mean body weight change from day 0; error bars represent SEM. Asterisks indicate significance compared to the PBS-treated animals at each time point. Data presented as combined results from two independent experiments [AJ: Immunogenicity study with NanoSTING-N, KP: Challenge study with Delta VOC)], each involving one independent animal experiment. Gender was not tested as a variable for the study, and only female mice were used (AG). Gender was tested as a variable with an equal number of male and female hamsters included in the study (HM). See also Supplementary Figs. 8–12. A, K were created with BioRender.com released under a Creative Commons Attribution-NonCommercial-NoDerivs 4.0 International license (https://creativecommons.org/licenses/by-nc-nd/4.0/deed.en). Abbreviations: GzB Granzyme, IN intranasal, N10 NanoSTING with 10 µg of Nucleocapsid protein, N20 NanoSTING with 10 µg of Nucleocapsid protein. Number of animals used: AJ: n = 4–6/group, KP: n = 10/group Source data are provided as a Source Data file.
Fig. 5
Fig. 5. Intranasal vaccination with NanoSTING-SN abolishes transmission of SARS-CoV-2 Omicron (BA.5) VOC in hamsters.
A Experimental setup: We immunized hamsters with a dual dose of the intranasal NanoSTING-SN vaccine (n = 10/group) or PBS (n = 8/group) 5 weeks (day-21) and 2 weeks (Day 0) prior to infection with ∼3 × 104 CCID50 of SARS-CoV-2 Omicron VOC (BA.5) [Day 14]. One day after the viral challenge, we co-housed the index hamsters in pairs with contact hamsters for 4 days in clean cages. We euthanized the index hamsters on day 4 of cohousing and contact hamsters on day 5 of cohousing. Viral titers in the lungs of the index and contact hamsters were used as primary endpoints. B, C Infectious viral particles in the lung tissue of contact and index hamsters at day 5 after viral administration post-infection were measured by end-point titration assay. The dotted line indicates LOD. D, E Infectious viral particles in the nasal tissue of contact and index hamsters at day 5 after viral administration post-infection were measured by end-point titration assay. The dotted line indicates LOD. Individual data points represent independent biological replicates taken from separate animals; vertical bars show mean values with error bars representing SEM. Each dot represents an individual hamster. The analysis was performed using two-tailed Mann-Whitney U-test: ****p < 0.0001; ***p < 0.001; **p < 0.01; *p < 0.05; ns not significant. Asterisks indicate significance compared to the PBS-treated animals at each time point. Data presented as combined results from one independent experiment. Gender was tested as a variable, and an equal number of male and female hamsters were included in the study. A and parts of (BE) were created with BioRender.com released under a Creative Commons Attribution-NonCommercial-NoDerivs 4.0 International license (https://creativecommons.org/licenses/by-nc-nd/4.0/deed.en). Number of animals used: n = 8–10/group Source data are provided as a Source Data file.
Fig. 6
Fig. 6. Single dose intranasal administration of NanoSTING-SN limits transmission and viral replication of SARS-CoV-2 Omicron (B.1.1.529) VOC in hamsters.
A Experimental setup: We immunized hamsters with a single dose of the intranasal NanoSTING-SN (n = 10/group) vaccine or PBS (n = 8/group) 3 weeks prior to infection with ∼3 × 104 CCID50 of SARS-CoV-2 Omicron VOC (B.1.1.529). One day after the viral challenge, we co-housed the index hamsters in pairs with contact hamsters for 4 days in clean cages. We euthanized the contact and index hamsters on day 4 of cohousing. Viral titers in the nasal tissue of the index and contact hamsters were used as primary endpoints. B, C Infectious viral particles in the nasal tissue of contact and index hamsters at day 5 after viral administration post-infection were measured by end point titration assay. The dotted line indicates LOD. Individual data points represent independent biological replicates taken from separate animals; vertical bars show mean values with error bars representing SEM. Each dot represents an individual hamster. The analysis was performed using two-tailed Mann-Whitney U-test: ****p < 0.0001; ***p < 0.001; **p < 0.01; *p < 0.05; ns not significant. Asterisks indicate significance compared to the PBS-treated animals at each time point. Data presented as combined results from one independent experiment. Gender was tested as a variable with an equal number of male and female hamsters included in study. A and parts of (B, C): Created with BioRender.com released under a Creative Commons Attribution-NonCommercial-NoDerivs 4.0 International license (https://creativecommons.org/licenses/by-nc-nd/4.0/deed.en). Abbreviations: d2 Day 2, d5 Day 5, IN Intranasal. Number of animals used: n = 8–10/group. Source data are provided as a Source Data file.
Fig. 7
Fig. 7. Immunization of mice with NanoSTING-SN vaccine yields cross-reactive humoral immunity against betacoronaviruses and confers protection against SARS-CoV.
A 3D structure of SARS-CoV-2, SARS-CoV, and MERS-CoV spike proteins showing binding to respective receptors (PDB: 6ZP7, 5X5B, 5X5C). B Multiple sequence alignment of RBDs of SARS-CoV-2, SARS-CoV, and MERS-CoV spike (S) proteins. GenBank accession numbers are QHR63250.1 (SARS-CoV-2 S), AY278488.2 (SARS-CoV S), and AFS88936.1 (MERS-CoV S). C, D Humoral immune responses in the serum were evaluated using N and S protein-based IgG ELISA. E Experimental set up for SARS-CoV challenge studies in mice. We immunized mice (n = 10/group) intranasally with one dose of NanoSTING-SN on day 0 and a second dose on day 21 and challenged the mice intranasally with the SARS-CoV (v2163 strain) on day 35. Post-challenge, we monitored the animals for 14 days for changes in body weight and survival. F Percent body weight change of mice compared to the baseline at the indicated time intervals. G Percent survival of mice compared to the baseline at the indicated time intervals. Individual data points represent independent biological replicates taken from separate animals; vertical bars show mean values with error bars representing SEM. Each dot represents an individual mouse. For (C, D), the analysis was performed using two-tailed Mann-Whitney U-test: ****p < 0.0001; ***p < 0.001; **p < 0.01; *p < 0.05; ns not significant. For (F), the data was compared via mixed-effects model for repeated measures analysis. Lines depict group mean body weight change from day 0; error bars represent SEM. For (F), the exact p values comparing the NanoSTING-SN group to the Placebo group are Day 3: p = 2.7e-7, Day 4: p = 1.9e-10, Day 5: p = 7.1e-12, Day 6: p < 1.0e-15, Day 7: p = 2.9e-13, Day 8: p = 1.2e-8, Day 9: p = 3.8e-4, Day 10: p = 8.0e-3, Day 11: p = 9.3e-3, Day 12: p = 2.2e-2, Day 13: p = 3.3e-2, Day 14: p = 7.4e-3. Asterisks indicate significance compared to the PBS-treated animals at each time point. For (G), we compared survival percentages between NanoSTING-SN and PBS-treated animals using the Log-Rank Test (Mantel-Cox). Data presented as combined results from two independent experiments [C, D: Immunogenicity study with NanoSTING-SN, EG: Challenge study with SARS-COV], each involving one independent animal experiment. Gender was not tested as a variable, and only female mice were used for the study (C, D). Gender was tested as a variable with an equal number of male and female mice included in the study (EG). See also Supplementary Figs. 13, 14. E Created with BioRender.com released under a Creative Commons Attribution-NonCommercial-NoDerivs 4.0 International license (https://creativecommons.org/licenses/by-nc-nd/4.0/deed.en). Abbreviations: ACE2 angiotensin-converting enzyme 2, D35 Day 35, IN Intranasal. Number of animals used: C, D: n = 4–5/group, EG: n = 10/group Source data are provided as a Source Data file.
Fig. 8
Fig. 8. NanoSTING-SN confers durable humoral immunity in rhesus macaques.
A Experimental setup: We administered two doses of the intranasal NanoSTING-SN vaccine (n = 3/group) 28 days apart to rhesus macaques. We collected the sera on days 0, 7, 14, 28, and 44 to evaluate humoral immune responses. We monitored the body weights of the animals every week after the immunization until the end of the study. Body weight change, body temperature change, and ELISA (IgG & IgA) were used as primary endpoints. Pre-immunization sera was used as control. B Percent body weights change for the non-human primates. C Body temperature changes for the non-human primates. D, E Humoral immune responses in the serum were evaluated using N and S protein-based IgG ELISA. F, G Humoral immune responses in the serum were evaluated using N and S protein-based IgA ELISA. H Humoral immune responses in the nasal washes were evaluated using N and S protein-based IgA ELISA. Individual data points represent independent biological replicates taken from separate animals; vertical bars show mean values with error bar representing SEM. Each dot represents an individual animal. For (DH), the analysis was performed using two-tailed Mann-Whitney U-test: ****p < 0.0001; ***p < 0.001; **p < 0.01; *p < 0.05; ns not significant. Data presented as combined results from one independent experiment. Two male and one female NHPs were used for the study. See also Supplementary Fig. 15. A Created with BioRender.com released under a Creative Commons Attribution-NonCommercial-NoDerivs 4.0 International license (https://creativecommons.org/licenses/by-nc-nd/4.0/deed.en). Abbreviations: IN Intranasal. Number of animals used: n = 3/group Source data are provided as a Source Data file.

References

    1. Lopez Bernal, J. et al. Effectiveness of Covid-19 vaccines against the B.1.617.2 (Delta) variant. N. Engl. J. Med.385, 585–594 (2021). 10.1056/NEJMoa2108891 - DOI - PMC - PubMed
    1. Tang, P. et al. BNT162b2 and mRNA-1273 COVID-19 vaccine effectiveness against the SARS-CoV-2 Delta variant in Qatar. Nat. Med.27, 2136–2143 (2021). 10.1038/s41591-021-01583-4 - DOI - PubMed
    1. Planas, D. et al. Reduced sensitivity of SARS-CoV-2 variant Delta to antibody neutralization. Nature596, 276–280 (2021). 10.1038/s41586-021-03777-9 - DOI - PubMed
    1. Pouwels, K. B. et al. Effect of Delta variant on viral burden and vaccine effectiveness against new SARS-CoV-2 infections in the UK. Nat. Med.27, 2127–2135 (2021). 10.1038/s41591-021-01548-7 - DOI - PMC - PubMed
    1. Mlcochova, P. et al. SARS-CoV-2 B.1.617.2 Delta variant replication and immune evasion. Nature599, 114–119 (2021). 10.1038/s41586-021-03944-y - DOI - PMC - PubMed

MeSH terms