. 2024 Jul 23;15(1):6213.
doi: 10.1038/s41467-024-50006-8.

Obesity increases genomic instability at DNA repeat-mediated endogenous mutation hotspots

Affiliations

Obesity increases genomic instability at DNA repeat-mediated endogenous mutation hotspots

Pallavi Kompella et al. Nat Commun. .

Abstract

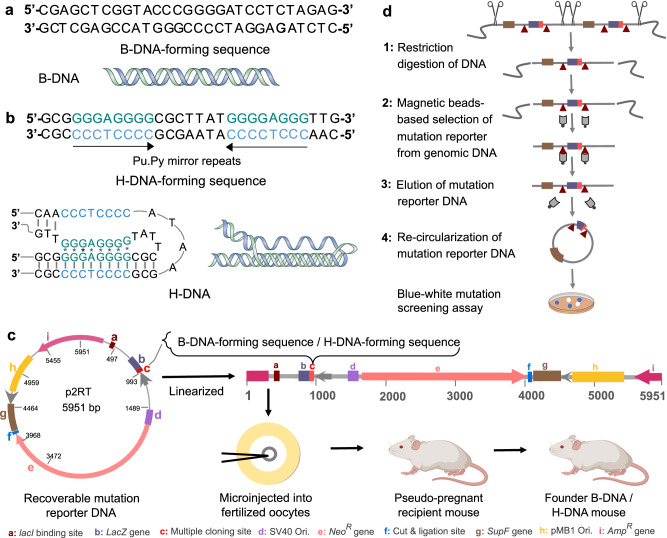
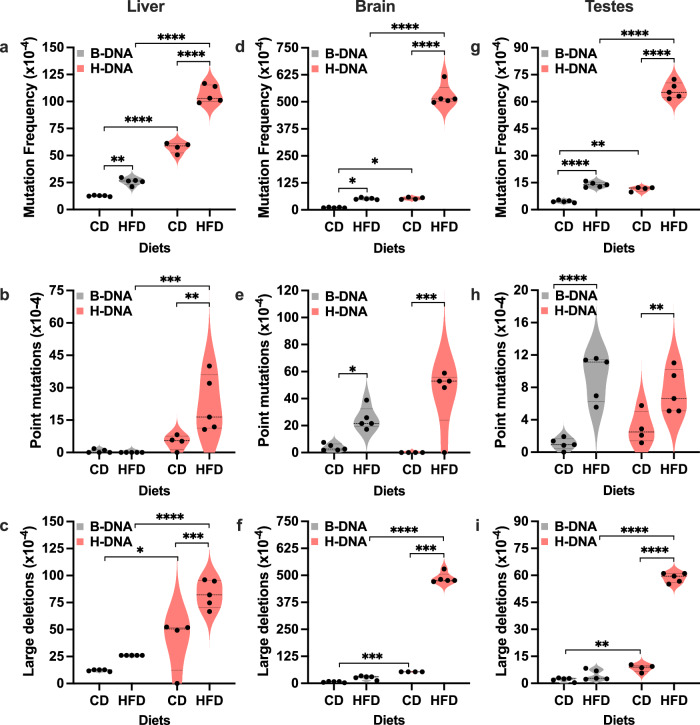
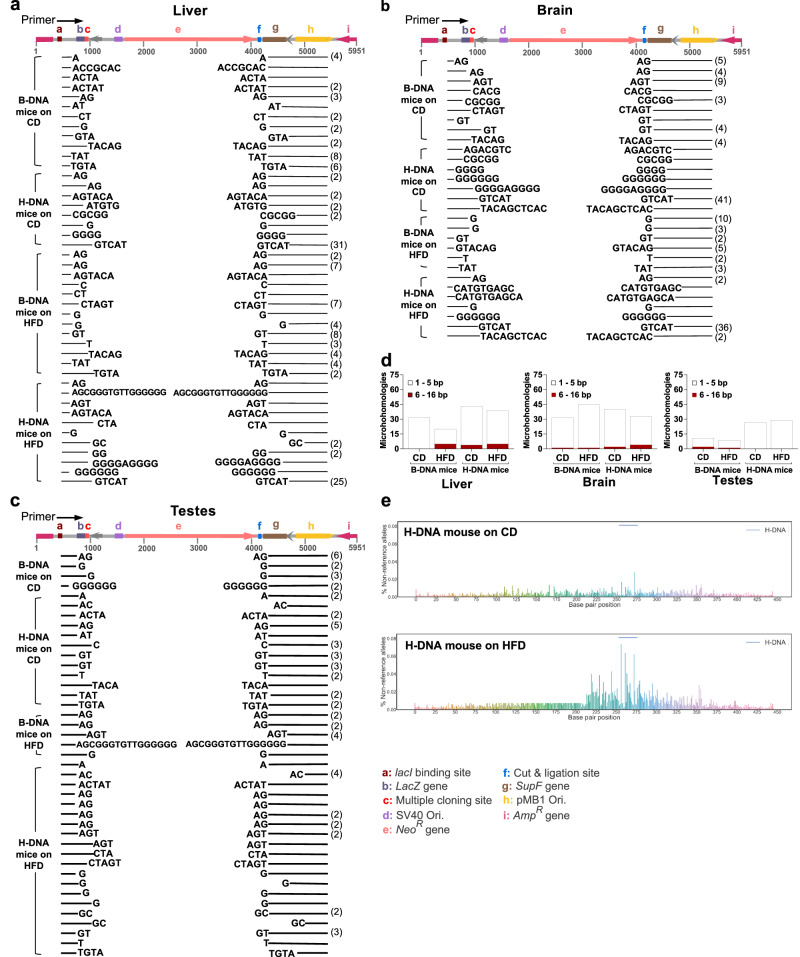
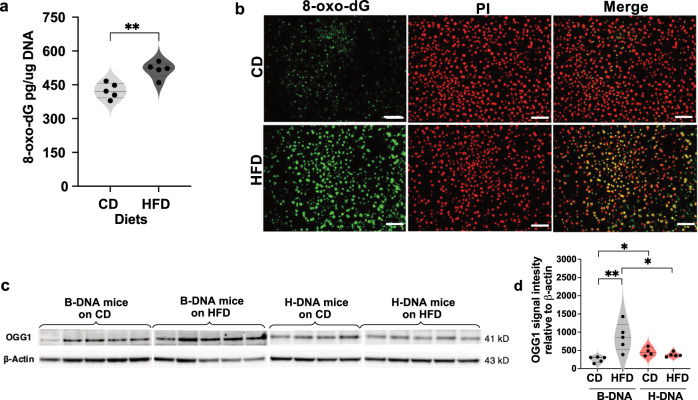
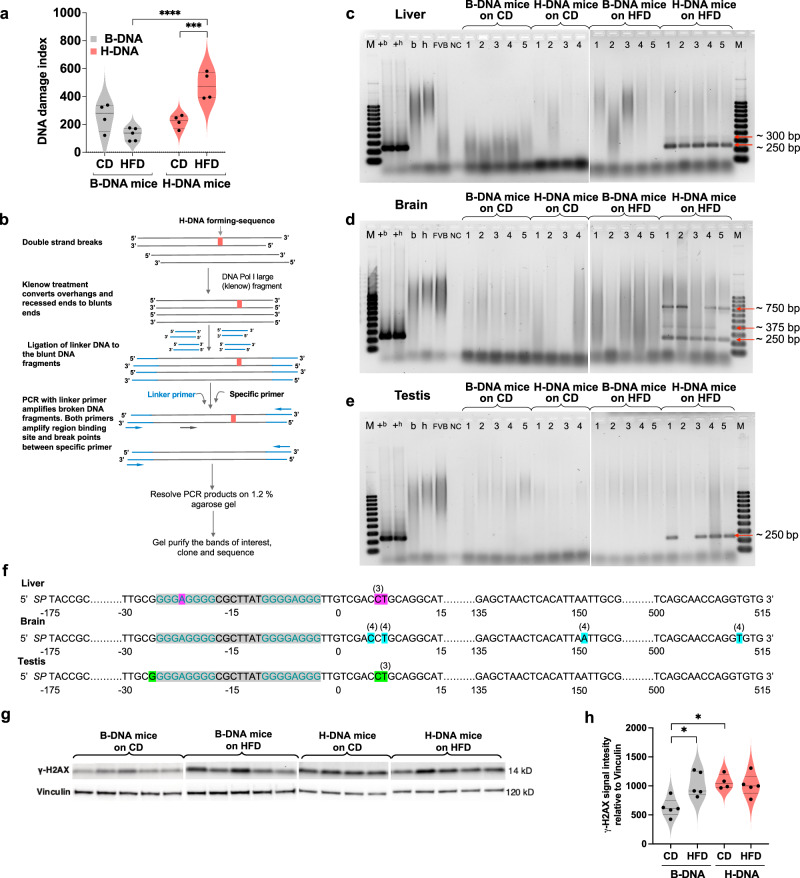
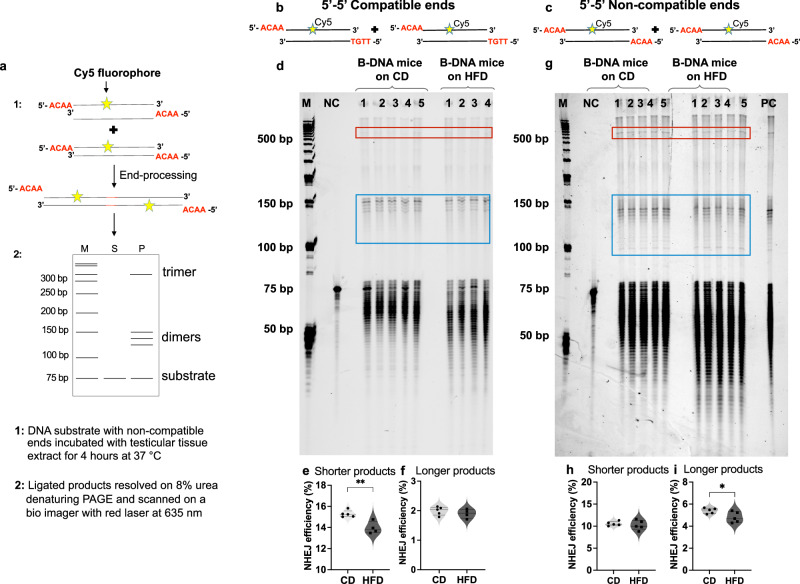
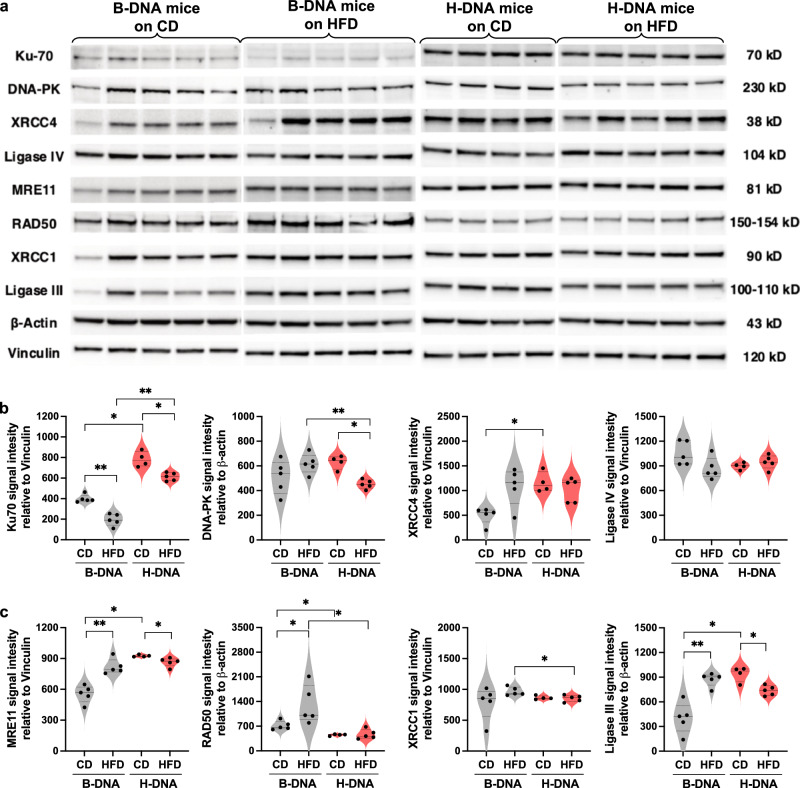
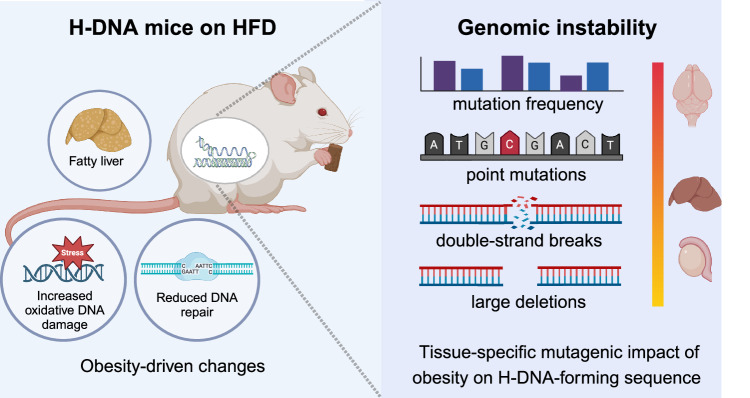
Obesity is associated with increased cancer risk, yet the underlying mechanisms remain elusive. Obesity-associated cancers involve disruptions in metabolic and cellular pathways, which can lead to genomic instability. Repetitive DNA sequences capable of adopting alternative DNA structures (e.g., H-DNA) stimulate mutations and are enriched at mutation hotspots in human cancer genomes. However, it is not known if obesity impacts DNA repeat-mediated endogenous mutation hotspots. We address this gap by measuring mutation frequencies in obese and normal-weight transgenic reporter mice carrying either a control human B-DNA- or an H-DNA-forming sequence (from a translocation hotspot in c-MYC in Burkitt lymphoma). Here, we discover that H-DNA-induced DNA damage and mutations are elevated in a tissue-specific manner, and DNA repair efficiency is reduced in obese mice compared to those on the control diet. These findings elucidate the impact of obesity on cancer-associated endogenous mutation hotspots, providing mechanistic insight into the link between obesity and cancer.


Conflict of interest statement

The authors declare no competing interests.

Figures

Fig. 1
Fig. 1. Schematic of the transgenic mouse model used in this study, mutation reporter recovery, and screening.
a Canonical DNA sequence forming a B-DNA structure. b Homopurine (Pu)-homopyrimidine (Py) mirror-repeat sequence (from a human c-MYC translocation hotspot) forming an H-DNA structure. c Schematic of the p2RT-based mutation-reporter transgenic mouse model. Mutation-reporter containing a 29-bp B-DNA or H-DNA-forming sequence upstream to a lacZ mutation-reporter gene was microinjected into fertilized oocytes and transplanted into a pseudo pregnant FVB/N mouse. Chromosomal integration of the mutation reporter was confirmed in the founder mice via genotyping. d Mutation-reporter DNA recovery is outlined in steps 1–4. Step 1: Restriction digestion with SpeI separates the mutation reporter from mouse genomic DNA. Step 2: Selective recovery is achieved using lacI-lacZ fusion protein tagged magnetic beads specific to lacI binding sites (brown triangle) on the mutation reporter. Step 3: IPTG-based elution rescues the mutation reporter in linearized form. Step 4: The mutation reporter is re-circularized using T4 DNA ligase and subsequently transformed into E. coli DH10β cells for mutation screening. Blue circles represent wild-type colonies and white circles represent mutant colonies. AmpR Ampicillin resistance, NeoR Neomycin resistance, Ori Origin of replication, IPTG Isopropyl ß-d-1-thiogalactopyranoside. The mouse icon in panel c and the scissor icon in panel d were created with BioRender.com and released under a Creative Commons Attribution-NonCommercial-NoDerivs 4.0 International license.
Fig. 2
Fig. 2. Obesity exacerbates H-DNA-induced genomic instability in a tissue-specific fashion.
CD and HFD-induced mutations occurring in the mutation reporter of the B-DNA and H-DNA mice were screened using a lacZ blue-white mutagenesis assay. ac mutation frequencies, frequency of point mutations and frequency of large deletions in liver tissue. df mutation frequencies, frequency of point mutations and frequency of large deletions in brain tissue. gi mutation frequencies, frequency of point mutations and frequency of large deletions in testes tissue. Data from the biological replicates including B-DNA mice (CD, N = 5; HFD, N = 5), and H-DNA mice (CD, N = 4; HFD, N = 5) are represented as violin plots with all data points and dotted lines indicating median and quartile. Statistical analysis was performed using two-way ANOVA to evaluate the significance of interaction (diet x B-DNA/H-DNA) followed by Sidak multiple comparison test for diet factor (CD vs. HFD) and B-DNA vs. H-DNA factor. The p value is adjusted to account for multiple comparisons with family-wise alpha threshold and confidence interval of 95%. p > 0.05 (not significant), *p > 0.05, **p > 0.01, ***p > 0.001, ****p > 0.0001. Source data are provided as a Source Data file. Statistical analysis is provided as Supplementary Note 1.
Fig. 3
Fig. 3. Mutations mapped to the H-DNA-forming region.
Deletion mutations were mapped for their precise position and size by examining the reporter DNA recovered from a liver (n = 157), b brain (n = 148), and c testes (n = 79) tissues from B-DNA mice (CD, N = 5; HFD, N = 5) and H-DNA mice (CD, N = 4; HFD, N = 5). The linearized p2RT mutation-reporter sequence (map illustrated in color) served as the reference map. The blank regions between the lines indicate deletions, and the bases at the ends of the lines represent microhomologies at the deletion junctions. Each deletion junction typically features a single copy of microhomology but is listed on both ends since as it cannot be assigned to either side. The number of identical deletion mutants is denoted in parenthesis to the right. d Quantification (represented as superimposed bars) of small (1–5 bp) and large (6–16 bp) microhomologies observed at deletion junctions in mutation reporters recovered from liver, brain, and testes tissues from B-DNA and H-DNA mice. e Illumina Mi-Seq NGS deep sequencing across a 446-bp mutation reporter amplicon derived from genomic DNA from liver tissue of an H-DNA mouse on the CD and the HFD shows percent non-reference alleles. The blue bar represents the H-DNA-forming sequence region (253–276 bp) within the amplicon. The 446-bp amplicon corresponds to the 686-1132 bp region of the p2RT mutation reporter containing the H-DNA-forming sequence. Source data are provided as a Source Data file.
Fig. 4
Fig. 4. Obesity increases oxidative DNA damage.
a Quantitation of 8-oxo-dG by immunoassay in genomic DNA from B-DNA mice (CD, N = 5; HFD, N = 5) is represented as a violin plot with all data points and dotted lines indicating median and quartile. Statistical analysis was performed using unpaired, two-tailed Student’s t test (t(8) = 4.229, **p = 0.0029), with 95% confidence interval. b Representative images of double immunofluorescence staining for 8-oxo-dG (green) and nucleus (red, PI) in liver tissue sections from mice on the CD and the HFD. Scale bar 70.5 mm. The images were uniformly contrast-enhanced for clarity. c Western blot analysis of OGG1 protein (normalized to the loading control β-actin) from testicular tissue extracts. For comparison, protein lysates from B-DNA mice (CD, N = 5; HFD, N = 5) were run on one blot and H-DNA mice (CD, N = 4; HFD, N = 5) were run on a separate blot. d Quantitation of OGG1 protein represented as a violin plot with all data points and dotted lines indicating median and quartile. Statistical analysis was performed using unpaired, two-tailed Mann‒Whitney U test with 95% confidence interval. Diet factor (CD vs HFD): B-DNA (**p = 0.0079), H-DNA (not significant, p = 0.2857). B-DNA vs. H-DNA factor: CD (*p = 0.0159), HFD (*p = 0.0159). Source data are provided as a Source Data file.
Fig. 5
Fig. 5. Obesity increases H-DNA-induced SSBs and DSBs.
a The abundance of SSBs measured as DNA damage index in brain DNA from B-DNA mice (CD, N = 4; HFD, N = 5), and H-DNA mice (CD, N = 4; HFD N = 4) is represented as a violin plot with all data points and dotted lines indicating median and quartile. Statistical analysis was performed using two-way ANOVA for significance of interaction (diet x B-DNA/H-DNA): F(1,13) = 26.77, ***p = 0.0002 followed by Sidak multiple comparison test for diet factor (CD vs. HFD): F(1,13) = 3.157, not significant, p = 0.0990 [B-DNA: not significant, p = 0.0557, H-DNA: ***p = 0.0007]; and B-DNA vs. H-DNA factor: F(1,13) = 18.06, ***p = 0.0009 [CD: not significant, p = 0.7839, HFD: ****, p > 0.0001]. Each p value is adjusted to account for multiple comparisons with family-wise alpha threshold and confidence interval of 95%. b Schematic outline of the mapping of DSBs using LM-PCR. c-e DSBs were mapped in DNA isolated from the liver, brain, and testes tissues of B-DNA mice (CD, N = 5; HFD, N = 5), and H-DNA mice (CD, N = 4; HFD, N = 5). Different lengths of DSB hotspots relative to the H-DNA-forming sequences are shown as red arrows. M, 100 bp DNA ladder; +b, positive control for B-DNA; +h, positive control for H-DNA; b, B-DNA-containing reporter; h, H-DNA-containing reporter; FVB, FVB mouse genomic DNA; NC, negative control for PCR. f The position of DSB breakpoint hotspots in genomic DNA from H-DNA mice on HFD is shown relative to the H-DNA-forming sequence. The number of identical breakpoints in sequences analyzed for the liver (n = 4, pink), brain (n = 10, blue), and testes (n = 4, green) is noted in parenthesis. g Western blot analysis of γH2AX protein (normalized to the loading control Vinculin) from testicular tissue extracts of B-DNA mice (CD, N = 5; HFD, N = 5) and H-DNA mice (CD, N = 4; HFD, N = 5). For comparison, protein lysates from B-DNA mice (CD, N = 5; HFD, N = 5) were run on one blot and H-DNA mice (CD, N = 4; HFD, N = 5) were run on a separate blot. h Quantitation of γH2AX protein represented as a violin plot with all data points and dotted lines indicating median and quartile. Statistical analysis was performed using unpaired, two-tailed Mann‒Whitney U test with 95% confidence interval. Diet factor (CD vs. HFD): B-DNA (**p = 0.0159), H-DNA (not significant, p = 9048). B-DNA vs. H-DNA factor: CD (*p = 0.0159), HFD (not significant, p = 0.8413). Source data are provided as a Source Data file.
Fig. 6
Fig. 6. Obesity reduces the end-joining repair efficiency of DSBs.
a Schematic outline of the fluorophore-based assay for joining DSBs with non-compatible ends using mouse testicular tissue extract. b Fluorophore-tagged DNA substrate mimicking DSBs with 5′(ACAA)-5′(TGTT) compatible ends. c Fluorophore-tagged DNA substrate mimicking DSBs with 5′(ACAA)-5′(ACAA) non-compatible ends. d Representative image of denaturing urea polyacrylamide gel showing ligation products of 5′-5′ compatible ends using testicular tissue extract from B-DNA mice (CD, N = 5; HFD, N = 4). e Quantitation of shorter length ligation products shown in d (blue box, t(7) = 4.405, **p = 0.0031). f Quantitation of longer ligation products shown in d (red box, t(7) = 0.9588, not significant, p = 0.3696). g Representative image of denaturing urea polyacrylamide gel showing ligation products of 5′-5′ non-compatible ends using testicular tissue extract from B-DNA mice (CD, N = 5; HFD, N = 5). h Quantitation of shorter length ligation products shown in g (blue box, t(8) = 0.5954, not significant, p = 0.5681). i Quantitation of longer ligation products shown in g (red box, t(8) = 2.394, *p = 0.0436). Data for e, f and h, i is represented as violin plots with all data points and dotted lines indicating median and quartile. Statistical analysis was performed using unpaired, two-tailed student’s t-test with 95% confidence interval. Source data are provided as a Source Data file. M 50 bp DNA ladder, NC negative control, PC positive control.
Fig. 7
Fig. 7. Obesity alters the levels of DSB end-joining repair proteins.
a Western blot analysis of NHEJ pathway proteins: Ku70, DNA-PK, XRCC4, Ligase IV, and alternative-NHEJ pathway proteins: MRE11, Rad50, XRCC1, Ligase III (normalized to loading controls β-actin or Vinculin) from testicular tissue extracts. For comparison, protein lysates from B-DNA mice (CD, N = 5; HFD, N = 5) were run on one blot and H-DNA mice (CD, N = 4; HFD, N = 5) were run on a separate blot. b, c Quantitation of blots represented as violin plots with all data points and dotted lines indicating median and quartile. Statistical analysis was performed using unpaired, two-tailed Mann‒Whitney U test with 95% confidence interval. p > 0.05 (not significant), *p > 0.05, **p > 0.01. Source data are provided as a Source Data file. Statistical analysis is provided as Supplementary Note 2.
Fig. 8
Fig. 8. Obesity increases DNA repeat-mediated genomic instability.
Obesity stimulates liver steatosis and oxidative stress. Obesity amplifies the mutagenic potential of H-DNA in mouse liver, brain, and testes tissues. Point mutations, DSBs, and large deletions can be mapped specifically to the H-DNA-forming region. DNA damage repair capacity is altered in the obese state, further contributing to genomic instability. This figure was created with BioRender.com and released under a Creative Commons Attribution-NonCommercial-NoDerivs 4.0 International license.

References

    1. Mannar M., Micha R. 2020 Global Nutrition Report: Action On Equity To End Malnutrition (Development Initiatives, 2020).
    1. Popkin, B. M., Adair, L. S. & Ng, S. W. Global nutrition transition and the pandemic of obesity in developing countries. Nutr. Rev.70, 3–21 (2012). 10.1111/j.1753-4887.2011.00456.x - DOI - PMC - PubMed
    1. Hruby, A. & Hu, F. B. The epidemiology of obesity: a big picture. Pharmacoeconomics33, 673–689 (2015). 10.1007/s40273-014-0243-x - DOI - PMC - PubMed
    1. Park, J., Morley, T. S., Kim, M., Clegg, D. J. & Scherer, P. E. Obesity and cancer–mechanisms underlying tumour progression and recurrence. Nat. Rev. Endocrinol.10, 455–465 (2014). 10.1038/nrendo.2014.94 - DOI - PMC - PubMed
    1. The Lancet Diabetes and Endocrinology. The obesity-cancer link: of increasing concern. Lancet Diabetes Endocrinol.8, 175 (2020). - PubMed