. 2024 Jul 23;15(1):6201.
doi: 10.1038/s41467-024-50511-w.

The molecular basis underlying T cell specificity towards citrullinated epitopes presented by HLA-DR4

Affiliations

The molecular basis underlying T cell specificity towards citrullinated epitopes presented by HLA-DR4

Tiing Jen Loh et al. Nat Commun. .

Abstract

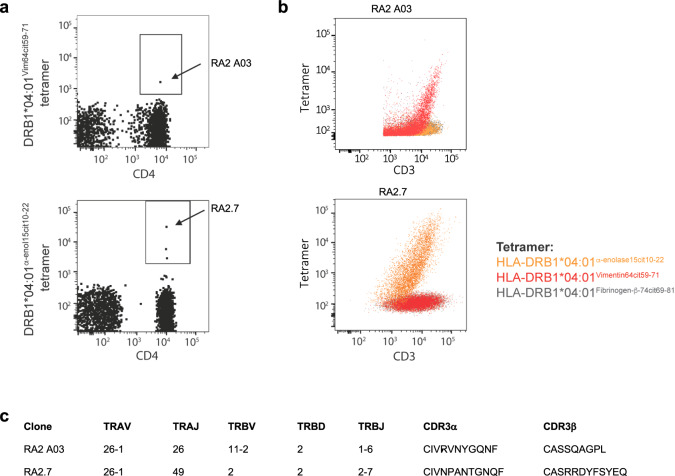
CD4+ T cells recognising citrullinated self-epitopes presented by HLA-DRB1 bearing the shared susceptibility epitope (SE) are implicated in rheumatoid arthritis (RA). However, the underlying T cell receptor (TCR) determinants of epitope specificity towards distinct citrullinated peptide antigens, including vimentin-64cit59-71 and α-enolase-15cit10-22 remain unclear. Using HLA-DR4-tetramers, we examine the T cell repertoire in HLA-DR4 transgenic mice and observe biased TRAV6 TCR gene usage across these two citrullinated epitopes which matches with TCR bias previously observed towards the fibrinogen β-74cit69-81 epitope. Moreover, shared TRAV26-1 gene usage is evident in four α-enolase-15cit10-22 reactive T cells in three human samples. Crystal structures of mouse TRAV6+ and human TRAV26-1+ TCR-HLA-DR4 complexes presenting vimentin-64cit59-71 and α-enolase-15cit10-22, respectively, show three-way interactions between the TCR, SE, citrulline, and the basis for the biased selection of TRAV genes. Position 2 of the citrullinated epitope is a key determinant underpinning TCR specificity. Accordingly, we provide a molecular basis of TCR specificity towards citrullinated epitopes.


Conflict of interest statement

This work has been supported by Janssen Research & Development, D.G.B. was an employee of Janssen Research & Development. The other authors declare no competing interests.

Figures

Fig. 1
Fig. 1. HLA-DR4Vim-64cit59-71- and HLA-DR4α-eno-15cit10-22-specific CD4+ T cells in immune HLA-DR4 transgenic mice.
a Representative HLA-DR4Vim-64cit59-71 and HLA-DR4α-eno-15cit10-22 tetramer staining on CD4+ T cells from the draining lymph nodes (dLN) of HLA-DR4 mice immunized 8d previously with a 50:50 mix of Vimentin64cit59-71 and α-enolase-15cit10-22 peptides (upper plots) or PBS (lower plots) emulsified in CFA. Gating strategies shown in Supplementary Fig. 1. Numbers in dot plots represent total number of CD4+ tetramer+ cells after magnetic enrichment and acquisition of entire sample. b Frequency of CD4+ HLA-DR4Vim-64cit59-71 (Vim-64cit)- or HLA-DR4α-eno-15cit10-22 (α-eno-15cit)-tetramer positive CD4+ cells in the dLN of mixed peptide- (closed symbols; n = 4) or PBS- (open symbols; n = 2) immunized HLA-DR4 mice. Symbols represent data from individual mice obtained in two independent experiments. Horizontal bars indicate mean ± SD. c HLA-DR4Vim-64cit59-71- and HLA-DR4α-eno-15cit10-22-specific TCRαβ repertoires isolated from the dLN of a peptide-immunized HLA-DR4 mouse (n = 1 with 32 and 63 sequences, respectively), showing the frequency of individual clones and the TCR gene segment usage and CDR3 amino acid sequence for each clone. CDR3 nucleotide sequences are listed in Supplementary Table 10. TCRs marked A07, A03, E02, E04 and E17 were selected for further analysis. d 293 T cells transiently co-transfected with a HLA-DR4Vim-64cit59-71 specific TCR (A03 and A07) or HLA-DR4α-eno-15cit10-22 specific TCR (E02, E04, E17) and CD3γδεζ were stained with either HLA-DR4Vim-64cit59-71 tetramer (red), HLA-DR4α-eno-15cit10-22 tetramer (orange) or control HLA-DR4Fibβ-74cit69-81 tetramer (charcoal). Source data are provided as a Source Data file.
Fig. 2
Fig. 2. HLA-DR4Vim-64cit59-71- and HLA-DR4α-eno-15cit10-22-specific CD4+ T cells in RA donor.
a HLA-DR4Vim-64cit59-71 and HLA-DR4α-eno-15cit10-22 tetramer staining on CD4+ T cells post tetramer-based magnetic enrichment of PBMC from a HLA-DR4+ ACPA+ RA donor. Dot plots show CD14-CD19-live CD3+ CD4+ cells. Gating strategy is shown in Supplementary Fig. 1b. Arrows indicate cells designated RA2 A03 and RA2.7. b 293 T cells transiently co-transfected with RA2.7 TCR and CD3γδεζ or SKW-3 T cells transiently co-transfected with RA2 A03 TCR and CD3γδεζ were stained with either HLA-DR4α-eno-15cit10-22 tetramer (orange), HLA-DR4Vim-64cit59-71 tetramer (red) or control HLA-DR4Fibβ-74cit69-81 tetramer (charcoal). c TCR gene segment usage and CDR3 amino acid sequence for RA2 A03 and RA2.7 clones. CDR3 nucleotide sequences are listed in Supplementary Table 10.
Fig. 3
Fig. 3. Affinity analysis of TCR-HLA-DR4Vim-64cit59-71/α-eno-15cit10-22 interactions, antigen reactivity of RA2.7 TCR towards HLA-DR4α-eno-15cit10-22/α-eno-15cit10-22V20G and TCR gene segment usage of ACPA+ RA donor and healthy control CD4+ T cells binding to HLA-DR4α-eno-15cit10-22V20G tetramer.
a Binding of TCRs A03, A07 and RA2A03 to HLA-DR4Vim-64cit59-71 and (b) Binding of RA2.7 TCR to HLA-DR4α-eno-15cit10-22/α-eno-15cit10-22V20G. For KD determination in (a) and (b) all data were derived from two or more independent experiments, with A03 TCR (n = 7), A07 TCR (n = 6), RA2A3 TCR (n = 2), RA2.7 (n = 2) and curve fits using a single ligand binding model. For each concentration the points represent the mean and error bars correspond to SD. Expression of CD69 on the surface of RA2.7 TCR transduced SKW-3 cell lines stimulated overnight with serial dilution of (c) α-eno-15cit 10-22 peptide-pulsed BLCL 9031 or (e) α-eno-15cit 10-22V20G peptide- pulsed BLCL 9031. Expression of CD3 on the surface of RA2.7 TCR transduced SKW-3 cell lines stimulated overnight with serial dilution of (d) α-eno-15cit 10-22 peptide-pulsed BLCL 9031 or (f) α-eno-15cit 10-22V20G peptide- pulsed BLCL 9031. For (cf) the black dots are presented as the mean fluorescence intensity (MFI) of average of duplicated values from three independent experiments. Anti-HLA-DR4 antibody used as control. For (cf) P-values were determined by one-way ANOVA with Dunnett’s multiple comparison testing, *P < 0.05, **P < 0.01, ***P < 0.002, ****P < 0.0001 and error bars represent ± s.e.m. g TCR TRAV and TRBV gene segment usage of CD4+ T cells isolated from the peripheral blood of ACPA+ RA donor 2, ACPA- RA donor 3, and HLA-DR4+ healthy control (HC) donors 10195 and 4737 using HLA-DR4α-eno-15cit10-22V20G tetramer. All TCR clones were unique except for one TRAV26-1+ TRBV5-4+ clone from HC donor 4727 for which two sequences were isolated (Supplementary Table 1). Source data are provided as a Source Data file.
Fig. 4
Fig. 4. TRAV6+ TCR recognition of HLA-DR4Vim-64cit59-71.
a Overall cartoon representation of immune TCR A03 and A07 complexed with HLA-DR4Vim-64cit59-71. The HLA-DR4 α and β chains are coloured in white and brown, respectively. The peptide is coloured in pink sticks. The CDR loops 1α, 2α, and 3α are highlighted in cyan, violet, and light green colour, whereas 1β, 2β, 3β are coloured in blue, purple, and dark green, respectively. The FW α residues are coloured in sand and β residues are coloured in beige. b Top: Surface representation of TCR footprint on pHLA with A03 TCR (left panel) and A07 TCR (right panel). TCR footprint colours are in accordance with the nearest TCR contact residue. The Vα and Vβ centre of mass positions are shown in red and blue spheres, respectively, and connected via a black line. Bottom: Pie charts represent the relative contribution of each CDR loop and FW residues of TCR to the interface with HLA-DR4Vim-64cit59-71. Detailed interactions of A03 TCR between (c) CDR1α, 2α and FW α, (d) CDR3α, (e) CDR1β, 2β, 3β and FW β with HLA-DR4, and (i) peptide interactions are shown. Detailed interactions of A07 TCR between (f) CDR1α, 2α and FW α, (g) CDR3α, (h) CDR3β with HLA-DR4, and (j) peptide are shown.
Fig. 5
Fig. 5. Bias of TRAV6+ TCR recognition toward HLA-DR4Vim-64cit59-71 and HLA-DR4Fibβ-74cit69-81.
a TRAV CDR loop sequences of M134 TCR and A03 TCR. Detailed interactions between CDR α loops of TRAV6+ (b) A03 TCR and (c) M134 TCR docking on top of the antigen binding cleft at P2 of the epitope. The HLA-DR4 α- and β-chains are coloured in white and brown, respectively, Vim-64cit59–71 peptide coloured is coloured in pink and Fibrinogen β-74cit69–81 peptide is coloured in yellow. d Effect of A03 TCR point mutations at the pHLA interface. The Y-axis represents the fold of affinity of mutant TCRs as compared with wild-type TCR. The X-axis represents the position of A03 TCR mutants. e Effect of HLA-DR4 mutations on A03 TCR binding affinity. The Y-axis represents the fold change in affinity of mutant TCRs with respect to the wild type A03 TCR and the X-axis represents the position of HLA-DR4 residues mutation. The SPR experiments were performed in duplicate (n = 2). The impact of each mutation was classified as negligible ( 1-fold affinity decrease, blue), mild (1.5-fold to 3-fold affinity decrease, green), moderate (3-fold to 5-fold affinity reduction, orange), or critical (>5-fold affinity decrease or no binding, red) shown on graph and on surface of pHLA. Source data are provided as a Source Data file.
Fig. 6
Fig. 6. TRAV26-1+ TCR recognition of HLA-DR4α-eno-15cit10-22V20G.
a Left: Overall cartoon representation of human TCR RA2.7 complexed to HLA-DR4α-eno-15cit10-22V20G. The HLA-DR4 α and β chains are coloured in white and brown, respectively. The peptide is coloured in orange sticks. The CDR loops 1α, 2α, and 3α are highlighted in cyan, violet, and light green colour, whereas 1β, 2β, 3β are coloured in blue, purple, and dark green, respectively. The FW α residues are colour in sand and β residues are colour in beige. Right Top: Surface representation of TCR footprints and TCR docking. TCR footprint colours are in accordance with the nearest TCR contact residue. The Vα and Vβ centre of mass position is shown in red and blue spheres, respectively, and connected via a black line. Right bottom: Pie charts present the relative contribution of each CDR loop and FW of TCR to the surface of HLA-DR4α-eno-15cit10-22V20G. Detailed interactions of RA2.7 TCR between (b) CDR1α, 2α and 3α, (c) CDR1β, 2β, and FW β, d CDR3β with HLA-DR4 and (e) peptide interactions are shown. f Effect of RA2.7 TCR point mutations at the pMHC II interface. The SPR experiments were performed in duplicate (n = 2). The Y axis represents the fold of affinity of mutant TCRs as compared with wild-type TCR. The X axis represents the position of RA2.7 TCR mutants. The impact of each mutation was classified as negligible (<1.5-fold affinity decrease, blue), mild (1.5-fold to 3-fold affinity decrease, green), moderate (3-fold to 5-fold affinity reduction, orange), or critical (>5-fold affinity decrease or no binding, red). Source data are provided as a Source Data file.
Fig. 7
Fig. 7. Antigen specificity on HLA-DR4 towards T cell receptors.
Detailed interactions of SE residues with P4-Cit and (a) A03 TCR, (b) A07 TCR, (c) RA2.7 TCR, and (d) M134 TCR. Black dash represents a hydrogen bond and beige dash represent vdW interaction. e Top: Peptide sequences of α-eno-15cit10-22, Fibβ-74cit69-81 and Vim-64cit59-71 from pocket 1 to pocket 9. Bottom: The overlay of α-eno-15cit10-22 (orange), Fibβ-74cit69-81 (yellow), and Vim-64cit59-71 (pink) peptides from ternary complex structure. f Overlaid N-terminal region (P1-P4 position) of α-eno-15cit10-22 (orange), Fibβ-74cit69-81 (yellow), and Vim-64cit59-71 (pink) peptides and interactions with TCRs (A03 in red, and RA2.7 in orange). g Overlaid C-terminal region (P5-P9 position) of α-eno-15cit10-22 (orange), Fibβ-74cit69-81 (yellow), and Vim-64cit59-71 (pink) peptides and interactions with CDR3β of RA2.7 TCR. h Overlaid pHLA structures of α-eno-15cit10-22 (orange), Fibβ−74cit69-81 (yellow), and Vim-64cit59-71 (pink) ternary complexes. The deviation in α2 helix of the peptide antigen binding cleft was highlighted and measured (unit in Å). i The affinity analysis of A03 TCR, RA2.7 TCR and M134 TCR for HLA-DR4 with Vim-64cit59-71, α-eno-15cit10-22V20G, and Fibβ−74cit69-81 epitopes. All data were derived from three independent measurements with maximal TCR concentrations of 100 μM (n = 3). For each concentration the points represent the mean and error bars correspond to SD. RU denotes response units. Source data are provided as a Source Data file.

References

    1. Dendrou, C. A., Petersen, J., Rossjohn, J. & Fugger, L. HLA variation and disease. Nat. Rev. Immunol.18, 325–339 (2018). 10.1038/nri.2017.143 - DOI - PubMed
    1. Gregersen, P. K., Silver, J. & Winchester, R. J. The shared epitope hypothesis. An approach to understanding the molecular genetics of susceptibility to rheumatoid arthritis. Arthritis Rheum.30, 1205–1213 (1987). 10.1002/art.1780301102 - DOI - PubMed
    1. Raychaudhuri, S. et al. Five amino acids in three HLA proteins explain most of the association between MHC and seropositive rheumatoid arthritis. Nat. Genet.44, 291–296 (2012). 10.1038/ng.1076 - DOI - PMC - PubMed
    1. Scally, S. W. et al. A molecular basis for the association of the HLA-DRB1 locus, citrullination, and rheumatoid arthritis. J. Exp. Med.210, 2569–2582 (2013). 10.1084/jem.20131241 - DOI - PMC - PubMed
    1. Huizinga, T. W. et al. Refining the complex rheumatoid arthritis phenotype based on specificity of the HLA-DRB1 shared epitope for antibodies to citrullinated proteins. Arthritis Rheum.52, 3433–3438 (2005). 10.1002/art.21385 - DOI - PubMed

MeSH terms