. 2024 Jul 23;15(1):6215.
doi: 10.1038/s41467-024-50369-y.

A multi-classifier system integrated by clinico-histology-genomic analysis for predicting recurrence of papillary renal cell carcinoma

Affiliations

A multi-classifier system integrated by clinico-histology-genomic analysis for predicting recurrence of papillary renal cell carcinoma

Kang-Bo Huang et al. Nat Commun. .

Abstract

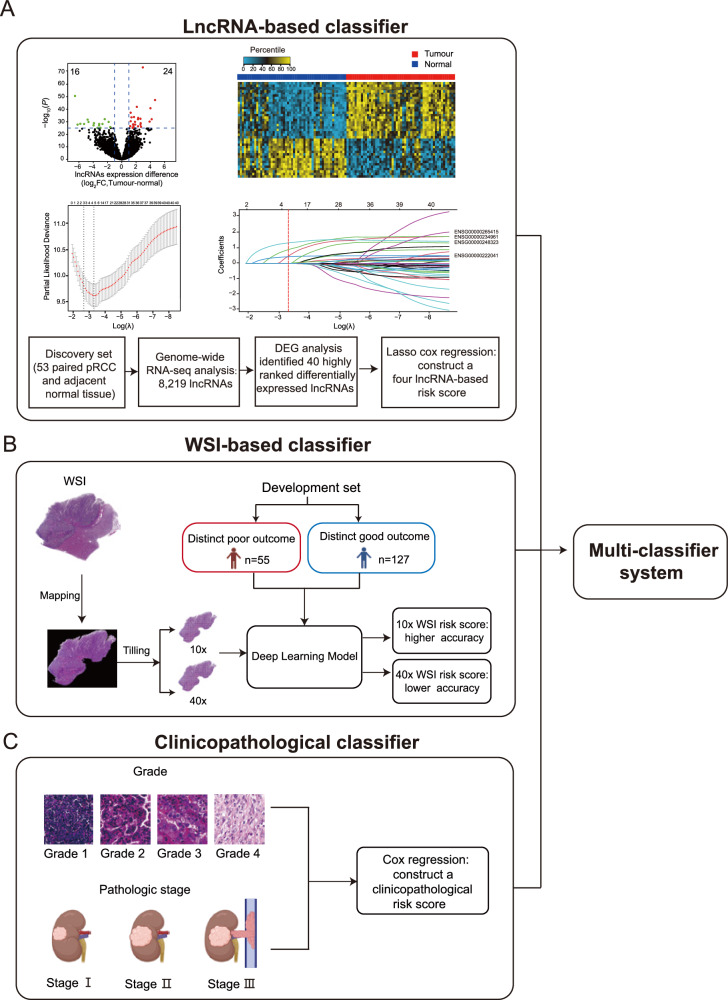
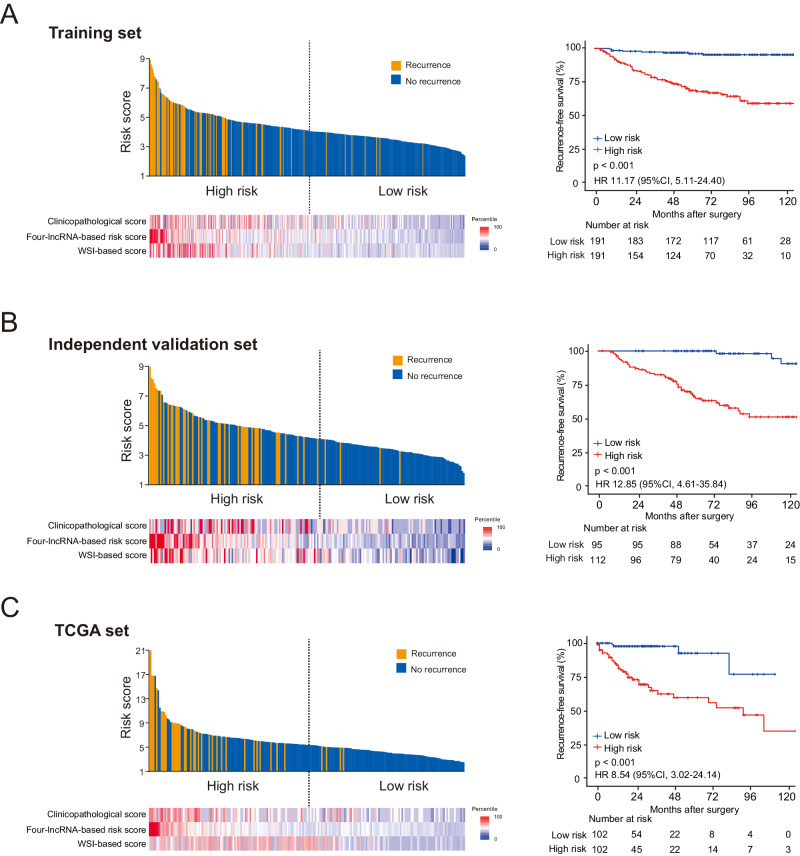
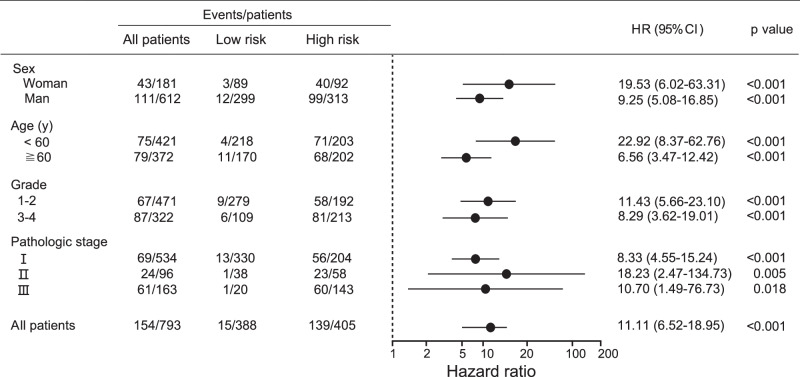
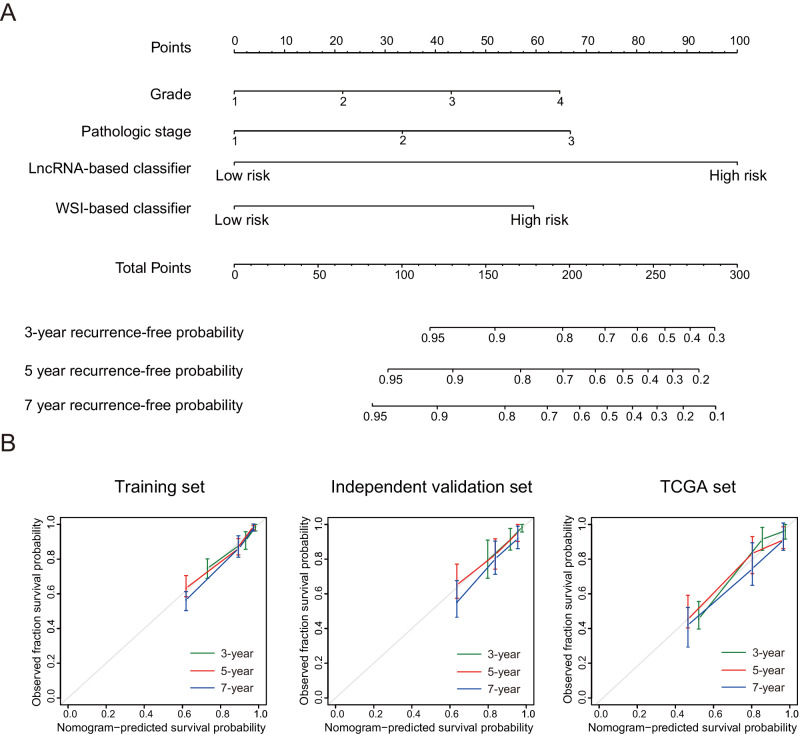
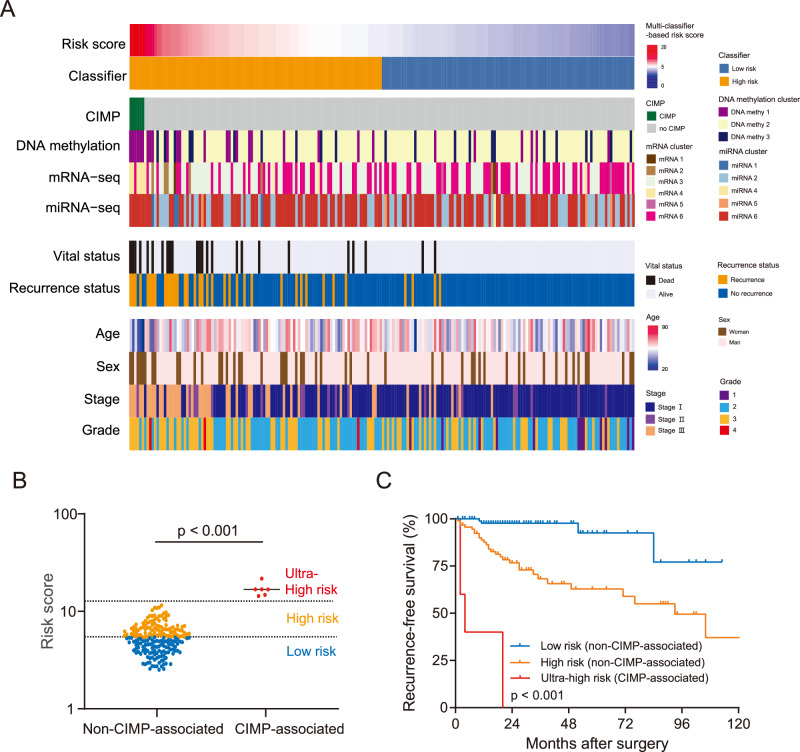
Integrating genomics and histology for cancer prognosis demonstrates promise. Here, we develop a multi-classifier system integrating a lncRNA-based classifier, a deep learning whole-slide-image-based classifier, and a clinicopathological classifier to accurately predict post-surgery localized (stage I-III) papillary renal cell carcinoma (pRCC) recurrence. The multi-classifier system demonstrates significantly higher predictive accuracy for recurrence-free survival (RFS) compared to the three single classifiers alone in the training set and in both validation sets (C-index 0.831-0.858 vs. 0.642-0.777, p < 0.05). The RFS in our multi-classifier-defined high-risk stage I/II and grade 1/2 groups is significantly worse than in the low-risk stage III and grade 3/4 groups (p < 0.05). Our multi-classifier system is a practical and reliable predictor for recurrence of localized pRCC after surgery that can be used with the current staging system to more accurately predict disease course and inform strategies for individualized adjuvant therapy.


Conflict of interest statement

The authors declare no competing interests.

Figures

Fig. 1
Fig. 1. Construction of the multi-classifier system.
lncRNA expression data, WSIs, and clinicopathological factors were used to develop the three classifiers respectively. We then integrated the three classifiers to develop a multi-classifier system. A The development of the lncRNA-based classifier. Upper left of panel: volcano plot comparing lncRNA expression in pRCC versus adjacent normal tissues (n = 53). Biological significance (log2 fold change (FC)) is depicted on the x axis, and the statistical significance (−log10 P) is depicted on the y axis. Forty lncRNAs were identified with a log2 FC > 1, and the false discovery rate was <10−25. Upper right of panel: heat map showing the expression level of 40 lncRNAs in 53 paired pRCCs. Middle left of panel: LASSO Cox regression analysis to select lncRNAs to include in the classifier. The two dotted vertical lines were drawn at the optimal values using the minimum criterion (right) and 1 minus the standard error (1−s.e.) criterion (left). Middle right of panel: LASSO coefficient profiles of the 40 differentially expressed lncRNAs. A vertical line was drawn at the optimal value using the minimum criterion, which resulted in four non-zero coefficients. Four lncRNAs were finally selected using the LASSO Cox regression model to build the four lncRNA-based score. Lower panel: flow chart. B The development of the WSI-based classifier using deep learning. C The development of the clinicopathological classifier. Pictures of pathologic stages were created with BioRender.com. Source data are provided as a Source Data file.
Fig. 2
Fig. 2. Multi-classifier-based risk score and Kaplan–Meier survival analysis in the training set and two validation sets.
A The multi-classifier-based risk score and Kaplan–Meier survival analysis in the training set (n = 382). Upper left of panel: distribution of the multi-classifier-based risk scores and patient recurrence status. Lower left of panel: heat map showing the scores generated using each of the three classifiers independently. Right of panel: KaplanMeier survival analysis for RFS in patients with pRCC who were divided into low-risk and high-risk groups. B, C The multi-classifier-based risk scores and Kaplan–Meier survival analysis in the independent validation set (n = 207) and the TCGA set (n = 204), respectively. HRs, 95% CIs and two-sided P values were calculated using the Cox proportional hazards model. Source data are provided as a Source Data file.
Fig. 3
Fig. 3. HR of RFS for patients with pRCC predicted using the multi-classifier-based risk score in high-risk and low-risk groups.
The HR of RFS for all 793 patients with pRCC predicted using the multi-classifier-based risk score in subgroups stratified by clinical and pathological parameters. HRs, 95% CIs and two-sided P values were calculated using the Cox proportional hazards model. HRs are depicted as the central point for the error bars, while the 95% CI is represented by the length of the error bars. Source data are provided as a Source Data file.
Fig. 4
Fig. 4. The nomogram based on the lncRNA-based classifier, the WSI-based classifier, and the clinicopathological risk factors.
A The nomogram based on the lncRNA-based classifier, the WSI-based classifier, and clinicopathological risk factors for predicting the 3-year, 5-year, and 7-year recurrence-free probability for patients with pRCC after surgery. B Calibration curves of the nomogram to predict 3-year, 5-year, and 7-year RFS in the training set (n = 382), independent validation set (n = 207) and TCGA set (n = 204). The actual outcome is plotted on the y axis, and the nomogram-predicted outcome is plotted on the x axis. Model performance is shown relative to the 45° line, representing the performance of an ideal nomogram for which the predicted outcome perfectly corresponds with the actual outcome. The error bands represent the 95% CIs around the observed values. Source data are provided as a Source Data file.
Fig. 5
Fig. 5. Multi-classifier-based risk score predicts RFS in 204 patients with pRCC in the TCGA set.
A The heat map of 204 patients, which includes the multi-classifier-based risk score, established cluster-based molecular classifiers from TCGA, and clinical features. The cases are arranged according to the multi-classifier-based risk score. B The comparison between the multi-classifier-based risk score among patients according to whether their tumors had CIMP hypermethylation pattern using a scatter plot analyzed using two-sided unpaired Student’s t test. The blue, orange, and red dots in the scatter plot represent low-risk, high-risk, and ultra-high-risk patients as determined using the multi-classifier-based risk score, respectively. C The Kaplan–Meier analysis of RFS according to whether the tumors had CIMP pattern. Patients with CIMP-associated tumors (n = 6) had significantly shorter RFS compared to patients with non-CIMP-associated tumors (n = 198), including patients in the low-risk group (n = 102) and high-risk group (n = 96) according to the multi-classifier system. P values were calculated with the log-rank test. Source data are provided as a Source Data file.

References

    1. Siegel, R. L., Miller, K. D., Wagle, N. S. & Jemal, A. Cancer statistics, 2023. CA Cancer J. Clin.73, 17–48 (2023). 10.3322/caac.21763 - DOI - PubMed
    1. Ljungberg, B. et al. The Epidemiology of Renal Cell Carcinoma. Eur. Urol.60, 615–621 (2011). 10.1016/j.eururo.2011.06.049 - DOI - PubMed
    1. Leibovich, B. C. et al. Histological subtype is an independent predictor of outcome for patients with renal cell carcinoma. J. Urol.183, 1309–1315 (2010). 10.1016/j.juro.2009.12.035 - DOI - PubMed
    1. Martínez Chanzá, N. et al. Cabozantinib in advanced non-clear-cell renal cell carcinoma: a multicentre, retrospective, cohort study. Lancet Oncol.20, 581–590 (2019). 10.1016/S1470-2045(18)30907-0 - DOI - PMC - PubMed
    1. Leibovich, B. C. et al. Predicting Oncologic Outcomes in Renal Cell Carcinoma After Surgery. Eur. Urol.73, 772–780 (2018). 10.1016/j.eururo.2018.01.005 - DOI - PubMed