. 2024 Jul 23;15(1):6216.
doi: 10.1038/s41467-024-50282-4.

Human cytomegalovirus in breast milk is associated with milk composition and the infant gut microbiome and growth

Affiliations

Human cytomegalovirus in breast milk is associated with milk composition and the infant gut microbiome and growth

Kelsey E Johnson et al. Nat Commun. .

Abstract

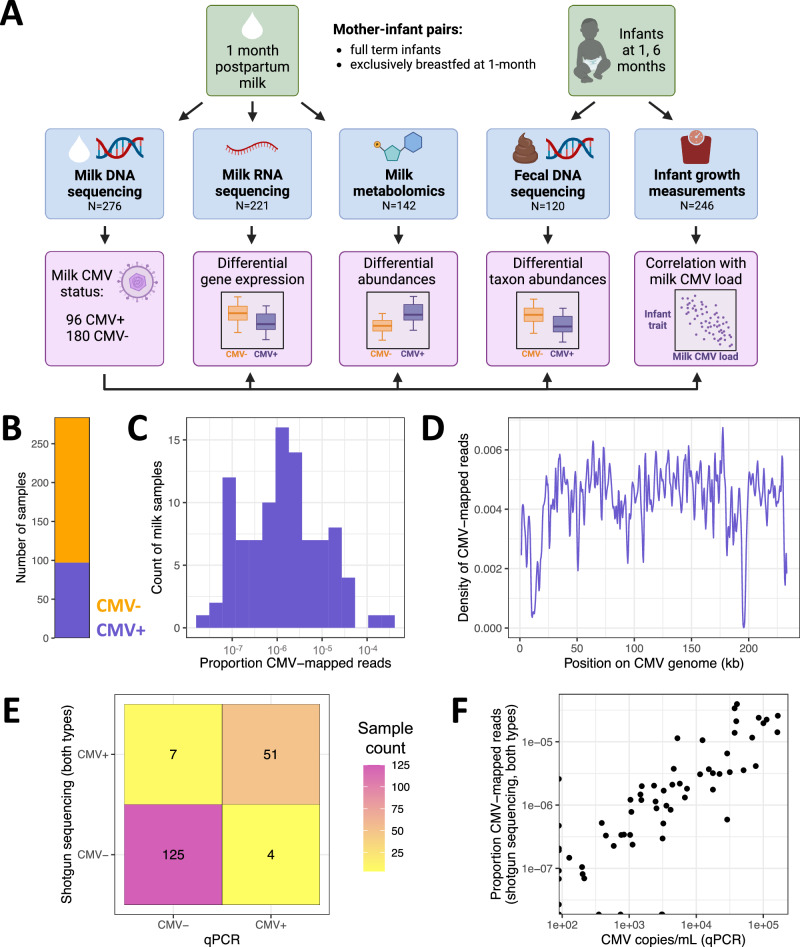
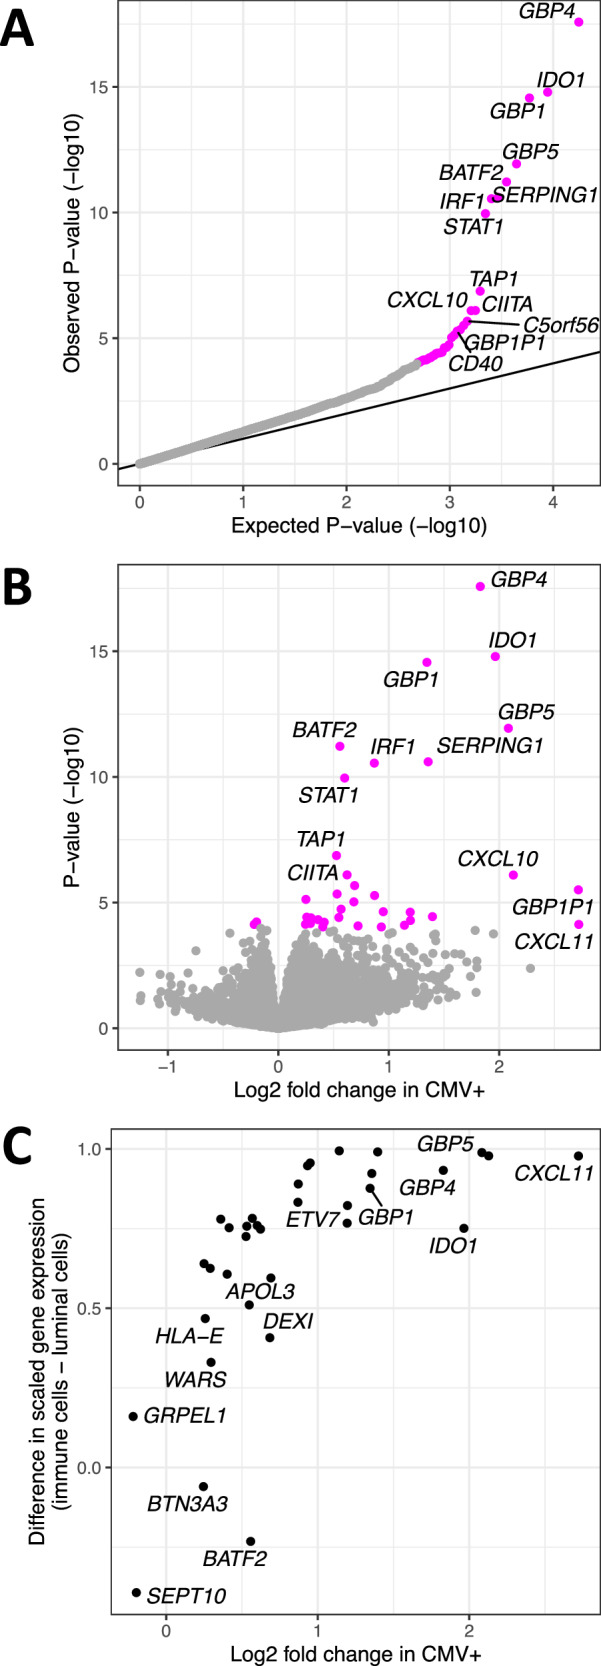
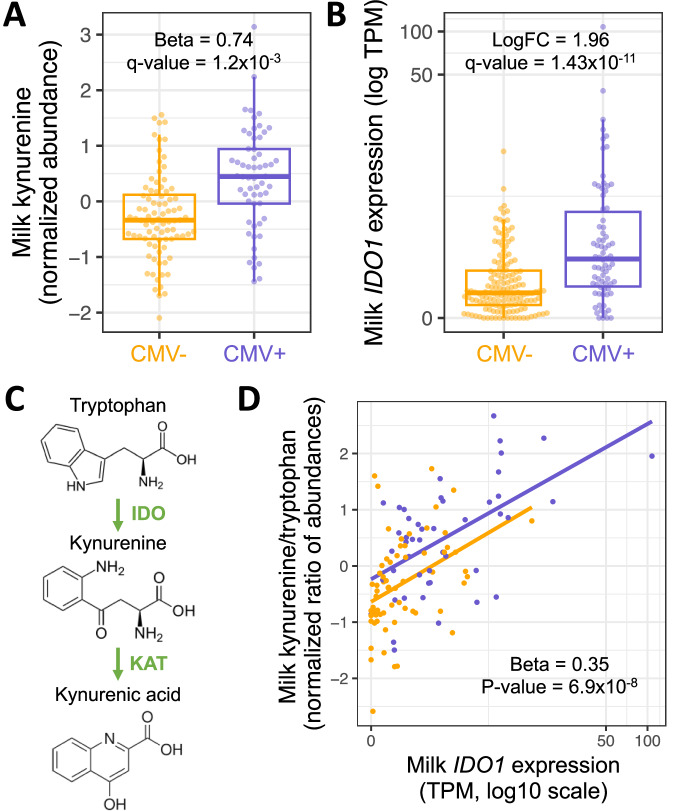
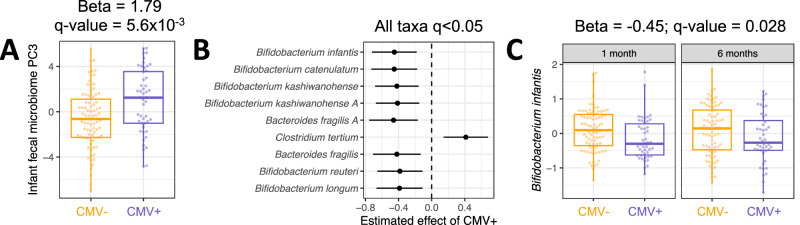
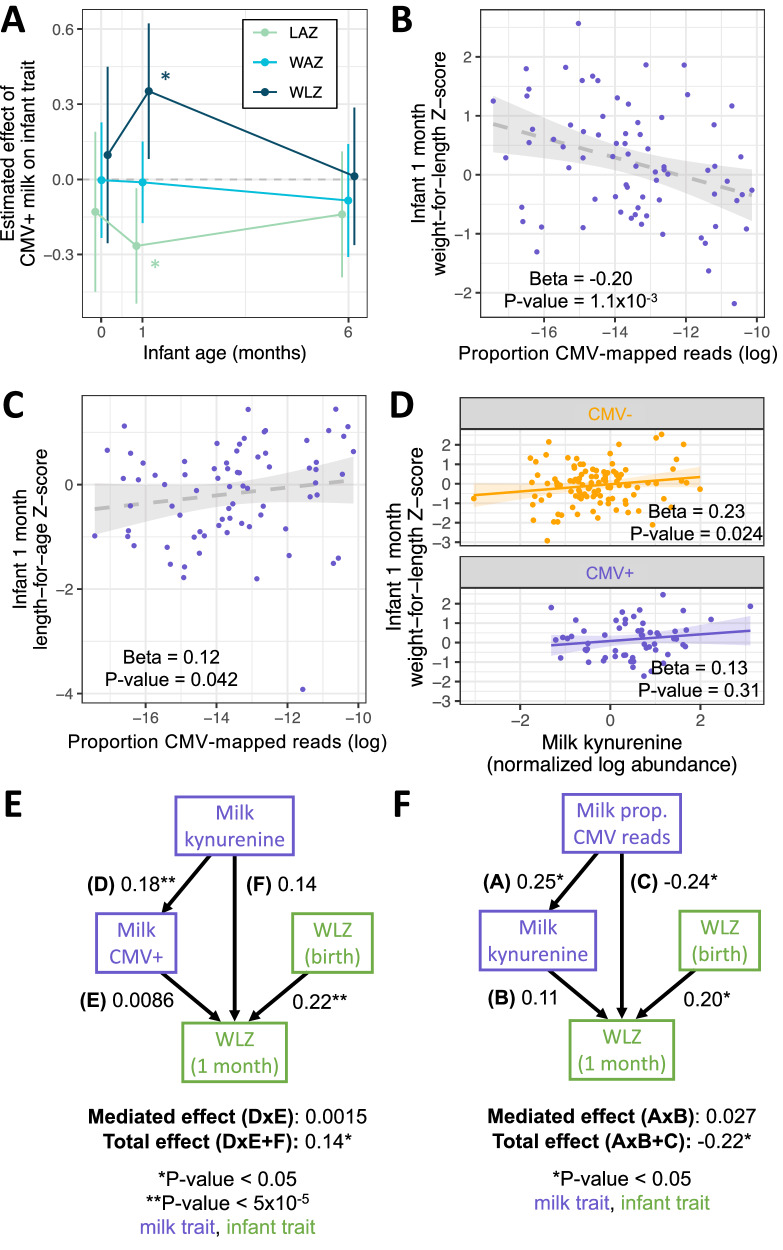
Human cytomegalovirus (CMV) is a highly prevalent herpesvirus that is often transmitted to the neonate via breast milk. Postnatal CMV transmission can have negative health consequences for preterm and immunocompromised infants, but any effects on healthy term infants are thought to be benign. Furthermore, the impact of CMV on the composition of the hundreds of bioactive factors in human milk has not been tested. Here, we utilize a cohort of exclusively breastfeeding full-term mother-infant pairs to test for differences in the milk transcriptome and metabolome associated with CMV, and the impact of CMV in breast milk on the infant gut microbiome and infant growth. We find upregulation of the indoleamine 2,3-dioxygenase (IDO) tryptophan-to-kynurenine metabolic pathway in CMV+ milk samples, and that CMV+ milk is associated with decreased Bifidobacterium in the infant gut. Our data indicate two opposing CMV-associated effects on infant growth; with kynurenine positively correlated, and CMV viral load negatively correlated, with infant weight-for-length at 1 month of age. These results suggest CMV transmission, CMV-related changes in milk composition, or both may be modulators of full-term infant development.


Conflict of interest statement

The authors declare no competing interests.

Figures

Fig. 1
Fig. 1. Study overview and identifying CMV in human milk shotgun sequencing data.
A Study overview. B Count of milk samples identified as CMV+ (N = 97, purple) or CMV− (N = 187, orange). C The distribution of CMV-mapped DNA reads, as a proportion of all DNA reads, across milk samples that had at least one read mapped to the CMV genome. D Density of CMV-aligned reads across the CMV genome from all CMV+ milk samples. The density refers to the fraction of all CMV-mapped reads aligned to a particular region of the CMV genome. The density dips close to zero at repetitive regions in the CMV genome. E Agreement of milk CMV status designations using shotgun DNA sequencing (y axis) vs. qPCR (x axis). F Within samples designated CMV+ by both qPCR and shotgun sequencing, the viral load estimates from the two methods were correlated (two-sided Pearson’s r = 0.88, P = 3.3 × 10−17).
Fig. 2
Fig. 2. Differences in gene expression associated with CMV+ human milk.
Differential gene expression analysis comparing CMV− to CMV+ milk samples. A QQ-plot from the results of differential gene expression analysis in DESeq2. The x axis plots the expected P value for the number of genes tested following a uniform distribution of P values from 0 to 1, and the y axis plots the observed two-sided unadjusted P values. Genes whose P value was below the false discovery rate threshold of 5% are colored in magenta. B Volcano plot comparing estimated effect sizes of CMV+ on milk gene expression (x axis) with each gene’s unadjusted two-sided P value (y axis). Genes whose P value was below the false discovery rate threshold of 5% are colored in magenta. P values and log2 fold change were calculated in DESeq2. C Comparison of log fold change in CMV+ samples from our bulk RNA-seq data (x axis) vs. gene expression in a publicly available human milk single-cell RNA-seq dataset (y axis). Gene expression from milk single cells is plotted as the difference between scaled gene expression in immune cells and mammary luminal cells, to display that genes more highly expressed in our CMV+ milk samples tended to be more highly expressed in the immune cells in milk.
Fig. 3
Fig. 3. The IDO tryptophan-to-kynurenine pathway is upregulated in CMV+ milk.
A Kynurenine abundances in CMV− (N = 84, orange) vs. CMV+ (N = 58, purple) milk samples. Plotted kynurenine levels (y axis) are residuals after correcting for covariates included in the differential abundance analysis (see Methods). B IDO1 expression in CMV− (N = 147, orange) vs. CMV+ (N = 74, purple) milk samples. Each dot represents a milk sample. LogFC: log fold-change between CMV+ and CMV− samples. In boxplots, the thick center line represents the median, the upper and lower hinges represent the 75th and 25th percentiles, and the whiskers extend to the largest/smallest value no further than 1.5 times the interquartile range from the hinge. C IDO1 encodes the enzyme indoleamine 2,3-dioxygenase (IDO), which performs the rate-limiting step converting tryptophan-to-kynurenine. Kynurenic acid is metabolized from kynurenine by the KAT enzyme. D Correlation between IDO1 expression (x axis) and the ratio of kynurenine and tryptophan abundances (y axis) in milk samples (N = 111), stratified by CMV status (orange: CMV−, purple: CMV+). Each dot represents a milk sample. The effect estimate and unadjusted two-sided P value were calculated in a linear regression of the log scaled kynurenine/tryptophan ratio residuals after regressing covariates (see Methods), against IDO1 log TPM and milk CMV status.
Fig. 4
Fig. 4. Differences in gut microbiome associated with CMV+ milk.
A Comparison of PC3 values for 1-month infant fecal samples fed CMV− (N = 81, orange) vs. CMV+ (N = 48, purple) breastmilk. Principal component analysis was performed on the taxon abundance table for infant fecal samples at 1 month of age. Each dot represents an infant fecal sample. Plotted PC3 levels are residuals after correcting for covariates included in the association analysis with milk CMV status (see Methods). B Estimated effect of CMV+ milk on normalized microbial taxa abundances in the infant gut, modeling samples from both 1 month (N = 76 CMV−, N = 46 CMV+) and 6 months (N = 77 CMV−, N = 44 CMV+) of age in a linear mixed model with infant age as a covariate (Methods). All taxa listed had a P value below a false discovery rate of 5%. Taxa are arranged from smallest (top) to largest (bottom) P value. Taxon names ending in ‘A’ were identified as distinct species by sequence identity in the reference genome database (see Methods). C The distribution of Bifidobacterium infantis abundances in the infant fecal microbiome, for infants fed CMV− (orange) or CMV+ (purple) milk, at 1 month (N = 76 CMV−, N = 46 CMV+) and 6 months (N = 77 CMV−, N = 44 CMV+) of age. Plotted B. infantis levels are residuals after correcting for covariates included in the association analysis with milk CMV status (see Methods). In B and C, taxon relative abundances were centered log-ratio transformed and scaled to mean 0, standard deviation 1 before association analysis. In boxplots, the thick center line represents the median, the upper and lower hinges represent the 75th and 25th percentiles, and the whiskers extend to the largest/smallest value no further than 1.5 times the interquartile range from the hinge.
Fig. 5
Fig. 5. Associations between CMV+ milk and infant growth.
Results of multivariate regressions of infant anthropometric measurements vs. milk CMV status, proportion CMV-mapped reads in milk, or milk kynurenine. All regression models included the equivalent Z score at birth as a covariate (except when the Z score at birth was the response variable). A Estimated effect of CMV+ milk on infant growth metrics at birth, 1 month, and 6 months of age. Error bars represent 95% confidence intervals. *P < 0.05; LAZ length-for-age Z score, light green; WAZ weight-for-age Z score, light blue; WLZ weight-for-length Z score, dark blue. Error bars represent a 95% confidence interval for the effect estimate. B Within infants fed CMV+ milk, there was a negative correlation between the proportion of CMV-mapped reads and infant WLZ at 1 month of age. The shaded gray area is the linear regression 95% confidence interval. C Within infants fed CMV+ milk, there was a positive correlation between the proportion of CMV-mapped reads and infant WLZ at 1 month of age. The shaded gray area is the linear regression 95% confidence interval. D There was a positive correlation between the abundance of kynurenine in milk and infant WLZ at 1 month, when tested for infants fed CMV+ (N = 68, purple) or CMV− (N = 118, orange) milk separately. The shaded areas are the linear regression 95% confidence intervals. All plotted infant growth metrics in BD are residuals after correcting for covariates included in the association analyses with milk CMV status (see Methods). E Structural equation modeling of the relationship between milk kynurenine, milk CMV status, and infant 1-month WLZ. Multiple models were tested (Supplementary Fig. 14), with the best-fit model plotted here. Arrows next to numbers represent the standardized effect estimates, with asterisks indicating unadjusted two-sided P values. There was no evidence of milk kynurenine mediating a relationship between milk CMV status and infant 1-month WLZ, nor CMV status mediating a relationship between milk kynurenine and infant 1-month WLZ. F A structural equation model examining the relationships between milk proportion of CMV-mapped reads (‘Milk prop. CMV reads’, a proxy for viral load, within CMV+ milk samples), milk kynurenine, and infant 1-month WLZ. Arrows next to numbers represent the standardized effect estimates, with asterisks indicating unadjusted two-sided P values. The best-fit model plotted here found did not find evidence for kynurenine mediating the relationship between viral load and 1-month WLZ, but did support a direct effect from viral load to 1-month WLZ. E, F All tested models, their fit measures, and exact P values are shown in Supplementary Fig. 15. Purple boxes indicate milk traits, green boxes infant traits.

Update of

References

    1. Zuhair, M. et al. Estimation of the worldwide seroprevalence of cytomegalovirus: a systematic review and meta-analysis. Rev. Med. Virol.29, e2034 (2019). 10.1002/rmv.2034 - DOI - PubMed
    1. Sinzger, C. et al. Fibroblasts, epithelial cells, endothelial cells and smooth muscle cells are major targets of human cytomegalovirus infection in lung and gastrointestinal tissues. J. Gen. Virol.76, 741–750 (1995). 10.1099/0022-1317-76-4-741 - DOI - PubMed
    1. Hamprecht, K. & Goelz, R. Postnatal cytomegalovirus infection through human milk in preterm infants: transmission, clinical presentation, and prevention. Clin. Perinatol.44, 121–130 (2017). 10.1016/j.clp.2016.11.012 - DOI - PubMed
    1. Hamprecht, K., Witzel, S., Maschmann, J., Speer, C. P. & Jahn, G. Transmission of cytomegalovirus infection through breast milk in term and pretern infants. In Short and long term effects of breast feeding on child health (eds. Koletzko, B., Michaelsen, K. F. & Hernell, O.) 231–239 (Springer US, Boston, MA, 2002).
    1. Lazar, K., Rabe, T., Goelz, R. & Hamprecht, K. Human cytomegalovirus reactivation during lactation: impact of antibody kinetics and neutralization in blood and breast milk. Nutrients12, 338 (2020). 10.3390/nu12020338 - DOI - PMC - PubMed

MeSH terms