. 2024 Jul 23;14(1):16972.
doi: 10.1038/s41598-024-65090-5.

Comprehensive analysis of endoplasmic reticulum stress related signature in head and neck squamous carcinoma

Affiliations

Comprehensive analysis of endoplasmic reticulum stress related signature in head and neck squamous carcinoma

Yu Miao et al. Sci Rep. .

Abstract

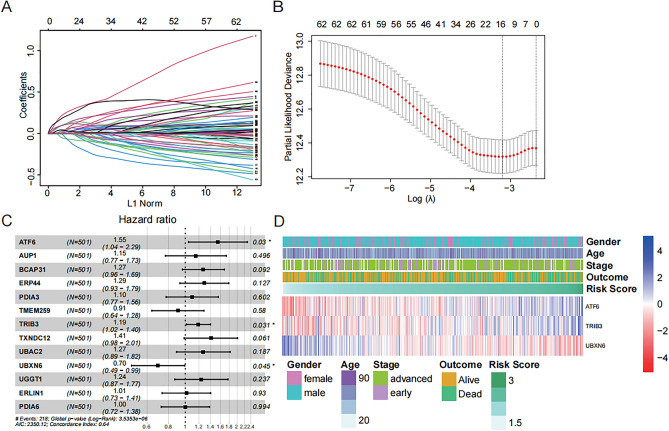
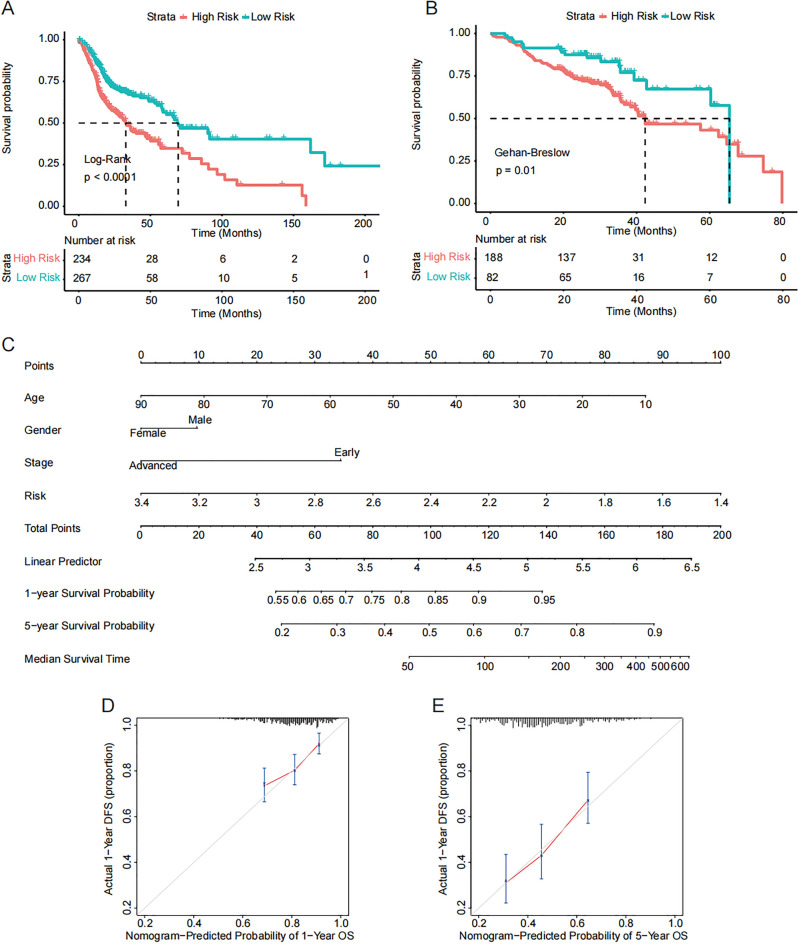
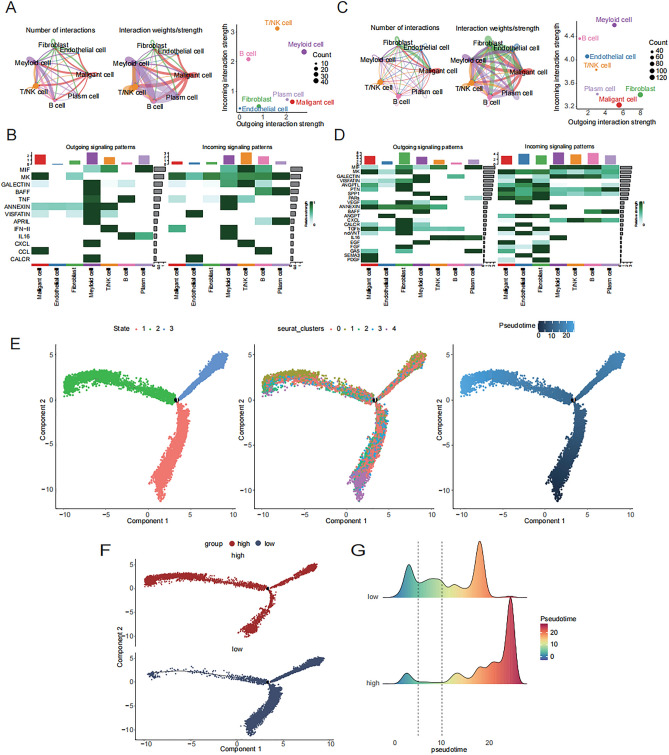
Head and neck squamous carcinoma (HNSC) is a prevalent malignant disease, with the majority of patients being diagnosed at an advanced stage. Endoplasmic reticulum stress (ERS) is considered to be a process that promotes tumorigenesis and impacts the tumor microenvironment (TME) in various cancers. The study aims to investigate the predictive value of ERS in HNSC and explore the correlation between ERS-related genes and TME. A series of bioinformatics analyses were carried out based on mRNA and scRNA-seq data from the TCGA and GEO databases. We conducted RT-qPCR and western blot to validate the signature, and performed cell functional experiments to investigate the in vitro biological functions of the gene. We identified 63 ERS-related genes that were associated with outcome and stage in HNSC. A three-gene signature (ATF6, TRIB3, and UBXN6) was developed, which presents predictive value in the prognosis and immunotherapy response of HNSC patients. The high-risk group exhibited a worse prognosis but may benefit from immunotherapy. Furthermore, there was a significant correlation between the signature and immune infiltration. In the high-risk group, fibroblasts were more active in intercellular communication, and more T cells were observed at the end of the sequential phase. The genes in the ERS-related signature were overexpressed in HNSC cells, and the knockdown of TRIB3 significantly inhibited cell proliferation and migration. This study established a novel ERS-related signature that has potential implications for HNSC therapy and the understanding of TME.

Keywords: Endoplasmic reticulum stress; Head and neck squamous carcinoma; Immunotherapy response; Prognosis; TME.


Conflict of interest statement

The authors declare no competing interests.

Figures

Figure 1
Figure 1
Identifying clinical phenotypes associated genes by WGCNA. (A) Identifying soft-threshold power in WGCNA. (B) Cluster Dendrogram of five gene modules in WGCNA. (C) Module-phenotype relationships between five gene modules and phenotypes (stage and outcome). (D) Venn diagram of differentially expressed genes in MEyellow and MEturquoise modules.
Figure 2
Figure 2
Establishment of an ERS-related risk signature. (A) Visualization of partial likelihood deviance in LASSO. (B) The minimum value and the optimal λ in LASSO. (C) Forest plot of the result in multivariate Cox regression analysis. (D) Heatmap of the expression of genes in ERS-related signature (ATF6, TRIB3, UBXN6) with phenotype data (including gender, age, stage and outcome).
Figure 3
Figure 3
Validation of the prognostic value in ERS-related signature. (A,B) Survival curves of risk groups and overall survival in TCGA HNSC cohort (A) and GEO cohort (B). (C) Nomogram for predicting prognosis in HNSC. (D-E) Calibration curves for the nomogram in 1 year (D) and 5 years (E).
Figure 4
Figure 4
Mutation profiles in ERS-related signature in HNSC. (A-B) Diagram of Mutation profiles in the low- (A) and high-risk group (B). (C,D) Lollipop mutation diagrams of TP53 in the low- (C) and high-risk group (D). (E) TMB between the in the high- and low-risk group. (F) The correlation between risk score and TMB score. (G) Survival analysis of different risk groups in the immunotherapy cohort.
Figure 5
Figure 5
The assessment of immune infiltration in HNSC. (A) Relative abundance of 22 types of immune cells between low- and high-risk groups in HNSC. (BE) Correlation plots of the association between risk score and immune score (B), CD8 + T cells (C), activated NK cells (D) and resting NK cells (E). (F) Bubble diagram of the association between mRNA expression of each gene in ERS-related signature (ATF6, TRIB3, UBXN6) and relative abundances of 22 types of immune cells. * means p value less than 0.05, **means p value less than 0.01.
Figure 6
Figure 6
Single cell RNA sequence (scRNA-seq) profiling. (A) The UMAP plot provides an annotation and color codes for the different cell types present in tumors and adjacent normal tissues. (B) Marker genes in each cluster. (C) The expression of genes in the ERS-related signature in each cluster. (D) Histograms shows the percentage of cell types between high- and low-risk groups. (E) The UMAP plot shows the clustering of T/NK cells.(F)Marker genes for the clustering of T/NK cells. (G) Histograms shows the proportion of different T/NK cell clusters in the high-risk and low-risk groups. (H) GSVA shows the enrichment of specific pathways in CD8+ T cells between high-(red) and low-risk(blue) groups.
Figure 7
Figure 7
Cell–cell communications and trajectory analysis. (AD) The visualization of interactions of different cell subtypes between low- (A,B) and high-risk (C,D) groups. (E) The state, clusters and pseudotime of CD8+ Tcells. (F,G) The dot plot diagram (F) and density-distribution map (G) of T cells between high- and low-risk groups.
Figure 8
Figure 8
In vitro validation of ERS-related signature in HNSC cell lines. (AC) The mRNA expression of ATF6(A), TRIB3(B) and UBXN6(C) between normal and tumor cells. (D) The protein expression of TRIB3 in normal and tumor cells. (E) Knockdown of TRIB3 in mRNA (upper panel) and protein (lower panel) levels. (F) Images and quantification of colony assays in SAS and CAL33 cells. (G,H) The CCK-8 assay in SAS (G) and CAL33 (H) cells. (I) The wound healing assay in CAL33 and SAS cells. Data are presented as the mean ± SD.

References

    1. Johnson, D. E. et al. Head and neck squamous cell carcinoma. Nat. Rev. Dis. Primers6, 92 (2020). 10.1038/s41572-020-00224-3 - DOI - PMC - PubMed
    1. Bhat, A. A. et al. Tumor microenvironment: an evil nexus promoting aggressive head and neck squamous cell carcinoma and avenue for targeted therapy. Signal Transduct. Target Ther.6, 12 (2021). 10.1038/s41392-020-00419-w - DOI - PMC - PubMed
    1. Solomon, B., Young, R. J. & Rischin, D. Head and neck squamous cell carcinoma: Genomics and emerging biomarkers for immunomodulatory cancer treatments. Semin. Cancer Biol.52, 228–240 (2018). 10.1016/j.semcancer.2018.01.008 - DOI - PubMed
    1. Fasano, M. et al. Immunotherapy for head and neck cancer: Present and future. Crit. Rev. Oncol. Hematol.174, 103679 (2022). 10.1016/j.critrevonc.2022.103679 - DOI - PubMed
    1. Elmusrati, A., Wang, J. & Wang, C. Y. Tumor microenvironment and immune evasion in head and neck squamous cell carcinoma. Int. J. Oral Sci.13, 24 (2021). 10.1038/s41368-021-00131-7 - DOI - PMC - PubMed

MeSH terms

LinkOut - more resources