. 2024 Jul 24;15(1):6237.
doi: 10.1038/s41467-024-50554-z.

Multiomic profiling of medulloblastoma reveals subtype-specific targetable alterations at the proteome and N-glycan level

Affiliations

Multiomic profiling of medulloblastoma reveals subtype-specific targetable alterations at the proteome and N-glycan level

Shweta Godbole et al. Nat Commun. .

Abstract

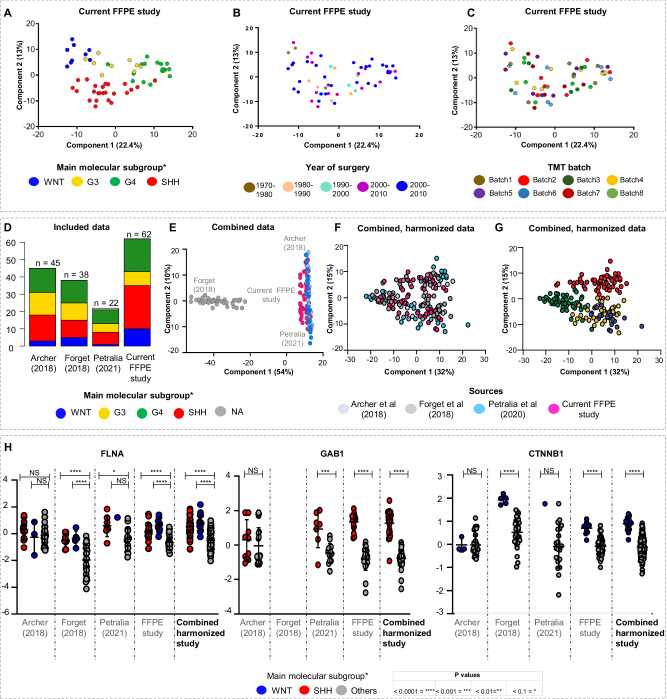
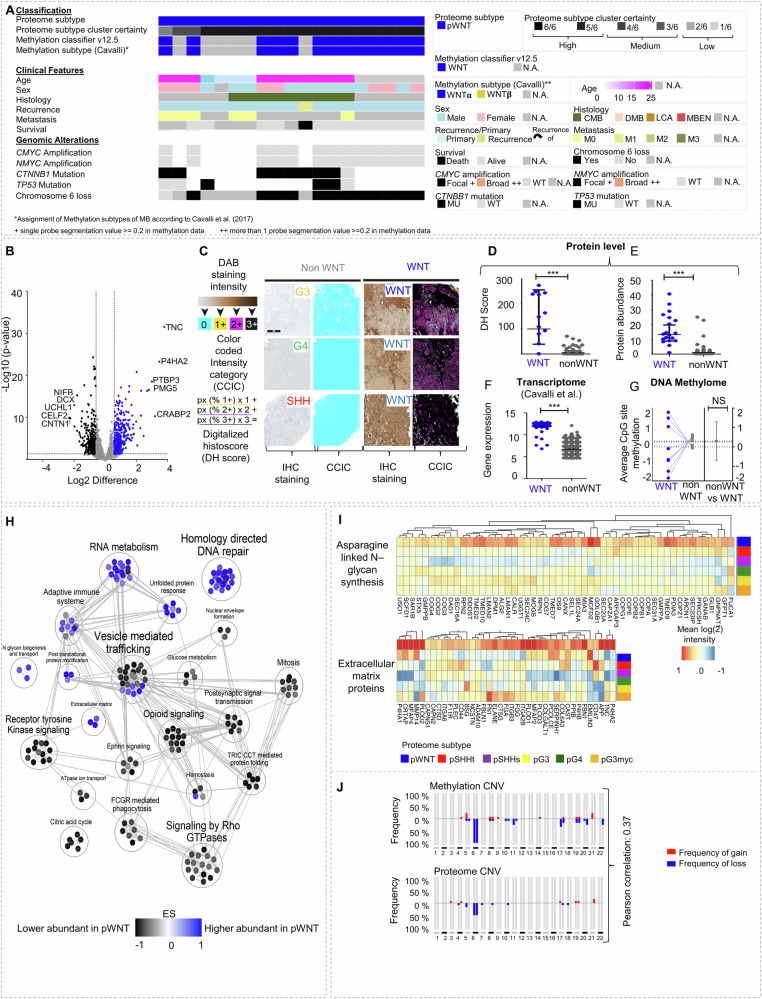
Medulloblastomas (MBs) are malignant pediatric brain tumors that are molecularly and clinically heterogenous. The application of omics technologies-mainly studying nucleic acids-has significantly improved MB classification and stratification, but treatment options are still unsatisfactory. The proteome and their N-glycans hold the potential to discover clinically relevant phenotypes and targetable pathways. We compile a harmonized proteome dataset of 167 MBs and integrate findings with DNA methylome, transcriptome and N-glycome data. We show six proteome MB subtypes, that can be assigned to two main molecular programs: transcription/translation (pSHHt, pWNT and pG3myc), and synapses/immunological processes (pSHHs, pG3 and pG4). Multiomic analysis reveals different conservation levels of proteome features across MB subtypes at the DNA methylome level. Aggressive pGroup3myc MBs and favorable pWNT MBs are most similar in cluster hierarchies concerning overall proteome patterns but show different protein abundances of the vincristine resistance-associated multiprotein complex TriC/CCT and of N-glycan turnover-associated factors. The N-glycome reflects proteome subtypes and complex-bisecting N-glycans characterize pGroup3myc tumors. Our results shed light on targetable alterations in MB and set a foundation for potential immunotherapies targeting glycan structures.


Conflict of interest statement

The authors declare no competing interests.

Figures

Fig. 1
Fig. 1. Harmonization and integration of proteome Medulloblastoma (MB) datasets.
NIPALS principal component analyses (PCA) of measured FFPE samples (n = 62) with assignment to (A) the four main molecular MB subgroups, (B) age of measured samples, (C) measured TMT batch. D Overview of analyzed datasets. PCA of data before (E) and after (F, G) data harmonization using ComBat in the HarmonizR framework annotated for the source of the samples (F) and for main molecular MB subgroups (n = 167, source data file has been provided). H Protein abundance of the the WNT and SHH MB marker FILAMIN A (nSHH_Archer = 15, nWNT_Archer = 3, nOthers_Archer = 27, nSHH_Forget = 10, nWNT_Forget = 5, nOthers_Forget = 23, nSHH_Petralia = 7, nWNT_Petralia = 1, nOthers_Petralia = 14, nSHH_FFPE = 25, nWNT_FFPE = 10, nOthers_FFPE = 27, nSHH_combined = 57, nWNT_combined = 19, nOthers_combined = 91, two-tailed, unpaired t test, pshhArchervsOtherArcher = n.s., pWNTArchervsOtherArcher = n.s., pshhForgetvsOtherForget < 0.0001, pWNTForgetvsOtherForget < 0.0001, pshhPetraliavsOtherPetralia = 0.02, pwntPetraliavsOtherPetralia = n.s., pshhFFPEvsOtherFFPE < 0.0001, pwntFFPEvsOtherFFPE < 0.0001, pshhcombinedvsOthercombined < 0.0001, pshhcombinedvsOthercombined < 0.0001) SHH MB marker GAB1 (nSHH_Archer = 15, nOthers_Archer = 30, nSHH_Forget = 10, nOthers_Forget = 28, nSHH_Petralia = 7, nOthers_Petralia = 15, nSHH_FFPE = 25, nOthers_FFPE = 37, nSHH_combined = 57, nOthers_combined = 110, two-tailed,unpaired t test, pshhArchervsOtherArcher = n.s., pshhPetraliavsOtherPetralia = 0.008, pshhFFPEOtherFFPE < 0.0001, pshhcombinedOthercombined < 0.0001)., and the WNT MB marker CTNNB1 (nWNT_Archer = 3, nOthers_Archer = 42, nWNT_Forget = 5, nOthers_Forget = 33, nWNT_Petralia = 1, nOthers_Petralia = 21, nWNT_FFPE = 10, nOthers_FFPE = 52, nWNT_combined = 19, nOthers_combined = 148, two-tailed, unpaired t test, pwntArchervsOtherArcher = n.s., pwntForgetvsOtherForget < 0.0001, pwntPetraliavsOtherPetralia = n.s., pwntFFPEOtherFFPE < 0.0001, pwntcombinedOthercombined < 0.0001). Data are presented as mean values ± SD in each dataset individually and in the joint dataset after harmonization PCAs are based on ≥70% valid values, *: p < 0.05, **p < 0.01, ***p < 0.001, ****p < 0.0001, n.d. = not detected, NS = not significant, n represents biologically independent human samples.
Fig. 2
Fig. 2. MB segregate into six proteome subtypes.
A Proportion of ambiguous clustering (PAC) scores for k = 2–12 in consensus clustering of the main cohort, using different cluster algorithms (nMB = 167, based on ≥30% valid values). B Optimal clustering of proteome data. Consensus scores are shown in color scale from white (samples never cluster together) to blue (samples always cluster together). Six proteome subtypes, pWNT, pSHHt, pSHHs, pG3myc, pG3 and pG4, were defined. C Visualization of the first three principal components. D Clinical sample information. E Log-rank (Mantel-Cox) test comparing the survival curves of proteome subtypes (p value < 0.001, overall χ2-square test). F Group specific mean log 2 protein intensity of protein subtype marker candidate proteins. n represents biologically independent human samples.
Fig. 3
Fig. 3. Proteome subtypes of MB can be assigned to two main profiles.
A Proteome cluster similarity hierarchy based on stepwise increasing k-means execution from k = 2–6 with network analyses showing gene set overlap dependent MCL clustering of enriched gene sets, comparing pG3, pG4 and pSHHs (n = 79, profile 1), to pWNT, pG3myc, pSHHt (n = 88, profile 2). Gene set enrichment analysis (GSEA) was based on REACTOME pathways for all analysis. Top two upregulated genesets based on differentially abundant proteins using Ingenuity Pathway Analyses (IPA) in profile 1 (opioid signaling and SNARE complex (two-tailed, unpaired t-test, log2 FC > 1.5 and p value < 0.05)) (B)) and profile 2 (EIF2 signaling and cell cycle control of chromosomal replication (log2 FC > 1.5 and p value < 0.05) (C). IPA-based pathway analyses of opiod signaling (D) and cell cycle control of chromosomal replication (E) indicating therapeutic targets with respective drugs. n represents biologically independent human samples.
Fig. 4
Fig. 4. Correlation between DNA methylome and proteome features.
A Circular plot from mixOmics analyses based on selected features of the first five components from proteome and methylome data. The plot illustrates features with correlation r > 0.7 represented on side quadrants. Proteome group-specific feature levels are shown in the outer circle. B Proteome subtype-specific Pearson correlation calculated between matched proteins and CpG methylation sites. The number of proteins correlating with CpG site methylation of their own gene (r > 0.7) is shown in color. The pie chart shows the distribution of correlating CpG sites concerning the position in a gene. C Subtype independent Pearson correlation between 3990 proteins and 381,717 methylation probes focusing on subtype-specific biomarkers. Pearson Correlations >0.7 are shown, CpG sites correlating with the corresponding gene are highlighted in blue. Some biomarkers correlated with more than one CpG site of their own gene (GAB1: 7, GNB3: 2, IGSF21: 3, MICAL1: 3, and PALMD: 2). D Scatterplot of the 10 biomarker proteins correlating with the CpG site(s) of their own gene (Pearson correlation > 0.7, p < 0.001). The linear regression line was aligned for all correlating CpG site(s), SE = 0.95.
Fig. 5
Fig. 5. SHH MB comprise two proteome MB subtypes.
A Histological, molecular, and clinical characteristics of the MB subtypes pSHHt (n = 43) and pSHHs (n = 14). B Volcano plot showing differentially abundant proteins comparing pSHHs tumors to all other proteome subtypes (two-tailed, unpaired t test, p value < 0.05; log2FC > 1.5). C MCL clustering of enriched gene sets in pSHHs MBs. D Copy number variations (CNV) plots of matched pSHHs MB (n = 6) calculated from either DNA methylation or proteome data with pearson correlation between both omic types (r = 0.01). E Differentially abundant proteins when comparing pSHHt tumors to all other proteome subtypes (two-tailed, unpaired t-test, p value < 0.05; log2FC > 1.5). F MCL clustering of enriched gene sets in pSHHt. G CNV plots for matched pSHHt MBs (n = 29) calculated from either DNA methylation or proteome data with Pearson correlation between both omic types (r = 0.2) H Heatmaps showing mean MB subtype protein abundance hallmark genesets homology directed repair (GSEA differential expression analysis normalized enrichment score (NES), NESpSHHt = 2.2, p = <0.0001, FDR < 0.25), replication (NESpSHHt = 2.2, p = 0.01), TCA cycle and respiratory electron transport (NESpSHHs = 3.9, p = <0.0001, FDR < 0.25) and transmission across chemical synapses (NESpSHHs = 3.2, p = <0.0001, FDR < 0.25) based on differentially abundant proteins. I Overall survival of pSHHt MB (n = 23) and pSHHs MB (n = 5) and overall survival of pSHHt MB depended on TP53 mutation status. TP53 mutated cases displayed a significantly worse survival (Mantel cox test p value = 0.04). J Volcano plot, showing differentially abundant proteins when comparing TP53 mutated cases to wildtype cases in pSHHt tumors (two-tailed, unpaired t test, p value < 0.05; log2FC > 1.5). n represents biologically independent human samples.
Fig. 6
Fig. 6. pG3myc tumors display an enhanced MYC target protein profile and can be identified by Palmdelphin (PALMD) staining.
A Histological, molecular, and clinical characteristics of the MB subtypes pG3myc (n = 26), pG3 (n = 15) and pG4 (n = 40). B Volcano plot showing differentially abundant proteins when comparing pG4 tumors to all other proteome subtypes (two-tailed, unpaired t-test, p value < 0.05; log2FC > 1.5). C MCL clustering of enriched gene sets in pG4 MB. D CNV plots of pG4 MBs (n = 40) were calculated from either DNA methylation or proteome data with Pearson correlation between both omic types (r = 0.12). E Differentially abundant proteins when comparing pG3 tumors to all other proteome subtypes (two-tailed, unpaired t test, p value < 0.05; log2FC > 1.5). F MCL clustering of enriched gene sets in pG3 MB. G DNA methylation or proteome CNV plots of pG3 MB (n = 11) with Pearson correlation between both omic types (r = 0.11). H Differentially abundant proteins in pG3myc MB. Palmdelphin (PALMD) was highly abundant in pG3myc tumors (two-tailed, unpaired t test, p value < 0.05; log2FC > 1.5). I MCL clustering of enriched gene sets, in pG3myc MB. J DNA methylation or proteome CNV plots of pG3myc MB (n = 20) with pearson correlation between both omic types (r = 0.06). K Mean protein abundance in MB subtypes for hallmark gene sets MYC Targets V1 and MYC Targets V2. L Scheme and representative images of digitally supported immunostaining intensity quantification of PALMD immunostainings in MB. Quantified pixels of different staining intensities were used to calculate a digital Histo-score (DHS, source data file has been provided) M Significantly enhanced digital histoscore for PALMD in pG3myc MB (npG3myc = 7) compared to all other MB subtypes (nOthers = 22, p < 0.0001, data are presented as mean values ± SD). N Protein abundance for PALMD in pG3myc MB (npG3myc = 21) compared to all other MB subtypes (nOthers = 84, unpaired t test, p < 0.0001, data are presented as mean values ± SD). O PALMD gene expression in pG3myc MBs (npG3myc = 6) compared to all other MB subtypes (nOthers = 30, two-tailed, unpaired t-test, p < 0.0001, data extracted from Archer et al. 2018, data are presented as mean values ± SD). P Average DNA methylation at CpG sites of the PALMD gene (Mean M values of npG3myc = 6 CpG sites shown, two-tailed, unpaired t test, p value < 0.001, data are presented as mean values ± SD). pG3myc MBs show significant lower levels of methylation (two-tailed, unpaired t test, p < 0.0001). Q GSEA showing the top 10 up or downregulated pathways comparing pG3myc MB to pG3/4 MB (GSEA differential expression analysis normalized enrichment score (NES), p < 0.01, FDR < 0.25). n represents biologically independent human samples. For immunostaining, each sample was stained once.
Fig. 7
Fig. 7. pWNT MB show high feature conservation and can be identified by Tenascin C (TNC) staining.
A Histological, molecular, and clinical characteristics of the pWNT MB subtype (n = 19). B Differentially abundant proteins when comparing pWNT tumors to all other proteome subtypes (two-tailed, unpaired t test, p value < 0.05; log2FC > 1.5). C Scheme and representative images of digital quantification of TNC immunostainings in MB (source data file has been provided). D Significantly enhanced DHS for TNC in pWNT MB (npWNT=9) compared to all other MB subtypes (nothers=28, two-tailed, unpaired t test, p < 0.0001, data are presented as mean values ± SD). E Protein abundance for TNC in pWNT MBs (npWNT = 19) compared to all other MB subtypes (nothers=148, two-tailed, unpaired t test, p < 0.0001, data are presented as mean values ± SD). F TNC gene expression in WNT MBs and other MB subtypes in a published dataset of MB (nWNT = 70, nnonWNT = 693, two-tailed, unpaired t test, p < 0.001, data are presented as mean values ± SD). G Average DNA methylation at CpG sites of the TNC gene (mean value for npWNT = 8 CpG sites shown, two-tailed, unpaired t test, p = n.s., data presented as mean values ± SD). H MCL clustering of eEnriched gene sets, comparing pWNT to all other subtypes in GSEA. I Heatmaps showing mean protein abundance in MB subtypes for hallmark genesets specifically enriched in pWNT MB (GSEA differential expression analysis normalized enrichment score (NES), NESGlycan = 2.2, pGlycan = <0.001; NESEMP = 1.7, pEMP = 0.02). J CNV plots of pWNT MBs (n = 8) were calculated from either DNA methylation or proteome data with Pearson correlation between both omic types (r = 0.37). n represents biologically independent human samples. For immunostaining, each sample was stained once. NS = not significant.
Fig. 8
Fig. 8. Differential proteomics reveal low abundance of all multiprotein complex TriC/CCT components as a hallmark of pWNT MB.
A Differentially abundant proteins when comparing pWNT (n = 19) to pG3myc (n = 26) MB (two-tailed, unpaired t test, p value < 0.05; log2FC > 1.5). B GSEA showing the top 10 up or downregulated pathways comparing pG3myc MB to pWNT (GSEA differential expression analysis normalized enrichment score (NES), p < 0.05, FDR < 0.25). C Mean protein abundancies, gene expression values and methylation at CpG sites for all components of the tailless complex polypeptide 1 ring complex/Chaperonin containing tailless complex polypeptide 1 (TriC/CCT) per proteome subtype in matched cases (npWNT = 4, npSHHt = 14, npSHHs = 4, npG3 = 6, npG4 = 17, np3Myc = 11, data are presented as mean values ± SD. Left: Heatmaps. Middle: Quantification (two-tailed, unpaired t test). Right: p values when comparing subtypes (ppWNTvspSHHt < 0.0001, ppWNTvspSHHs < 0.0001, ppWNTvspG3 < 0.0001, ppWNTvspG3myc < 0.0001, ppWNTvspG4 < 0.0001, ppSHHtvspSHHs < 0.001, ppSHHttvspG3 < 0.0001, ppSHHtvspG3myc < 0.0001, ppSHHtvspG4 < 0.01, ppSHHsvspG3 < 0.01, ppSHHsvspG3myc < 0.0001, ppSHHsvspG4 < 0.05, ppG3vsG4 = n.s., ppG3vspG3myc < 0.0001, ppG4vspG3myc < 0.0001). D Correlation plot displaying mean correlation for each component in all three omic types. E Circus plot displaying correlations ≥0.7 for each component’s protein, gene and CpG site. Only CCT2 significantly correlated on all three levels. n represents biologically independent human samples. NS = not significant.
Fig. 9
Fig. 9. N-glycan analysis reveals significant differences across N-glycan profiles of proteomic MB subtypes.
A STRING network analyses of differentially abundant proteins involved in N-linked glycosylation. B Scheme of N-glycan analyses. C Schematic visualization of N-glycan types. D Venn diagrams showing overlap of identified glycans per MB proteome subtype (npWNT = 3, npSHHt = 3, npSHHs = 3, npG3 = 3, npG3myc = 3, npG4 = 3). E PCA, based on N-glycan abundances, illustrating the separation of proteome MB subtypes at the N-glycan level. F 2D Structure visualization for pG3myc-specific N-glycans. GlcNAc N-Acetylglucosamine, Gal Galactose, Fuc Fucose, ManNAc N-Acetylmannosamine; Neu5AC N-Acetylneuraminic acid. G Venn Diagram, comparing the identified hybrid-type and complex N-glycans between proteome subtypes. n represents biologically independent human samples.
Fig. 10
Fig. 10. Confirmation of proteome subtypes and differential feature conservation in an independent biological FFPE dataset.
A Clinical sample information with proteome subtype assignments using ACF based classification (B) PCA, based on proteins found in ≥70% samples, illustrating the separation of proteome MB subtypes (source data file has been provided). C Protein abundances of established biomarkers WNT and SHH biomarker FLNA (nWNT = 3, nSHH = 9, nOthers = 18, two-tailed, unpaired t-test, ppWNTvsothers = NS, ppSHHvsothers < 0.001), WNT biomarker CTNNB1 (nWNT = 3, nOthers = 27, two-tailed, unpaired t-test, ppWNTvsothers = NS.) and SHH biomarker GAB1 (nSHH = 9, nOthers = 21, two-tailed, unpaired t test, ppSHHvsothers < 0.001, data are represented as mean values ± SD). D Significant higher abundance of TNC (npWNT = 3, nOthers = 27, two-tailed, unpaired t-test, ppWNTvsothers < 0.0001) and PALMD (npG3myc = 3, npOthers = 27, two-tailed, unpaired t test, ppG3mycvsothers < 0.01) in pWNT and the pG3myc subtype, respectively. Data are represented as mean values ± SD. E Correlation plot displaying mean Pearson correlation per subtype between the integrated cohort and the biological validation cohort. F Hierarchical clustering of biological validation cohort samples with samples from the main cohort (Pearson correlation and ward.D2 linkage). G Heatmaps showing mean protein abundance for the top hit gene sets enriched in the transcriptional (top) and synaptic profile (bottom). H Bar plot displaying proteome subtype-specific Pearson correlation calculated for matched samples between proteins and CpG sites (r > 0.7, n = 29, total number of samples having both DNA methylome and proteome data, 5880 proteins and 549,089 CpG sites). The number of proteins correlating with CpG site of their own gene are shown in color.I Left: Heatmaps for Mean protein abundancies, gene expression values and methylation at CpG sites for all components of the tailless complex polypeptide 1 ring complex/Chaperonin containing tailless complex polypeptide 1 (TriC/CCT) per proteome subtype in matched cases (n = 29, npWNT = 3, npSHHt = 8, npSHHs = 2, npG3 = 3, npG3myc = 3, npG4 = 11) samples having both DNA methylome and proteome data). Middle: Quantification (two-tailed, unpaired t test, data are presented as mean values ± SD) Right: p values when comparing subtypes (ppWNTvspSHHt <0.0001, ppWNTvspSHHs = NS, ppWNTvspG3 < 0.0001, ppWNTvspG3myc < 0.0001, ppWNTvspG4 < 0.001, ppSHHtvspSHHs < 0.001, ppSHHttvspG3 < 0.001, ppSHHtvspG3myc < 0.0001, ppSHHtvspG4 < 0.01, ppSHHsvspG3 < 0.001, ppSHHsvspG3myc < 0.0001, ppSHHsvspG4 < 0.05, ppG3vsG4 < 0.01, ppG3vspG3myc < 0.0001, ppG4vspG3myc < 0.0001). n represents biologically independent human samples. NS = not significant.

References

    1. Louis, D. N. et al. The 2021 WHO classification of tumors of the central nervous system: a summary. Neuro Oncol.23, 1231–1251 (2021). 10.1093/neuonc/noab106 - DOI - PMC - PubMed
    1. Taylor, M. D. et al. Molecular subgroups of medulloblastoma: the current consensus. Acta Neuropathol.123, 465–472 (2012). 10.1007/s00401-011-0922-z - DOI - PMC - PubMed
    1. Schwalbe, E. C. et al. Novel molecular subgroups for clinical classification and outcome prediction in childhood medulloblastoma: a cohort study. Lancet Oncol.18, 958–971 (2017). 10.1016/S1470-2045(17)30243-7 - DOI - PMC - PubMed
    1. Hovestadt, V. et al. Medulloblastomics revisited: biological and clinical insights from thousands of patients. Nat. Rev. Cancer20, 42–56 (2022).10.1038/s41568-019-0223-8 - DOI - PMC - PubMed
    1. Cavalli, F. M. G. et al. Intertumoral heterogeneity within medulloblastoma subgroups. Cancer Cell31, 737–754.e6 (2017). 10.1016/j.ccell.2017.05.005 - DOI - PMC - PubMed