

Heavy metal impacts on antioxidants in cow blood from wastewater-irrigated areas
- PMID: 39043810
- PMCID: PMC11266697
- DOI: 10.1038/s41598-024-67792-2
Heavy metal impacts on antioxidants in cow blood from wastewater-irrigated areas
Abstract
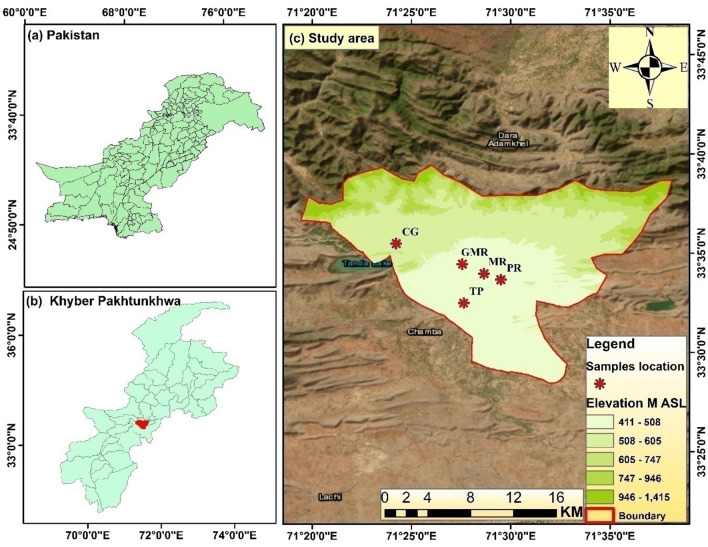
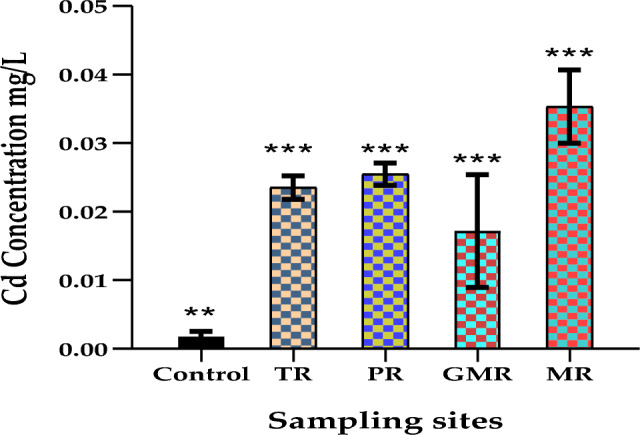
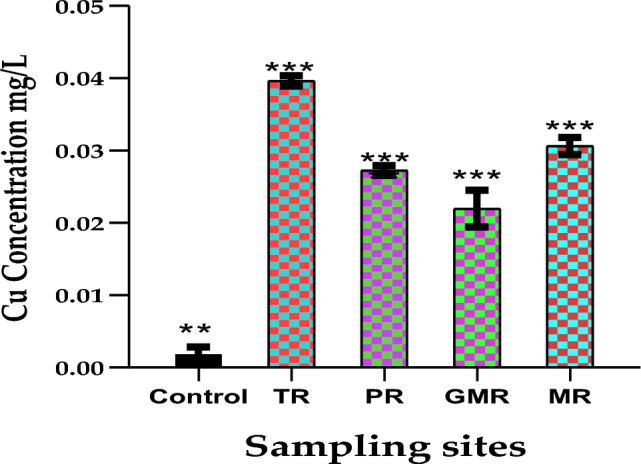
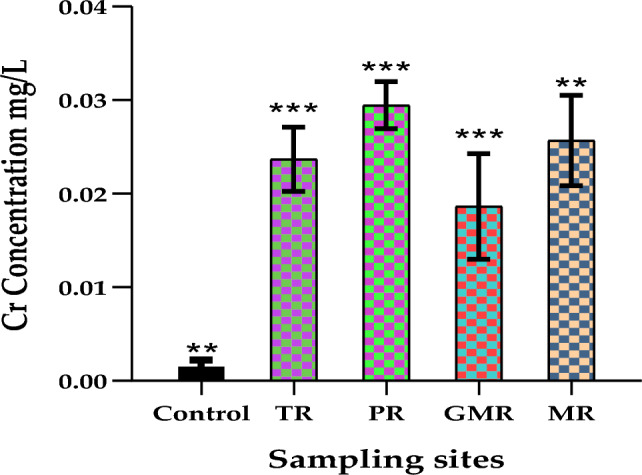
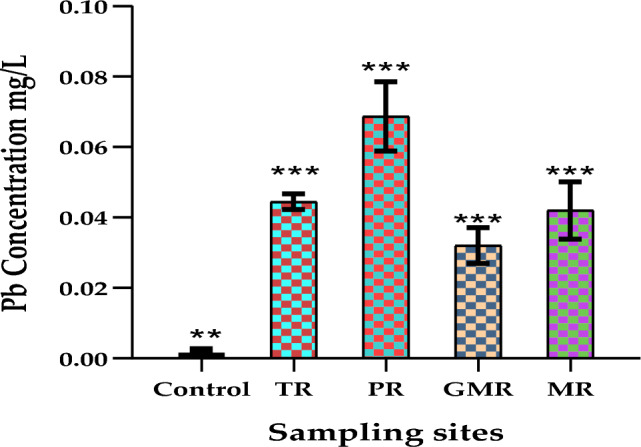
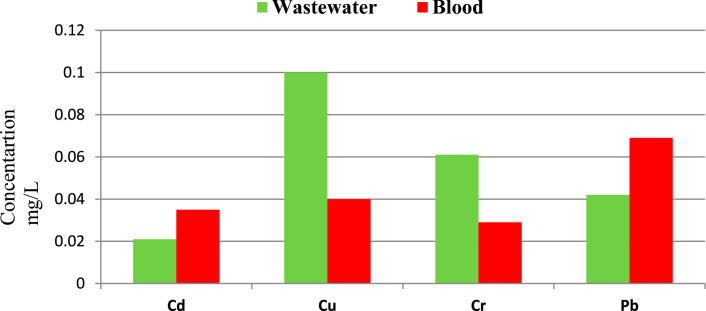
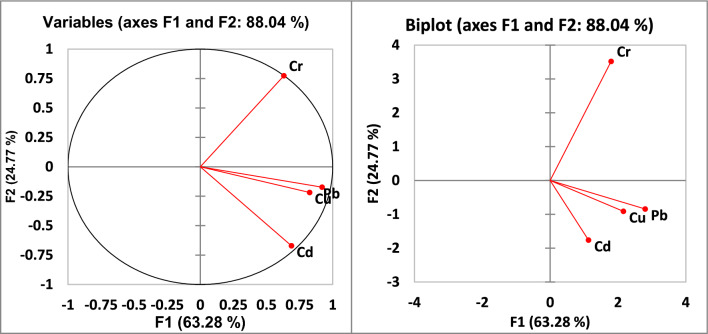
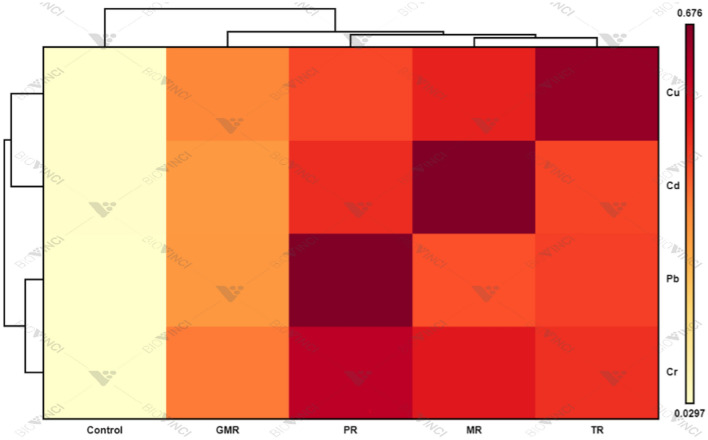
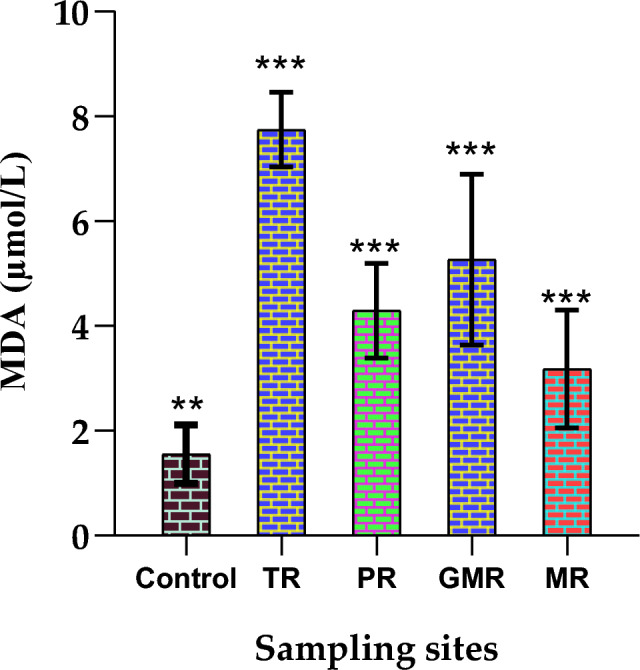
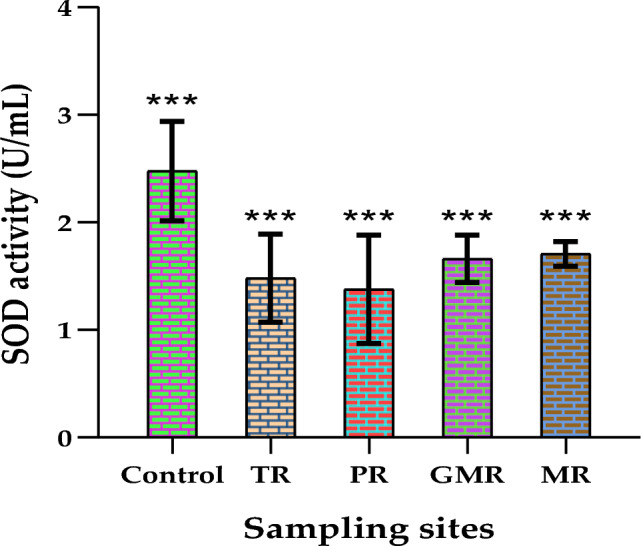
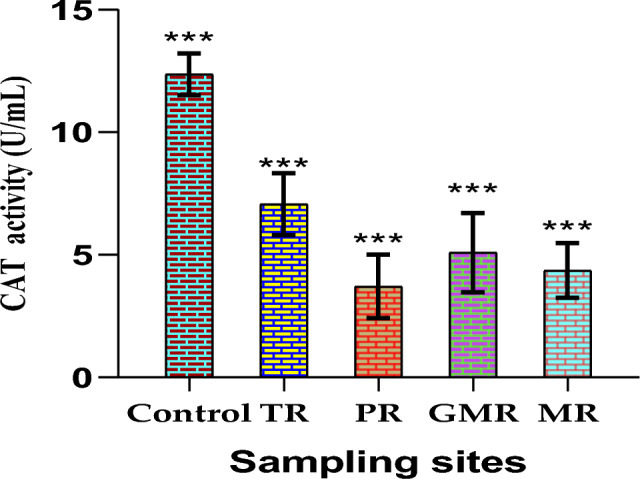
The aim of the present research was to investigate the presence of heavy metals such as lead (Pb), copper (Cu), chromium (Cr), and cadmium (Cd) in blood samples from cows raised with irrigated wastewater, as well as in the wastewater itself, in the North-western region of Pakistan. A total of 60 blood samples were collected from five different locations in Kohat, namely Tappi Road (TR), Pindi Road (PR), Gul Malik Road (GMR), Markaz Road (MR), and a control group. The samples of both i.e. cow blood and wastewater were analyzed for the concentrations of heavy metals. The highest concentration of Cd was detected in the MR site with a mean value of 0.03 mg/L, and the highest concentration of Cu (0.04 mg/L) was recorded in the TR site, while the lowest level was found in the control group with a mean of 0.002 mg/L in blood samples. The highest Cr and Pb concentrations were found at the PR site, with mean values of 0.03 and 0.07 mg/L, respectively, whereas the control group had the lowest concentrations, with mean values of 0.002 and 0.01 mg/L. Similarly, heavy metal concentrations were analyzed in wastewater used for irrigation in the study area. Results indicated elevated concentrations of Cu and Cr in wastewater, although they remained below the World Health Organization (WHO) recommended values except for Cr (0.13 mg/L) in the GMR site, which exceeded permissible limits. Cd and Pb concentrations in wastewater were relatively low, but Cd concentration surpassed WHO limits, particularly with a mean concentration of 0.08 mg/L in the TR site. Comparison between heavy metal concentrations in blood and wastewater revealed higher values of Cd and Pb in blood samples than in wastewater, while Cu and Cr concentrations were higher in water compared to blood. Additionally, elevated levels of Super Oxide Dismutase (SOD), antioxidant enzyme Catalase (CAT), and oxidative stress marker malondialdehyde (MDA) were detected in blood samples. Cluster and principal component analyses were employed to assess heavy metal toxicity among the groups, indicating potential long-term adverse health effects on animals, transfer to humans, and toxicity in living organisms.
Keywords: Antioxidants; Cows blood; Heavy metals; Oxidants; Wastewater.
© 2024. The Author(s).
Conflict of interest statement
The authors declare no competing interests.
Figures
Similar articles
-
Wastewater-Irrigated Vegetables Are a Significant Source of Heavy Metal Contaminants: Toxicity and Health Risks.Molecules. 2023 Feb 1;28(3):1371. doi: 10.3390/molecules28031371. Molecules. 2023. PMID: 36771037 Free PMC article.
-
Deciphering adverse effects of heavy metals on diverse wheat germplasm on irrigation with urban wastewater of mixed municipal-industrial origin.Environ Sci Pollut Res Int. 2018 Jul;25(19):18462-18475. doi: 10.1007/s11356-018-1996-0. Epub 2018 Apr 25. Environ Sci Pollut Res Int. 2018. PMID: 29696543
-
Heavy metal contamination of soil and vegetables in suburban areas of Varanasi, India.Ecotoxicol Environ Saf. 2007 Feb;66(2):258-66. doi: 10.1016/j.ecoenv.2005.11.007. Epub 2006 Feb 7. Ecotoxicol Environ Saf. 2007. PMID: 16466660
-
Heavy metals levels in raw cow milk and health risk assessment across the globe: A systematic review.Sci Total Environ. 2021 Jan 10;751:141830. doi: 10.1016/j.scitotenv.2020.141830. Epub 2020 Aug 21. Sci Total Environ. 2021. PMID: 33182002
-
The concentration of potentially toxic elements (PTEs) in the onion and tomato irrigated by wastewater: A systematic review; meta-analysis and health risk assessment.Food Res Int. 2019 Nov;125:108518. doi: 10.1016/j.foodres.2019.108518. Epub 2019 Jun 24. Food Res Int. 2019. PMID: 31554079
References
-
- Hosseini, N. S., Sobhanardakani, S., Cheraghi, M., Lorestani, B. & Merrikhpour, H. Heavy metal concentrations in roadside plants (Achillea wilhelmsii and Cardaria draba) and soils along some highways in Hamedan, west of Iran. Environ. Sci. Pollut. Res.27, 13301–13314 (2020).10.1007/s11356-020-07874-6 - DOI - PubMed
-
- Mukherjee, A. G. et al. Heavy metal and metalloid contamination in food and emerging technologies for its detection. Sustain.15, 1195 (2023).10.3390/su15021195 - DOI
-
- Mitra, S. et al. Impact of heavy metals on the environment and human health: Novel therapeutic insights to counter the toxicity. J. King Saud Univ. Sci.34, 101865 (2022).10.1016/j.jksus.2022.101865 - DOI
-
- Akhtar, N., Syakir Ishak, M. I., Bhawani, S. A. & Umar, K. Various natural and anthropogenic factors responsible for water quality degradation: A review. Water (Switzerland)13, 2660 (2021).
MeSH terms
Substances
LinkOut - more resources
Full Text Sources
Medical
Research Materials
Miscellaneous
