. 2024 Jul 23;7(1):894.
doi: 10.1038/s42003-024-06595-7.

Vitamin B5 metabolism is essential for vacuolar and mitochondrial functions and drug detoxification in fungi

Affiliations

Vitamin B5 metabolism is essential for vacuolar and mitochondrial functions and drug detoxification in fungi

Jae-Yeon Choi et al. Commun Biol. .

Abstract

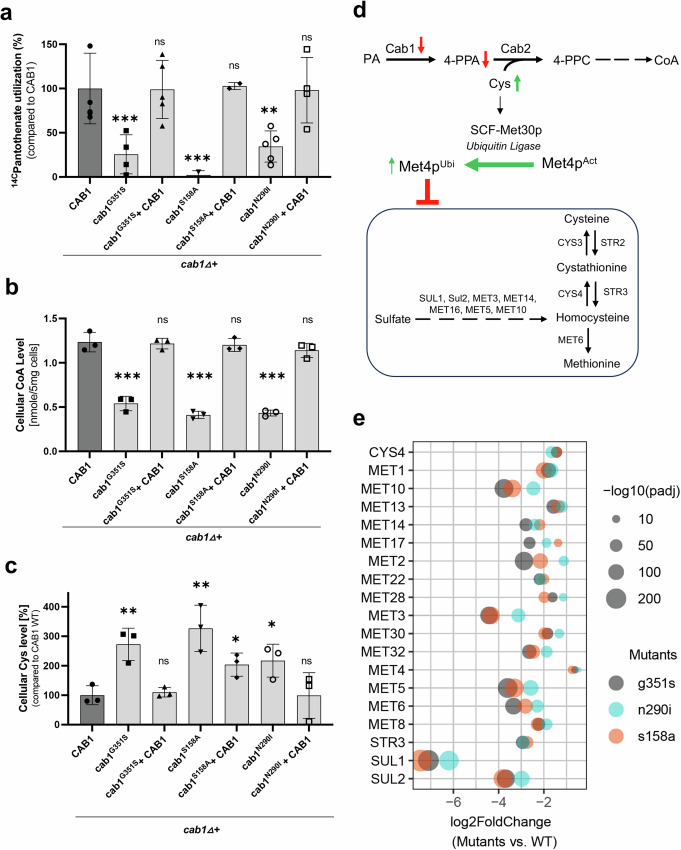
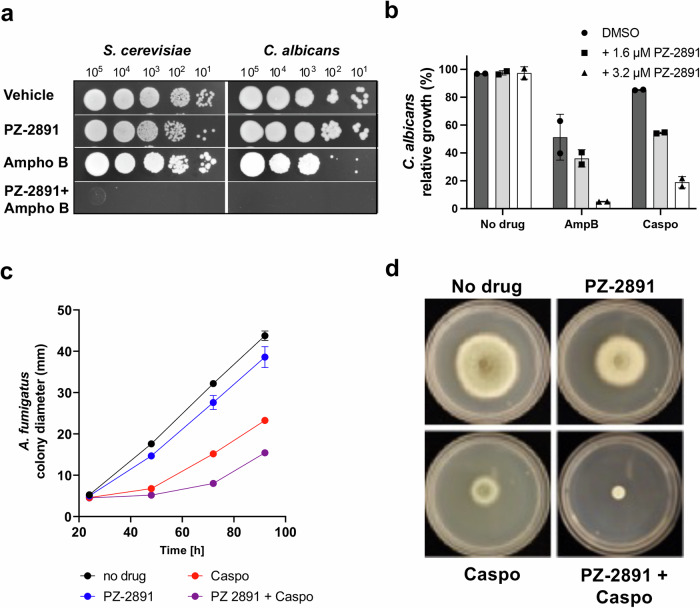
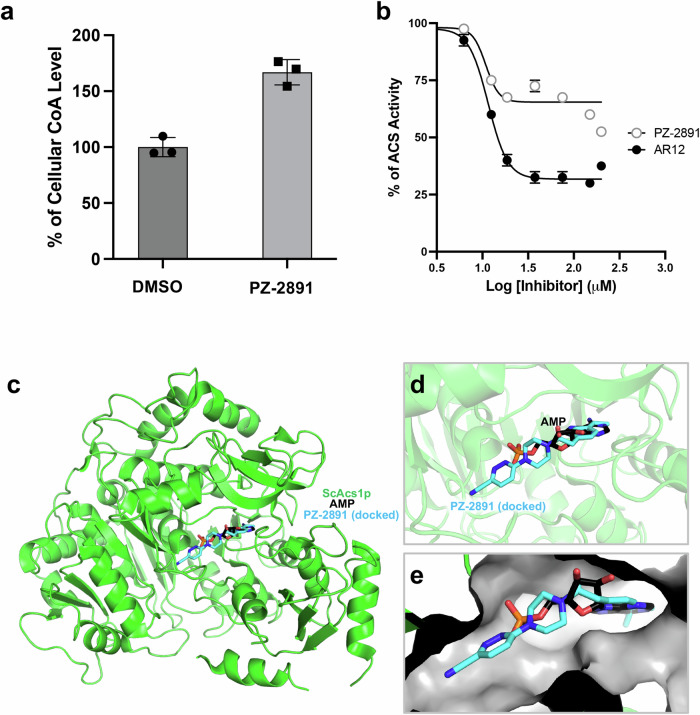
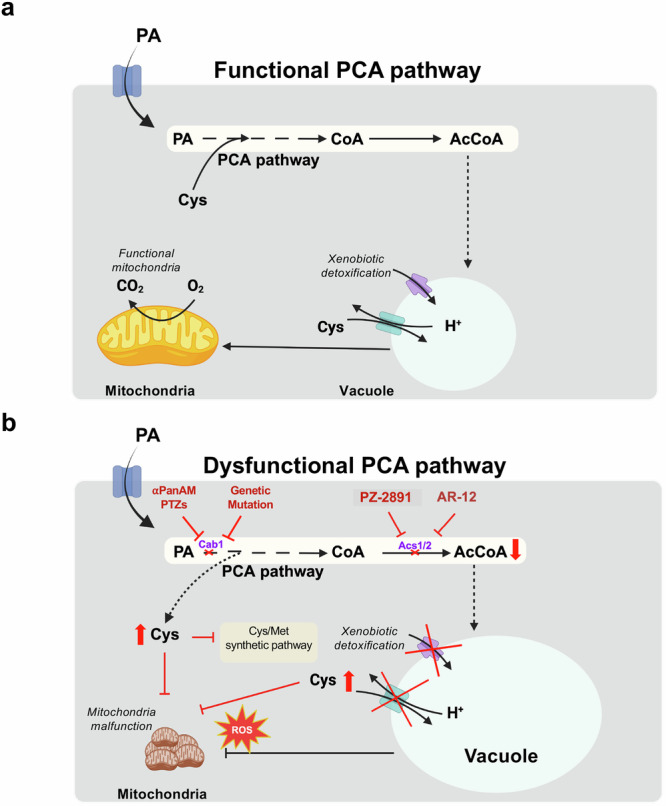
Fungal infections, a leading cause of mortality among eukaryotic pathogens, pose a growing global health threat due to the rise of drug-resistant strains. New therapeutic strategies are urgently needed to combat this challenge. The PCA pathway for biosynthesis of Co-enzyme A (CoA) and Acetyl-CoA (AcCoA) from vitamin B5 (pantothenic acid) has been validated as an excellent target for the development of new antimicrobials against fungi and protozoa. The pathway regulates key cellular processes including metabolism of fatty acids, amino acids, sterols, and heme. In this study, we provide genetic evidence that disruption of the PCA pathway in Saccharomyces cerevisiae results in a significant alteration in the susceptibility of fungi to a wide range of xenobiotics, including clinically approved antifungal drugs through alteration of vacuolar morphology and drug detoxification. The drug potentiation mediated by genetic regulation of genes in the PCA pathway could be recapitulated using the pantazine analog PZ-2891 as well as the celecoxib derivative, AR-12 through inhibition of fungal AcCoA synthase activity. Collectively, the data validate the PCA pathway as a suitable target for enhancing the efficacy and safety of current antifungal therapies.


Conflict of interest statement

The authors declare the following competing interests. C.B.M. is the founder of Curatix, which focuses on the development of anti-infectives. J.C.Y. conducted this work while an Associate Research Scientist at Yale. He is currently a Scientific Director Curatix. All other authors declare that they have no conflict of interest with the content of this article. A patent application on the use of the PAMS strategy to potentiate antifungal drugs has been submitted by CBM.

Figures

Fig. 1
Fig. 1. Cab1 mutants display growth defects and increased susceptibility toward ergosterol targeting drugs.
a Schematic diagram of Coenzyme A synthetic pathway and biological roles of the Acetyl-CoA. Pantothenate kinase (PanK) catalyzes the phosphorylation of pantothenic acid to form 4’-phosphopantothenic acid, the first step in the biosynthesis of CoA. Phosphopantothenoylcysteine synthase (PPCS) converts 4’-phosphopantothenic acid to phosphopantothenoylcysteine. Phosphopantothenoylcysteine decarboxylase (PPCD) catalyzes the decarboxylation of phosphopantothenoylcysteine to form pantetheine. Pantetheine kinase (PanK) catalyzes the phosphorylation of pantetheine to form dephospho-CoA. Dephospho-CoA kinase (DPCK) catalyzes the transfer of a phosphate group from ATP to dephospho-CoA, resulting in the formation of CoA. b- c The cab1 mutants display susceptibility toward drugs targeting ergosterol pathway and non-ergosterol targeting pathway. Yeast liquid growth curve assay with known AFDs targeting the ergosterol biosynthesis pathway was done using yeast cells harboring different CAB1 mutants. Cells were inoculated into 100 µL of YPD liquid media containing the antifungals in serial dilutions at 10 cells per µL ratio and incubated at 30 °C while cell growth was monitored by OD600. % of cell growth of individual mutant strain in presence of AFDs was obtained compared to the cell growth in the vehicle control. Liquid growth assays were conducted in 3 replicates (n = 3) and the plotted graphs represent the average of 3 data sets. d Normalized relative MIC50 of yeast strains expressing Cab1 variants against AFDs. MIC50 values were determined on MIC50 data obtained from the liquid growth assays presented in Fig. 1b, c. These values were calculated by dividing the MIC50 value of the cab1 mutant or the wild type strain for the specified AFD by the MIC50 value of the wild type strain. The plotted graph represents average of four data sets ± SD. e Complementation of the wild type CAB1 gene restores AFD resistance in the cab1 mutants to the similar level as that observed in wild-type cells. The cab1∆/w303-1B strain harboring 1) wild type CAB1, 2) cab1mutant, or 3) cab1mutant + wild type CAB1, were inoculated into synthetic glucose medium and grown overnight. Cells were harvested and re-suspended in 0.9% NaCl. Ten-fold serial dilutions of cells were spotted onto the YPD plates containing fluconazole (5 µg/mL), amphotericin B (0.25 µg/mL), and terbinafine (10 µg/mL), caspofungin (30 ng/mL), hygromycin B (20 µg/mL), or cycloheximide (100 ng/mL), and incubated at 30 °C for 3 days. The representative images are from two independent experiments, each performed in duplicates.
Fig. 2
Fig. 2. Yeast strains expressing various CAB1 mutations have defects in detoxification and vacuolar function and structure.
a The cab1 mutations altered yeast capacity to overcome metal toxicity. Solid growth assays were performed with the yeast strains described above in glucose media supplemented with 7 mM FeSO4 or with 10 mM CuSO4. The representative images are from two independent experiments, each performed in duplicates. b Morphological analysis of vacuolar defects shows that cab1 mutant strains have unusually enlarged vacuoles. Immuno-fluorescence microscopy images of cab1∆ + cab1mutant strains described above show enlarged and/or fragmented vacuoles, while the cab1∆ + CAB1WT and the cab1∆ + cab1 mutant + CAB1WT strains have typical vacuolar morphology. The representative images are from two independent experiments, each performed in duplicates. c Quantitative analysis of vacuolar area size (as a proportion of total cell area) as a function of CAB1 status; n = 100 cells per condition. Statistical significance was determined using t-test (p = 0.05) with GraphPad Prism and the corresponding p-values (***p < 0.001) are indicated. d Electron microscopy images of cab1∆ + CAB1WT and cab1∆+cab1G351S single cells confirm enlargement of vacuole induced by G351S mutation. The representative EM images are from three biological samples, with minimum of 100 cells analyzed per condition.
Fig. 3
Fig. 3. Yeast cab1∆ strains harboring various CAB1 mutations display defects in mitochondrial function.
a Solid growth assays reveal that mutations in CAB1 alter strains’ ability to utilize non-fermentable carbon sources. Solid growth assays using ten-fold serial dilutions plated onto YPD (glucose), YPL (lactate), YPG (glycerol), or YPE (ethanol) media and observed over 3-4 days. The representative images are from three independent experiments, each performed in duplicates. b, c Oxygen consumption rate (OCR) of yeast cells harboring CAB1 variants. OCR profile of cab1∆ strains using Seahorse 96X and Mito Stress kit. Dashed lines represent the injections of mitochondrial uncoupling drugs; oligomycin, FCCP, antimycin A, and rotenone. d, e Basal respiration and maximal respiration of cab1∆ strains (t-tests performed for each group comparing mutants to the wild type strain at p = 0.05). f cab1∆ strains exhibit mitochondrial structural defects. Immuno-fluorescence microscopy images of cab1∆ strains reveal aberrant mitochondria structures. The representative images are from two independent experiments, each performed in duplicates. g cab1∆ strains have increased levels of reactive oxygen species (ROS). ROS analysis was performed using dihydrorodamine 123. Each data plot represents the average of three biological samples with the corresponding standard deviation (±SD). (d, e, and g) Statistical significance was determined using t-test (p = 0.05) with GraphPad Prism and the corresponding p-values (***p < 0.001, **p < 0.01, *p < 0.05, and ns >0.05) are indicated.
Fig. 4
Fig. 4. Metabolic defects in yeast strains harboring cab1 mutations.
a PanK activities in the cab1∆ strains harboring various CAB1 mutations. Cell free extracts of yeast cab1 mutants were used to measure the endogenous PA utilization of cab1∆ + CAB1, cab1∆ + cab1G351S, cab1∆ + cab1G351S + CAB1, cab1∆ + cab1S158A, cab1∆ + cab1S158A + CAB1, and cab1∆ + cab1N290I, cab1∆ + cab1N290I + CAB1 strains using D-[1-14C] pantothenate as a substrate for 10 min at 30 °C. Each data plot represents the average of three biological samples with the corresponding standard deviation (±SD). b Cellular levels of CoA in cab1∆ strains. CoA levels were measured using metabolite extracts from the yeast strains mentioned above grown in the presence of 0.2 µM PA. Each data plot represents the average of three biological samples with the corresponding standard deviation (±SD). c Cysteine cellular levels of cab1∆ strains harboring various CAB1 mutations. Cellular cysteine levels were measured using the metabolite extracts from the yeast strain mentioned above grown in the presence of 0.2 µM PA. For these assays, t-test was done per each group compared to the parent CAB1 wild-type strain (p = 0.05). Each data plot represents the average of three biological samples with the corresponding standard deviation (±SD). d Schematic of the connection between the PCA pathway and the SUL/MET pathways. Transcription of the SUL/MET genes, responsible for synthesizing the crucial sulfur-containing amino acids methionine and cysteine, is mediated by the transcription factor Met4. This regulatory process is sensitive to changes in cellular cysteine levels. When cysteine levels increase, Met4 undergoes ubiquitination by the ubiquitin ligase Met30, leading to Met4’s inactivation and subsequent repression of the SUL/MET genes. e RNA-Seq analysis for cysteine and sulfur homeostasis expressed in cab1∆ strains. Expression values are TMM normalized and adjusted p-values (padj) were calculated using the Benjamini-Hochberg method. The data represent the average of three biological samples. The illustrated volcano plot depicts log2-fold change values for the mutants, cab1∆ + cab1G351S, cab1∆ + cab1N290I, and cab1∆ + cab1S158A in gray, cyan, and pink, respectively, against cab1∆ + CAB1 WT, plotted against the negative logarithm of the padj values. The gene list with annotations shown in Table S1.
Fig. 5
Fig. 5. Chemical inhibition of Acs2 and V-type ATPase increases susceptibility to a variety of AFDs.
a Schematic of the relevant portions of the PCA pathway. The vacuolar structure was created using BioRender (BioRender.com). b The growth of acs2 tet-off strain is inhibited by increasing concentrations of doxycycline. S. cerevisiae acs2 tet-off strain was inoculated in the presence or absence of doxycycline and normalized to DMSO-treated wells (no drug=100% growth) and 200 µM amorolfine (0% growth). c AR-12 potentiates caspofungin, fluconazole, and terbinafine by factors of ~100x against S. cerevisiae WT. d Concanamycin A increases yeast susceptibility to antifungal drugs. S. cerevisiae WT was inoculated in the presence or absence of concanamycin A at 30 °C for 48 h. The growth was normalized to DMSO-treated wells (no drug = 100% growth) and 200 µM amorolfine well (0% growth). Liquid growth assays were conducted in quadruplicate (n = 4) and the plotted graphs represent the average of 4 data sets ± SD.
Fig. 6
Fig. 6. PZ-2891 increases AFD susceptibility in S. cerevisiae, C. albicans and A. fumigatus.
a Solid growth assays showing increased S. cerevisiae and C. albicans susceptibility to amphotericin B when potentiated by PZ-2891. The representative images are from two independent experiments, each performed in duplicates. b Liquid growth assays showing increased C. albicans susceptibility to amphotericin B (125 ng/mL) and caspofungin (3.9 ng/mL) is potentiated by PZ-2891. The growth was normalized to DMSO-treated wells (no drug=100% growth) and 200 µM amorolfine well (0% growth). Liquid growth assays were conducted in quadruplicate (n = 4) and the plotted graphs represent the average of 4 data sets ± SD. c, d Average colony diameter rate and captures of solid media assay (up to 72 h of growth) with A. fumigatus cells under caspofungin treatment (20 μg/ml) in the presence or absence of PZ-2891 (50 μM). The data in Fig. 6c represent an average of 3 independent experiments ± SD. The representative images in (d) are from three independent experiments.
Fig. 7
Fig. 7. PZ-2891 inhibits acetyl CoA synthetase activity.
a Cellular CoA levels in S. cerevisiae following treatment with PZ-2891. CoA levels were measured using the metabolite extracts from the S cerevisiae cells grown in minimal glucose medium supplemented with 1 µM PA in the presence or absence of 50 µM PZ-2891. Each data plot represents the average of three biological samples with the corresponding standard deviation (±SD). Statistical significance was determined using t-test (p = 0.05) with GraphPad Prism and the corresponding p values (**p < 0.01) are indicated. b Yeast acetyl CoA synthetase activity is inhibited by PZ-2891. The in vitro activity of purified enzyme from S. cerevisiae was measured using a standard hydroxylamine-coupled assay, at 37 °C for 30 min, in the presence of various concentrations of AR-12 or PZ-2891. The activities in the presence of inhibitors are expressed as a percentage of activity compared to the 100% activity observed in the DMSO mock control. The data represents the average of three independent experiments (±SD). ce Binding prediction of PZ-2891 to ScAcs1p structure in silico and the inhibition kinetics. c The apo form of ScAcs1p structure (PDB:1RY2) was used for molecular docking with PZ-2891 using AutoDock Vina. ScAcs1p chain is represented in green cartoon, docked PZ-2891 is presented in cyan sticks, and the AMP solved bound to ScAcs1p (PDB:1RY2) is presented in black sticks. d Represents the binding of PZ-2891 in the AMP binding pocket of ScAcs1p. e Shows the configuration of PZ-2891 and AMP in the binding site of ScAcs1p (gray surface).
Fig. 8
Fig. 8. Model for PCA pathway-mediated regulation of vacuolar detoxification and susceptibility to antifungal drugs in fungi.
We propose that the pathway for biosynthesis of CoA and AcCOA (the PCA pathway) from pantothenate has major regulatory function in the control of organellar biogenesis in fungi. a The upper panel illustrates the cellular events associated with the functioning PCA pathway. AcCoA and ergosterol are produced through the normal PCA pathway, with ergosterol supporting normal vacuole and mitochondrial function. b The lower panel illustrates the dysfunctional PCA pathway, resulting in severe downstream effects on vacuolar function. Vacuolar homeostasis and xenobiotic detoxification heavily rely on the functionality of the PCA pathway in fungal strains. A reduction in ergosterol synthesis inhibits the function of vacuole and results in defects in cysteine sequestration and impairments in drug/heavy metal detoxification. These vacuolar function defects also contribute to increased ROS levels and mitochondrial abnormalities. The pivotal role of the PCA pathway in these downstream cellular events creates a unique vulnerability in yeast strains that can be targeted through the use of potentiators (PAMS) like PZ-2891, in addition to other modulators of PanK, Acs, and V-ATPase enzyme activities. The figure was created using BioRender (BioRender.com) and PowerPoint (Microsoft.com). PA pantothenic acid, PTZ pyrimidone triazol, αPanAM alpha-methyl-N-phenethyl-pantothenamide, CoA Co-enzyme A, ROS reactive oxygen species, PAMS potentiators of antimicrobial susceptibility.

References

    1. Lyman, M. et al. Worsening Spread of Candida auris in the United States, 2019 to 2021. Ann. Intern. Med. 10.7326/M22-3469 (2023). - PMC - PubMed
    1. Bosetti, D. & Neofytos, D. Invasive Aspergillosis and the impact of azole-resistance. Curr. Fungal Infect. Rep. 10.1007/s12281-023-00459-z (2023). - PMC - PubMed
    1. Perfect, J. R. et al. Editorial: Antifungal pipeline: build it strong; build it better! Front. Cell. Infect. Microbiol.12, 881272 (2022). 10.3389/fcimb.2022.881272 - DOI - PMC - PubMed
    1. Gow, N. A. R. et al. The importance of antimicrobial resistance in medical mycology. Nat. Commun.13, 5352 (2022). 10.1038/s41467-022-32249-5 - DOI - PMC - PubMed
    1. Lewis, R. E. Current concepts in antifungal pharmacology. Mayo Clin. Proc.86, 805–817 (2011). 10.4065/mcp.2011.0247 - DOI - PMC - PubMed

Publication types

MeSH terms

LinkOut - more resources