. 2024 Jul 23;14(1):16978.
doi: 10.1038/s41598-024-67860-7.

Methadone directly impairs central nervous system cells in vitro

Affiliations

Methadone directly impairs central nervous system cells in vitro

Cristian De Gregorio et al. Sci Rep. .

Abstract

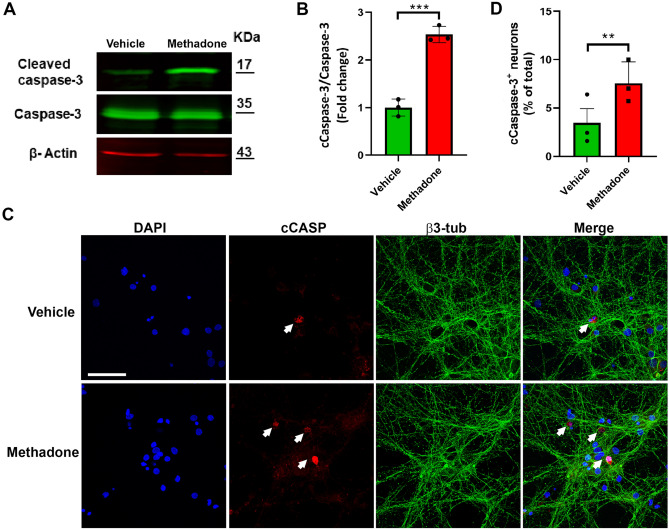
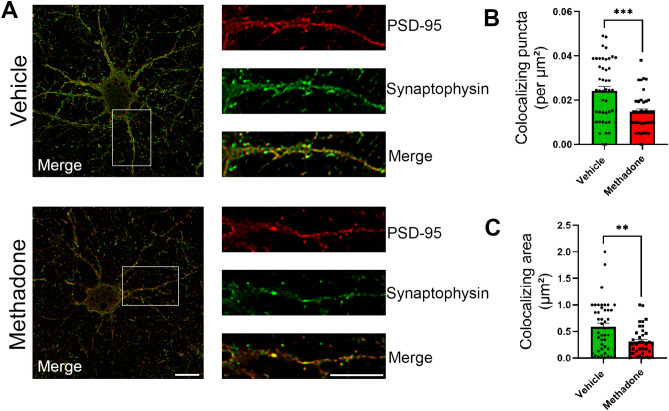
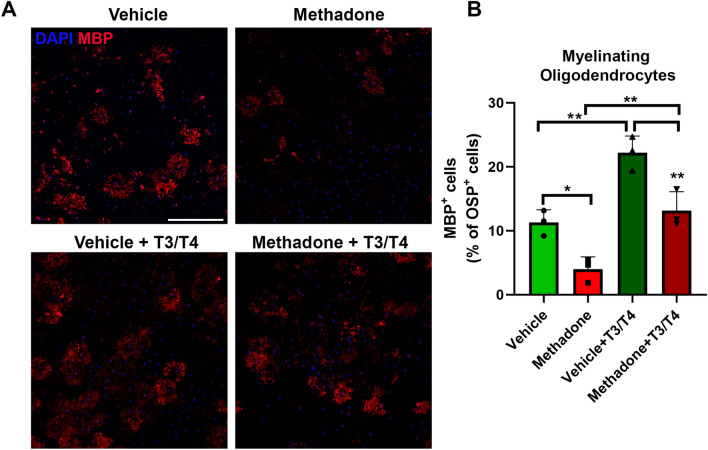
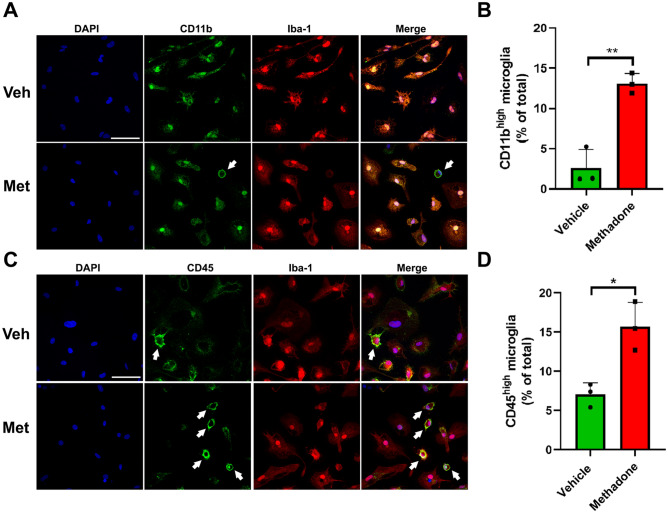
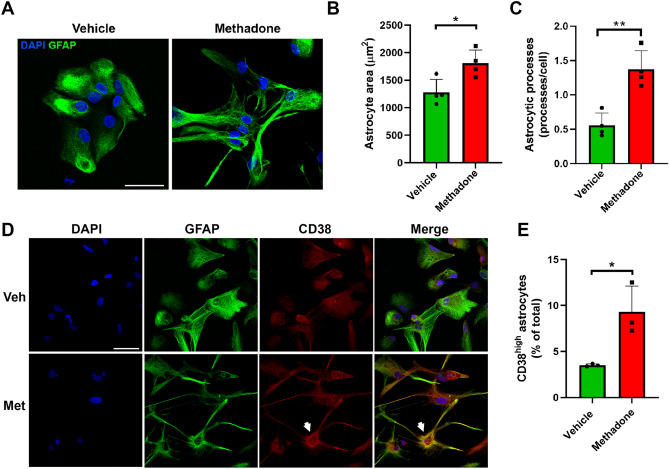
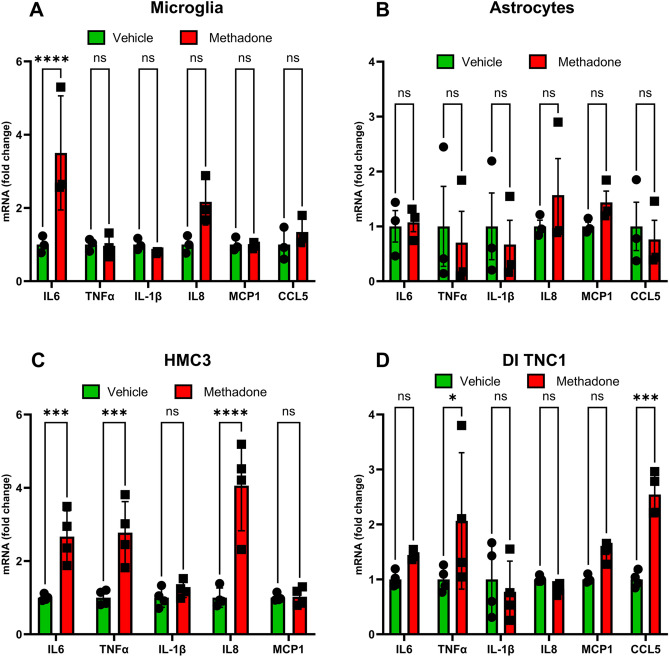
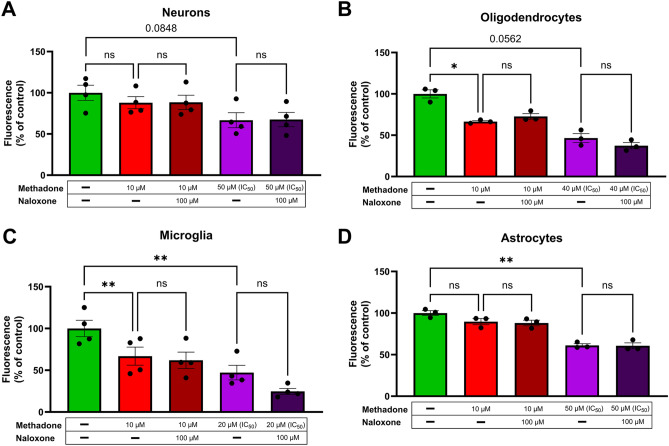
Methadone is a synthetic long-acting opioid that is increasingly used in the replacement therapy of opioid-addicted patients, including pregnant women. However, methadone therapy in this population poses challenges, as it induces cognitive and behavioral impairments in infants exposed to this opioid during prenatal development. In animal models, prenatal methadone exposure results in detrimental consequences to the central nervous system, such as: (i) increased neuronal apoptosis; (ii) disruption of oligodendrocyte maturation and increased apoptosis and (iii) increased microglia and astrocyte activation. However, it remains unclear whether these deleterious effects result from a direct effect of methadone on brain cells. Therefore, our goal was to uncover the impact of methadone on single brain cell types in vitro. Primary cultures of rat neurons, oligodendrocytes, microglia, and astrocytes were treated for three days with 10 µM methadone to emulate a chronic administration. Apoptotic neurons were identified by cleaved caspase-3 detection, and synaptic density was assessed by the juxtaposition of presynaptic and postsynaptic markers. Apoptosis of oligodendrocyte precursors was determined by cleaved caspase-3 detection. Oligodendrocyte myelination was assessed by immunofluorescence, while microglia and astrocyte proinflammatory activation were assessed by both immunofluorescence and RT-qPCR. Methadone treatment increased neuronal apoptosis and reduced synaptic density. Furthermore, it led to increased oligodendrocyte apoptosis and a reduction in the myelinating capacity of these cells, and promoted the proinflammatory activation of microglia and astrocytes. We showed that methadone, the most widely used drug in opioid replacement therapy for pregnant women with opioid addiction, directly impairs brain cells in vitro, highlighting the need for developing alternative therapies to address opioid addiction in this population.

Keywords: Brain damage; Methadone; Neurodegeneration; Neuroinflammation; Opioid addiction; Opioid substitution therapy.


Conflict of interest statement

The authors declare no competing interests.

Figures

Figure 1
Figure 1
Methadone-induced IC50 in highly purified cortex-derived primary cells cultures. Different cell type cultures from the CNS were subjected to increasing methadone concentration (ranging from 0.3 to 300 µM) for three days, and cell viability was assessed using CellTiter-Blue analysis. Fluorescence plots illustrate the dose–response impact of methadone on cell viability in neurons (A), oligodendrocytes (B), astrocytes (C), and microglia (D) cultures. The IC50 values for each cell type were determined adjusting the data to a non-linear equation of methadone concentration vs. normalized response. Plots display the mean fluorescence ± SEM. Assays were conducted with 3 different biological replicates with 6 technical replicates each.
Figure 2
Figure 2
Chronic methadone treatment induces apoptosis of primary neurons. Six-day-old primary neuronal cultures were treated for three days with either 10 μM methadone or vehicle. (A) Representative Western Blot analysis showing an increased abundance of cCaspase-3 in methadone-treated neurons, with total caspase-3 and β-actin as housekeeping proteins. (B) Densitometric analysis from Western Blot in (A) expressed as fold change. Data are presented as MEAN ± SEM of three independent cultures. ***p < 0.001 Student’s T-test. (C) Representative confocal microscopy images confirm co-expression of cCaspase-3 (red) with the neuronal marker βIII-tubulin (green). Nuclei were counterstained with DAPI (blue). Scale bar = 50 µm. White arrows indicate cCaspase-3+/βIII-tubulin+ cells. (D) Quantification of double-positive cells (cCaspase-3+, βIII-tubulin+) for the images depicted in (C). Data are presented as mean ± SEM of three independent cultures. In total, ~ 1200 neurons were quantified for each condition. **p < 0.01 Student’s T-test.
Figure 3
Figure 3
Chronic methadone treatment reduces synaptic density in mature primary neurons. Thirteen-day-old primary neuronal cultures were treated for three days with either 10 μM methadone or vehicle. (A) Representative confocal slices depict synaptic structures, revealed by the juxtaposition of a presynaptic marker puncta (synaptophysin, green) and a postsynaptic marker puncta (PSD-95, red). Scale bar = 10 μm. (B) Quantification of colocalizing puncta and (C) quantification of colocalizing area for the images depicted in (A). For each experimental condition, 37–48 dendritic fields were analyzed from 10 to 15 neurons. Data are presented as mean ± SEM of three independent cultures.**p < 0.01; ***p < 0.001 Mann–Whitney test.
Figure 4
Figure 4
Chronic methadone treatment induces apoptosis of primary oligodendrocyte cells. Four-day-old primary oligodendrocyte cultures were treated for three days with either 10 μM methadone or vehicle. (A) Representative confocal microscopy images showing apoptotic oligodendrocytes, indicated by cCaspase-3 immunoreactivity (red). Differentiated oligodendrocytes were detected using the O4 antibody (green). Nuclei were counterstained with DAPI (blue). Scale bar = 50 µm. White arrows indicate cCasp-3+ O4+ cells. (B) Quantification of the cCaspase-3 population, expressed as a percentage of the total oligodendrocyte population (O4+ cells). Data are presented as mean ± SEM of three independent cultures. In total, ~ 1000 oligodendrocytes were quantified for each condition. **p < 0.01 Student’s T-test.
Figure 5
Figure 5
Chronic methadone treatment reduces the oligodendrocyte myelinating population. Four-day-old primary oligodendrocyte cultures were treated for three days with 10 μM methadone or vehicle in the presence or absence of the thyroid hormones T3 and T4 to promote myelination. (A) Representative confocal microscopy images showing the myelinating population, visualized through the Myelin Basic Protein marker (MBP, red). Nuclei were counterstained with DAPI (blue). Scale bar = 200 µm. (B) Quantification of the MBP+ population, expressed as a percentage of the total oligodendrocyte population (OSP+ cells, see Supplementary Fig. 4). Data are presented as mean ± SEM of three independent cultures. In total, ~ 2000 oligodendrocytes were quantified for each condition. *p < 0.05; **p < 0.01 determined by a one-way ANOVA followed by Tukey post-hoc test.
Figure 6
Figure 6
Chronic methadone treatment induces microglial activation. One-day-old primary microglia cultures were treated for three days with either 10 μM methadone or vehicle. (A, C) Representative confocal microscopy images illustrating microglial activation, evidenced by changes in cellular morphology and the expression of the activation-associated markers CD11b (green, A) and CD45 (green, C). Microglial cells were detected using an anti-Iba-1 antibody (red). Nuclei were counterstained with DAPI (blue). Scale bar = 50 µm. Arrows indicate the presence of microglia expressing high levels of the activation-associated markers and exhibiting an amoeboid morphology. (B, D) Quantification of activated microglia based on increased levels of the activation-associated markers (CD11bhigh) (B) and CD45high (D), combined with an amoeboid cell morphology. Data are presented as mean ± SEM of three independent cultures. In total, ~ 500 microglia were quantified for each condition. *p < 0.05; **p < 0.01 Student’s T-test.
Figure 7
Figure 7
Chronic methadone treatment induces astrocyte activation. One-day-old primary astrocyte cultures were treated for three days with either 10 μM methadone or vehicle. (A) Representative confocal microscopy images showing astrocyte activation, evidenced by changes in cellular morphology visualized through the Glial Fibrillary Acidic Protein marker (GFAP, green). Nuclei were counterstained with DAPI (blue). Scale bar = 50 µm. (BC) Quantification of the astrocyte area (B) and the mean number of astrocytic processes per cell (C). (D) Representative confocal microscopy images showing astrocyte activation evidenced by the expression of the activation-associated marker CD38 (red) in GFAP + cells (green). (E) Quantification of activated astrocytes based on increased levels of activation-associated marker (CD38high), combined with a stellate GFAP+ cell morphology. Data are presented as mean ± SEM of three independent cultures. In total, ~ 300 astrocytes were quantified for each condition. *p < 0.05; **p < 0.01 Student’s T-test.
Figure 8
Figure 8
Chronic methadone treatment induces proinflammatory mRNA expression in cultured microglia and astrocytes. Primary microglia cultures, primary astrocyte cultures, HMC3 microglia cell line, and DI TNC1 astrocyte cell line were treated for three days with either 10 μM methadone or vehicle. Comparison of mRNA levels of proinflammatory cytokines in methadone-treated primary microglia (A), methadone-treated primary astrocytes (B), methadone-treated HMC3 microglia cell line (C), and methadone-treated DI TNC1 astrocyte cell line (D), compared to vehicle-treated controls. The expression levels of each target gene was normalized to the expression level of GAPDH in the same sample and expressed as fold change relative to the vehicle-treated controls. Data are presented as mean ± SEM of three (primary cells) to four (cell lines) independent cultures. *p < 0.05; **p < 0.01, ***p < 0.001 ****p < 0.0001 Two-way ANOVA with Šídák's multiple comparisons test.
Figure 9
Figure 9
Naloxone co-treatment with methadone does not alter methadone-induced viability reduction in primary neuron, oligodendrocyte, astrocytes, or microglia cultures. Primary neuron (A), oligodendrocyte (B), microglia (C), or astrocyte (D) cultures were co-treated with to 10 µM or their corresponding IC50 methadone concentrations and 100 µM naloxone or vehicle, for three days. Cell viability was assessed using CellTiter-Blue analysis. Plots display the mean fluorescence normalized to vehicle-treated controls. Data are presented as mean ± SEM of 3–4 different biological replicates with 3 technical replicates each. *p < 0.05; **p < 0.01 One-way ANOVA with Tukey’s multiple comparisons test.

Similar articles

Cited by

References

    1. Kosten, T. R. & George, T. P. The neurobiology of opioid dependence: Implications for treatment. Sci. Pract. Perspect.1, 13–20. 10.1151/spp021113 (2002). 10.1151/spp021113 - DOI - PMC - PubMed
    1. World Drug Report United Nations. https://www.unodc.org/unodc/data-and-646analysis/worlddrug-report-2022.html (2022).
    1. Theisen, K. & Davies, B. J. The American opioid crisis: The inexorable march to death and addiction. Eur. Urol.75, 219–220. 10.1016/j.eururo.2018.10.051 (2019). 10.1016/j.eururo.2018.10.051 - DOI - PubMed
    1. European Monitoring Centre for Drugs and Drug Addiction. https://www.emcdda.europa.eu/index_en2022 (2022).
    1. St Marie, B., Coleman, L., Vignato, J. A., Arndt, S. & Segre, L. S. Use and misuse of opioid pain medications by pregnant and nonpregnant women. Pain Manag. Nurs.21, 90–93. 10.1016/j.pmn.2019.05.002 (2020). 10.1016/j.pmn.2019.05.002 - DOI - PMC - PubMed

LinkOut - more resources