. 2025 Feb;21(2):215-226.
doi: 10.1038/s41589-024-01681-7. Epub 2024 Jul 23.

Unlocking saponin biosynthesis in soapwort

Affiliations

Unlocking saponin biosynthesis in soapwort

Seohyun Jo et al. Nat Chem Biol. 2025 Feb.

Abstract

Soapwort (Saponaria officinalis) is a flowering plant from the Caryophyllaceae family with a long history of human use as a traditional source of soap. Its detergent properties are because of the production of polar compounds (saponins), of which the oleanane-based triterpenoid saponins, saponariosides A and B, are the major components. Soapwort saponins have anticancer properties and are also of interest as endosomal escape enhancers for targeted tumor therapies. Intriguingly, these saponins share common structural features with the vaccine adjuvant QS-21 and, thus, represent a potential alternative supply of saponin adjuvant precursors. Here, we sequence the S. officinalis genome and, through genome mining and combinatorial expression, identify 14 enzymes that complete the biosynthetic pathway to saponarioside B. These enzymes include a noncanonical cytosolic GH1 (glycoside hydrolase family 1) transglycosidase required for the addition of D-quinovose. Our results open avenues for accessing and engineering natural and new-to-nature pharmaceuticals, drug delivery agents and potential immunostimulants.


Conflict of interest statement

Competing interests: S.J. and A.O. are inventors of a patent arising from this work (WO2024/003012, published), which relates to the biosynthesis of complex triterpenoid saponins and intermediates using the identified saponarioside pathway genes reported here. The other authors declare no competing interests.

Figures
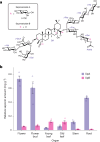
Fig. 1
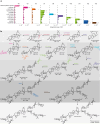
Fig. 1. Major saponins found in S. officinalis: SpA and SpB.
a, Structures of SpA and SpB, both consisting of a QA aglycone with a branched trisaccharide at C-3 (composed of d-glucuronic acid, d-galactose and d-xylose) and a linear tetrasaccharide at C-28 (composed of d-fucose, l-rhamnose, d-xylose and d-xylose) with an acetylquinovose moiety attached to d-fucose. In SpA, an additional d-xylose is attached to d-quinovose. b, Relative abundance of SpA (purple) and SpB (pink). Compounds were identified using authentic standards. Relative abundance was calculated using the internal standard digitoxin, based on dry weight. Each bar represents the mean of four biological replicates and error bars indicate the s.e.m. Source data
Fig. 2
Fig. 2. Characterization of SobAS1.
a, Phylogenetic analysis of candidate S. officinalis OSCs. The maximum-likelihood tree was generated using an amino acid alignment of putative OSCs in S. officinalis and previously characterized OSCs from other plant species (listed in Supplementary Table 6). Bootstrap values less than 80% are shown beside each node. The scale bar indicates the number of amino acid substitutions per site. Common enzyme products produced by each clade are labeled on the right. SobAS1, characterized in this work as a β-amyrin (1) synthase is highlighted in purple. The three other S. officinalis OSCs identified in this study are shown in bold. b, Transient expression of SobAS1 in N. benthamiana leaves. GC–MS total ion chromatograms (TICs) of leaf extracts coexpressing AstHMGR and SobAS1, along with a control (leaf expressing only AstHMGR) and a commercial standard of β-amyrin (1), are shown. Mass spectra for leaf extracts expressing SobAS1 and commercial β-amyrin standard are also given. c, Activity of SobAS1 in converting 2,3-oxidosqualene to β-amyrin (1).
Fig. 3
Fig. 3. Biosynthesis of QA.
a, Four S. officinalis enzymes enable biosynthesis of QA (4) in N. benthamiana. b, Products generated by transient expression of CYP716A378 (C-28 oxidase) and CYP716A379 (C-28,16α oxidase) in N. benthamiana. GC–MS TICs of leaf extracts coexpressing SobAS1 with either CYP716A378 or CYP716A379 are shown, along with a control (leaf expressing only AstHMGR) and the following commercial standards: bA (1, β-amyrin), OA (2, oleanolic acid) and EA (3, echinocystic acid). Mass spectra of bA (1), OA (2) and EA (3) for leaf extracts expressing SobAS1 with either CYP716A378 or CYP716A379 and for relevant commercial standards are also shown. c, Transient expression of CYP72A984 (C-23 oxidase) in N. benthamiana. LC–MS extracted ion chromatograms (EICs) of leaf extracts coexpressing CYP72A984 with the minimal gene set for 3 (SobAS1 and CYP716A379), along with a control (leaf expressing only AstHMGR) and a QA (4) commercial standard. EICs displayed are at m/z 485.3267 (calculated [M − H] of QA (4)). MS and MS/MS spectra of QA (4) from the commercial standard and leaf extracts coexpressing SobAS1, CYP716A379 and CYP72A984 are also shown. Formation of another peak (4′) putatively identified as gypsogenic acid is also observed when CYP72A984 is coexpressed with SobAS1 and CYP716A379 (MS/MS shown in Supplementary Fig. 25).
Fig. 4
Fig. 4. Complete biosynthetic pathway to SpB (13).
a, Integrated peak areas of EICs for each intermediate accumulating after sequential coexpression of pathway genes in N. benthamiana, starting with QA (4). Each bar represents the mean of six biological replicates and error bars indicate the s.e.m. QA (4) biosynthetic genes include SobAS1, CYP716A379 and CYP72A984. Data for full characterization of each enzyme are available in the Supplementary Information. b, Schematic showing the complete elucidated pathway from 2,3-oxidosqualene to SpB (13). The arrows represent the accumulation of metabolite products after each addition of associated enzyme rather than specifying a biosynthetic order in planta. Superscript circles () indicate structures that are supported by NMR analysis of the purified compound (reported here or in a previous study) or by comparison with an authentic standard. MW, molecular weight. Source data
Fig. 5
Fig. 5. Localization of SoGH1 to the cytosol and nucleus.
a, Phylogenetic analysis of GH1 enzymes from S. officinalis and other plant species belonging to the At/Os6 group of the GH1 family. The maximum-likelihood tree (Methods) was generated using an amino acid alignment of putative and characterized (bold) plant GH1 TGs. Bootstrap values less than 80% are shown beside each node. The scale bar indicates the number of amino acid substitutions per site. SFR2 (sensitive to freezing 2)-like enzymes, another subgroup of GH1 family, are used as an outgroup. The side bar to the right shows the SignalP score for each sequence. b, Amino acid sequence alignment (generated using ESPript 3.0) of the N-terminal regions of all characterized plant GH1 enzymes. Predicted signal peptides are highlighted in green. c, Confocal microscopy images of N. benthamiana leaves transiently coexpressing SoGH1 tagged with C-terminal mRFP (SoGH1:mRFP) and free GFP, both individually and merged. Images were taken 2 days after infiltration. Scale bar, 20 μm. This experiment was performed independently three times with similar results. d, Transient expression of SoGH1:mRFP in N. benthamiana. LC–MS EICs of leaf extracts coexpressing the minimal gene set for 11 with either untagged or mRFP-tagged SoGH1, along with a control leaf expressing only AstHMGR and an authentic QA-TriF(Q)RXX (12) standard, are shown. EICs displayed are m/z 1,657.7115 (calculated [M − H] of 12). MS/MS spectra for the leaf extracts and the authentic (12) standard are shown at the bottom. The additional peak (12′) is putatively identified as a positional isomer of 12 (Supplementary Fig. 38c). Source data
Fig. 6
Fig. 6. Silencing of SobAS1 in S. officinalis hairy roots.
a,b, Photographs showing hairy root induction from leaves of S. officinalis plantlets (a) and 4-week-old hairy roots maintained in liquid medium (b). c,d, Images of transformed hairy roots expressing DsRed fluorescence: empty vector (EV) control (c) and representative SobAS1-RNAi (RNA interference) line (d; left, monochromatic light; right, red fluorescence). Scale bars, 1,000 μm. This experiment was performed independently three times with similar results. e, LC–MS analysis of S. officinalis hairy root extracts from SobAS1-RNAi lines (Sil-L1, Sil-L2 and Sil-L3) and EV control. The bar graphs show the relative amounts of QA (4) and SpB (13) in the different lines. Compounds were identified by comparison with commercial or authentic standards. Relative abundance was calculated using the internal standard digitoxin. Each bar represents the mean of three biological samples and error bars indicate the s.e.m. A two-sided Student’s t-test was used to analyze significance (exact P values are shown). The expression levels of SobAS1 in SobAS1-RNAi lines are shown in Supplementary Fig. 75. Source data
Extended Data Fig. 1
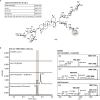
Extended Data Fig. 1. Detection of saponarioside A in extracts of different soapwort organs.
The plant extracts were analyzed using HPLC-MS in negative ionization mode. a. Structure of saponarioside A with a table showing relevant calculated adducts and fragments. b. EIC displayed for m/z 1831.7649 (calculated [M-H]- of SpA) and MS/MS spectra of the highlighted peak in corresponding plant samples are shown.
Extended Data Fig. 2
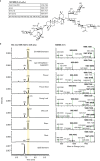
Extended Data Fig. 2. Detection of saponarioside B in extracts of different soapwort organ.
The plant extracts were analyzed using HPLC-MS in negative ionization mode. a. Structure of saponarioside B with a table showing relevant calculated adducts and fragments. b. EIC displayed for m/z 1699.7227 (calculated [M-H]- of SpB) and MS/MS spectra of the highlighted peak in corresponding plant samples are shown.
Extended Data Fig. 3
Extended Data Fig. 3. Riparian plot of the newly generated S. officinalis genome with genomes of other Caryophyllales species.
The chromosomes are drawn to scale (scale bar represents 200 Mbp).
Extended Data Fig. 4
Extended Data Fig. 4. Expression profiles of shortlisted candidate genes.
Candidates were filtered by PCC (>0.885) to SobAS1, annotation with one of InterPro domains of biosynthetic interest (IPR001128 cytochrome P450; IPR002213 UDP-dependent glycosyltransferase; IPR003480 and IPR001563 acyltransferases) and absolute read count (>1000) in the flower. SoSDR1 and SoGH1 has also been included. The heatmap shows library normalized log2 read counts scaled by row (gene) and was constructed using Heatmap3. Gene ID, annotation, PCC to SobAS1 and absolute read count in flower organ (mean, n = 4) are also listed for each candidate. Genes shown in bold are functional saponarioside biosynthetic genes identified and characterized in this study. Full expression data are available as Source Data. Source data
Extended Data Fig. 5
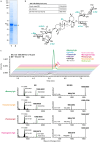
Extended Data Fig. 5. Sugar-donor specificity of SoGH1.
a. Purified recombinant SoGH1. SoGH1 was expressed with C-terminal His-tag in N. benthamiana by Agrobacterium-mediated transient expression. Lane 1, cleared lysate before purification. Lane 2, purified fraction by TALON metal affinity purification. RbcL, Rubisco large subunit which is highly abundant in plant leaf soluble extracts. The unprocessed gel image is available as Source Data. b. Structure of surrogate saponin acceptor, 3-O-{α-l-rhamnopyranosyl-(1 → 2)-[β-d-galactopyranosyl-(1 → 2)]-β-d-glucopyranosiduronic acid}-28-O-{β-d-xylopyranosyl-(1 → 4)-α-l-rhamnopyranosyl-(1 → 2)-β-d-fucopyranosyl ester}-quillaic acid (QA-TriR-FRX) used. A table with relevant calculated adducts and modifications is also shown. c. Enzyme assay of purified SoGH1 incubated with QA-TriR-FRX and various sugar donors analyzed using HPLC-MS. Extracted ion chromatograms (EIC) and MS/MS spectrum are shown. EIC displayed are for m/z 1555.6810, the calculated mass of [M-H]- adduct of QA-TriR-FRX plus hexose. SoGH1 incubated only with QA-TriR-FRX without any sugar donors is used as a negative control (-no donor). A noticeable product peak is observed when benzoyl-glc is given as the sugar donor, but less prominent product peaks are also observed with coumaroyl-glc, feruloyl-glc and naringenin-7glc as sugar donors. MS/MS fragmentation pattern of the product peaks suggests an addition of hexose (d-glucose) to the C-28 sugar chain, which then fragments to m/z 969.4703, corresponding to the expected [M-H]- of QA-TriR-FRX without the C-28 sugar chain. This experiment was repeated independently three times with similar results. UDP-glc, UDP-β-d-glucose; 4NP-glc, 4-nitrophenyl-β-d-glucoside; Phenyl-glc, phenyl-β-d-glucoside; arbutin, hydroquinone-β-d-glucoside; benzoyl-glc, benzoyl-β-d-glucoside; galloyl-glc, 1-O-galloyl-β-d-glucoside; coumaroyl-glc, 1-O-coumaroyl-β-d-glucoside; feruloyl-glc, 1-O-feruloyl-β-d-glucoside; naringenin-7glc, naringenin-7-O-β-d-glucoside; quercetin-3glc, quercetin-3-O-β-d-glucoside. Source data
Extended Data Fig. 6
Extended Data Fig. 6. Characterization of SoBAHD1.
a. Structure of saponarioside B (13), a product of SoBAHD1 when acting in combination with the S. officinalis enzymes required to produce 12. Modification performed by SoBAHD1 has been highlighted and a table showing relevant calculated adducts and fragments of 13 included. b. N. benthamiana leaves transiently co-expressing various genes were extracted and analysed using HPLC-MS, representative (n = 6) extracted ion chromatograms (EIC) and MS/MS spectra are shown. EIC displayed are for m/z 1699.7206, the calculated mass of the [M-H]- adduct of 13. The negative controls used were extracts from N. benthamiana leaves co-expressing only AstHMGR (tHMGR control) or co-expressing the S. officinalis genes required to produce 12 (tHMGR, SobAS1, CYP716A379, CYP72A984, SoCSL1, UGT73DL1, UGT73CC6, UGT74CD1, SoSDR1, UGT79T1, UGT79L3, UGT73M2 and SoGH1) (QA-TriF(Q)RXX). The additional activity of SoBAHD1 produced two product peaks (13 and 13′) which are identified as SpB and SO1699 (see Extended Data Fig. 7) by comparison to authentic standards.
Extended Data Fig. 7
Extended Data Fig. 7. Identification of SO1699 in N. benthamian a leaf extracts transiently expressing S. officinalis genes and in extracts of different soapwort organs.
a. Structure of 3-O-{β-d-xylopyranosyl-(1 → 3)-[β-d-galactopyranosyl-(1 → 2)]-β-d-glucopyranosiduronic acid}-28-O-{β-d-xylopyranosyl-(1 → 4)-α-l-rhamnopyranosyl-(1 → 2)-[β-d-xylopyranosyl-(1 → 3)-β-d-4-O-acetylquinovopyranosyl-(1 → 4)]-β-d-fucopyranosyl ester}-quillaic acid (SO1699, 13′). A table showing relevant calculated adducts and fragments of 13′ is also shown. b. EIC at m/z 1699.7227 from various samples and respective MS/MS spectra are shown. Peak (13’) of same mass, RT, and MS/MS fragmentation pattern is present in N. benthamiana leaves samples transiently co-expressing S. officinalis genes required produce QA-TriF(Q)RXX (tHMGR, SobAS1, CYP716A379, CYP72A984, SoCSL1, UGT73DL1, UGT73CC6, UGT74CD1, SoSDR1, UGT79T1, UGT79L3, UGT73M2, SoGH1) and SoBAHD1, and as well as all soapwort samples analysed. This peak (13′) has different RT compared to SpB (13) standard and was identified as SO1699 based on comparison with authentic standard.
Extended Data Fig. 8
Extended Data Fig. 8. Possible route to quinovoside formation in S. officinalis.
Formation of d-quinovose in situ. UDP-4-keto-6-deoxy-d-glucose exists as an intermediate UDP-l-rhamnose biosynthesis from UDP-d-glucose. UDP-4-keto-6-deoxy-d-glucose could serve as a sugar donor for formation of acyl-4-keto-6-deoxy-d-glucose, which may be the direct sugar donor for SoGH1. The 4-keto group may then be reduced following attachment to the saponin, to form the final d-quinovose in QA-TriF(Q)RXX (11). Alternatively, the 4-keto group may be reduced to form acyl-d-quinovose by an unknown 4-ketoreductase which then serves as the sugar donor for SoGH1. Note that the acyl donor component is depicted as benzoic acid for illustrative purposes, but this could be substituted for another suitable acyl group. 4K6DG, 4-keto-6-deoxy-d-glucose.

References

    1. Rogers, R. N. & Arnoldi, A. The Shroud of Turin: an amino-carbonyl reaction (Maillard reaction) may explain the image formation. Melanoidins4, 106–113 (2003).
    1. Johnson, L. A Manual of the Medical Botany of North America (William Wood & Company, 1884).
    1. Jia, Z. H., Koike, K. & Nikaido, T. Major triterpenoid saponins from Saponaria officinalis. J. Nat. Prod.61, 1368–1373 (1998). - PubMed
    1. Jia, Z., Koike, K. & Nikaido, T. Saponarioside C, the first α-d-galactose containing triterpenoid saponin, and five related compounds from Saponaria officinalis. J. Nat. Prod.62, 449–453 (1999). - PubMed
    1. Koike, K., Jia, Z. H. & Nikaido, T. New triterpenoid saponins and sapogenins from Saponaria officinalis. J. Nat. Prod.62, 1655–1659 (1999). - PubMed

Publication types