. 2024 Sep;38(9):2003-2015.
doi: 10.1038/s41375-024-02357-w. Epub 2024 Jul 23.

In vivo CRISPR/Cas9-mediated screen reveals a critical function of TFDP1 and E2F4 transcription factors in hematopoiesis

Affiliations

In vivo CRISPR/Cas9-mediated screen reveals a critical function of TFDP1 and E2F4 transcription factors in hematopoiesis

Ngoc Tung Tran et al. Leukemia. 2024 Sep.

Abstract

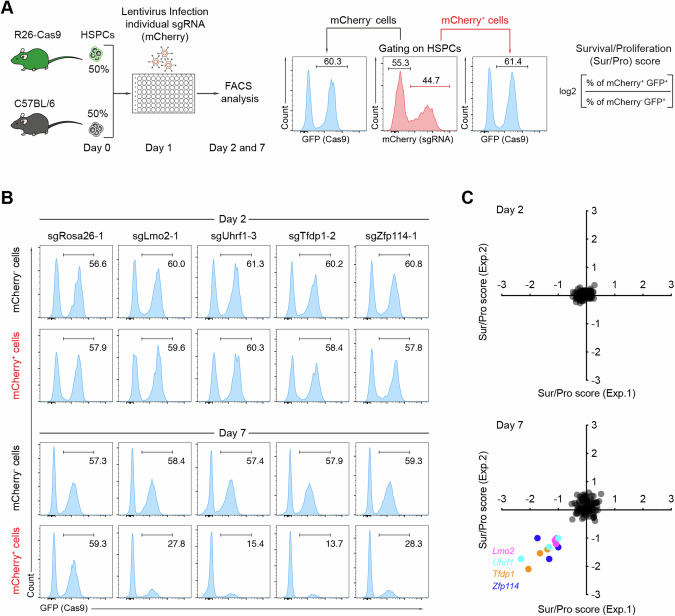
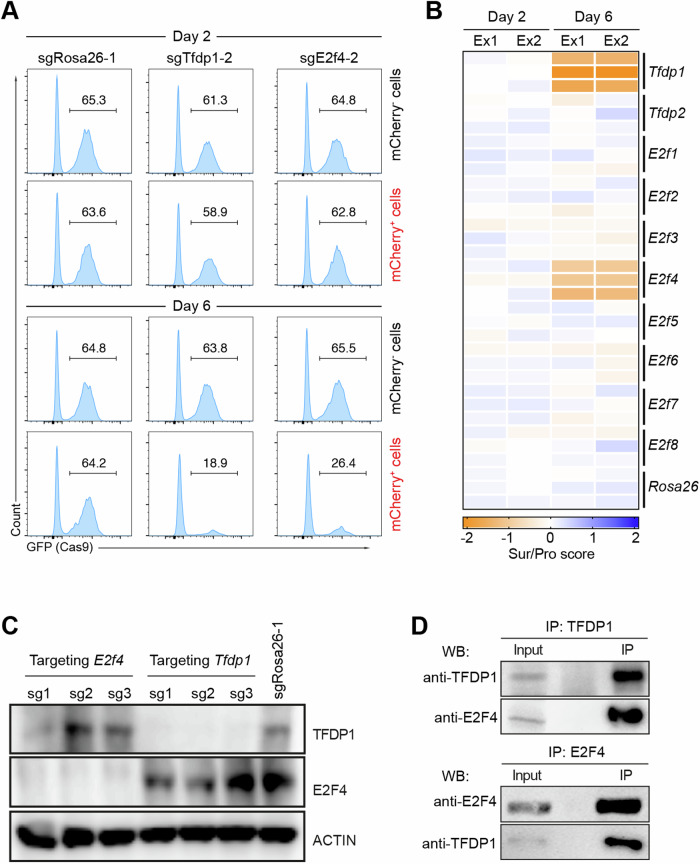
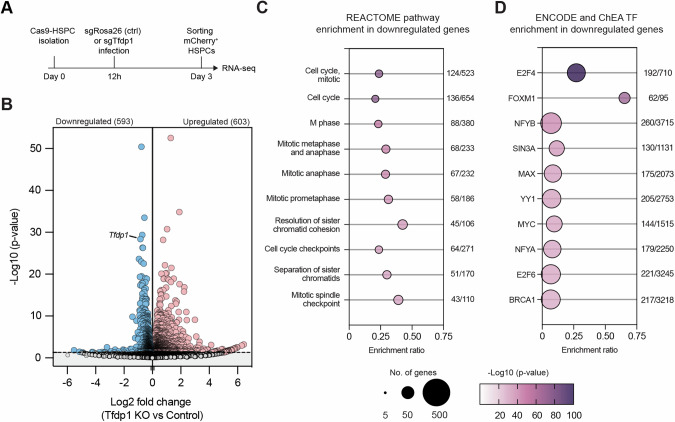
Hematopoiesis is a continuous process of blood cell production driven by hematopoietic stem and progenitor cells (HSPCs) in the bone marrow. Proliferation and differentiation of HSPCs are regulated by complex transcriptional networks. In order to identify transcription factors with key roles in HSPC-mediated hematopoietic reconstitution, we developed an efficient and robust CRISPR/Cas9-based in vivo genetic screen. Using this experimental system, we identified the TFDP1 transcription factor to be essential for HSPC proliferation and post-transplant hematopoiesis. We further discovered that E2F4, an E2F transcription factor, serves as a binding partner of TFDP1 and is required for HSPC proliferation. Deletion of TFDP1 caused downregulation of genes associated with the cell cycle, with around 50% of these genes being identified as direct targets of TFDP1 and E2F4. Thus, our study expands the transcriptional network governing hematopoietic development through an in vivo CRISPR/Cas9-based genetic screen and identifies TFDP1/E2F4 as positive regulators of cell cycle genes in HSPCs.


Conflict of interest statement

The authors declare no competing interests.

Figures

Fig. 1
Fig. 1. In vitro CRISPR/Cas9-based screen to identify determinants for HSPC expansion.
A Scheme of CRISPR/Cas9-based screen in mouse HSPCs. Cas9-expressing HSPCs were isolated from R26-Cas9iGFP mice, mixed with C57BL/6 (WT) HSPCs at a ratio of 1:1, and activated for one day. The activated HSPCs were infected with lentiviral particles expressing specific sgRNA in 96-well plates. These cells were cultured and analyzed on day two and seven after infection by flow cytometry. The survival/proliferation (sur/pro) score of the pre-gated HSPCs was defined as indicated. B Representative FACS analysis of the frequency of GFP+ (Cas9+) cells within mCherry+ (sgRNA+) or mCherry- (sgRNA-) HSPCs two (top) and seven days (bottom) post transduction. In each column, the indicated sgRNA was used. C Correlation of survival/proliferation scores of two independent experiments at the indicated time points (n = 2 biological replicates). Genes with a survival/proliferation score <−1 are highlighted.
Fig. 2
Fig. 2. In vivo CRISPR/Cas9-mediated screen to identify regulators of hematopoiesis.
A Scheme of in vivo CRISPR/Cas9-mediated screen. GFP+/GFP- HSPCs were infected with individual sgRNA-expressing lentiviral particles in 96-well plates, pooled, and transplanted to immunodeficient mice (n = 3, technical replicates). Eight weeks post transplantation, the sgRNA abundance in HSPC, Gr-1+, T, and B cells was analyzed by deep sequencing and used to define a fold change (log2) of GFP+ versus GFP-. B FACS analysis of total mCherry+ cells (sgRNA+) in the input HSPCs and in cells isolated from the bone marrow and spleens of recipient mice from two independent experiments (n = 2, biological replicates). C Summary of the data in (B). D Frequencies of GFP+ (Cas9) versus GFP- (WT) cells in input and analyzed immune cell subsets from the bone marrow (BM), spleen, and peritoneal cavity (PerC) of the transplanted animals. E Correlation graphs of the sgRNA abundance fold changes (log2) from two independent experiments in the indicated immune subsets. Genes having an impact on the depletion of the respective cell subset are highlighted.
Fig. 3
Fig. 3. In vitro CRISPR/Cas9-mediated screen to identify E2F members important for HSPC expansion.
A FACS analysis of the percentage of GFP+ (Cas9+) cells within the mCherry+ (sgRNA+) and mCherry- (sgRNA-) HSPCs on day two (top) and six (bottom) post transduction. B Heatmap of survival/proliferation scores in HSPCs treated with the indicated sgRNAs (n = 2, biological replicates). The color indicates decreased (orange) and increased (blue) survival/proliferation scores. C Western blot of TFDP1 and E2F4 three days post targeting with sgRNAs against Tfdp1 and E2f4. SgRosa26-1 was used as a negative control. Actin was used as a loading control. D Co-immunoprecipitation (Co-IP) using TFDP1 (top) and E2F4 as precipitating antibody (bottom) (n = 2, biological replicates).
Fig. 4
Fig. 4. Functional validation of Tfdp1 and E2f4 in hematopoiesis in vivo.
A Scheme of in vivo functional validation in hematopoiesis. B Representative FACS analysis of mCherry+GFP+ (KO) and mCherry+GFP- (WT) donor cells in the bone marrow (BM) and spleen of the recipients transplanted with the indicated sgRNA-treated HSPCs. C Summary of the GFP+/GFP- ratios within mCherry+ cells in the bone marrow (BM) and spleen of recipient animals as shown in (B) (n = 3–6, technical replicates). D FACS gating strategy (left) and GFP analysis (right) in the indicated stem and progenitor cell populations: HSPC, common lymphoid progenitor (CLP), granulocyte/myeloid progenitor (GMP), common myeloid progenitor (CMP), megakaryocyte/erythroid progenitor (MEP). The used sgRNAs are indicated at the top. E Summary of the GFP+/GFP- ratios calculated in (D) from different mice transplanted with sgTfdp1-infected (top) and sgE2f4-infected (bottom) HSPCs. SgRosa26 was used as a control in all experiments. F GFP+/GFP- ratios in the analyzed mature immune cell lineages: T cells, natural killer (NK) cells, B cells, Gr-1 (granulocyte), and myeloid cells (CD11b+) isolated from bone marrow and spleen of mice transplanted with the indicated sgRNA-infected HSPCs.
Fig. 5
Fig. 5. TFDP1 and E2F4 regulate HSPC proliferation, but not apoptosis.
A Scheme of assessment of HSPC proliferation and apoptosis. Cas9-HSPCs were labeled with Celltrace, cultured for one day and transduced with lentiviral particles expressing sgRNAs targeting Tfdp1, E2f4, or the Rosa26. B Representative FACS analysis of the percentages of Annexin V+DAPI- (early) and Annexin V+DAPI+ (late) apoptotic cells within mCherry- (sgRNA-, upper panel) or mCherry+ (sgRNA+, lower panel) HSPCs treated with the indicated sgRNAs. C Representative FACS analysis of active Caspase 3+ apoptotic HSPCs treated with the indicated sgRNAs three days post puromycin selection (top) and summary of the data (bottom) based on HSPCs from three mice (n = 3). D Representative FACS analysis of the proliferation rates of mCherry- (sgRNA-) and mCherry+ (sgRNA+) HSPCs infected with the indicated sgRNAs two and four days post cell-trace labeling. The number of cell divisions is indicated. E Percentage of cell division in mCherry+ (upper) and mCherry- (below) HSPC subpopulations treated with the indicated sgRNAs on day two and day four post cell-trace labeling (n = 3 independent experiments).
Fig. 6
Fig. 6. Transcriptional regulation of TFDP1 in HSPCs.
A Experimental scheme of the RNA-seq experiment in Tfdp1-KO HSPCs. As a negative control, sgRosa26 was used. B Volcano plot depicting changes in gene expression in Tfdp1-KO HSPCs; y-axis represents the log10 transformation of the adjusted p value and x-axis the log2 transformation of the fold change. Red and blue dots represent up and downregulated genes, respectively. REACTOME pathway (C) and transcription factor enrichment analysis (D) of the downregulated genes in Tfdp1-KO HSPCs. The bubble plots depict the top 10 most significantly enriched gene sets. The bubble size corresponds to the number of genes and the color intensity reflects the adj. p value for each geneset. The total number of genes found within each dataset and the number of genes present in the downregulated genes are shown on the right.
Fig. 7
Fig. 7. Meta-analysis of the role of TFDP1 and E2F4 in gene activation in mouse HSPCs.
A Venn diagrams depicting the overlap between the differentially expressed genes in Tfdp1-KO HSPCs (downregulated genes in blue and upregulated genes in red) and human TFDP1- (left; GSE80661; GSE105217; GSE127368), human E2F4- (middle; GSE31477; GSE170651), and mouse E2F4- (right; GSE48666) bound target genes. B Intersection between human TFDP1- and E2F4-bound genes downregulated in Tfdp1-KO HSPCs. C Density plots (upper panel) and heatmaps (lower panel) depicting the average tag densities around TSSs (−2/+2 kb) of up- and downregulated genes in Tfdp1 KO HSPCs. Data are derived from the ChIP-seq of RNA polymerase II S5P (RnapolII S5P; GSE34518), H3K4Me3 (GSE75426), and E2F4 (GSE48666) (together with a negative control) in mouse ES cells. Right panel: ATAC-seq signals (GSE100738) from mouse short-term (ST) HSCs in the same genomic regions. D Example of RnapolII S5P, H3K4Me3, E2F4 tracks in mouse ES cells and ATAC-seq in ST-HSCs at the mouse Cdk1 locus. E Example of E2F4 and TFDP1 ChIP-seq signals at the CDK1 locus in various human cell types. Mouse and human E2F4 and TFDP1 DNA binding sites derived from the Unibind database are shown and the core nucleotides involved in DNA binding are highlighted.

References

    1. Spangrude GJ, Heimfeld S, Weissman IL. Purification and characterization of mouse hematopoietic stem cells. Science. 1988;241:58–62. 10.1126/science.2898810 - DOI - PubMed
    1. Hofer T, Rodewald HR. Differentiation-based model of hematopoietic stem cell functions and lineage pathways. Blood. 2018;132:1106–13. 10.1182/blood-2018-03-791517 - DOI - PMC - PubMed
    1. Kohli S, Ahuja S, Rani V. Transcription factors in heart: promising therapeutic targets in cardiac hypertrophy. Curr Cardiol Rev. 2011;7:262–71. 10.2174/157340311799960618 - DOI - PMC - PubMed
    1. Merchant A, Joseph G, Wang Q, Brennan S, Matsui W. Gli1 regulates the proliferation and differentiation of HSCs and myeloid progenitors. Blood. 2010;115:2391–6. 10.1182/blood-2009-09-241703 - DOI - PMC - PubMed
    1. Beauchemin H, Moroy T. Multifaceted actions of GFI1 and GFI1B in hematopoietic stem cell self-renewal and lineage commitment. Front Genet. 2020;11:591099. 10.3389/fgene.2020.591099 - DOI - PMC - PubMed

LinkOut - more resources