. 2024 Aug;41(8):1631-1648.
doi: 10.1007/s11095-024-03743-w. Epub 2024 Jul 24.

Iron Reduces the Trafficking of Fatty Acids from Human Immortalised Brain Microvascular Endothelial Cells Through Modulation of Fatty Acid Transport Protein 1 (FATP1/SLC27A1)

Affiliations

Iron Reduces the Trafficking of Fatty Acids from Human Immortalised Brain Microvascular Endothelial Cells Through Modulation of Fatty Acid Transport Protein 1 (FATP1/SLC27A1)

Showmika T Supti et al. Pharm Res. 2024 Aug.

Abstract

Purpose: Alzheimer's disease (AD) is associated with brain accumulation of amyloid-beta (Aβ) and neurofibrillary tangle formation, in addition to reduced brain docosahexaenoic acid (DHA) and increased brain iron levels. DHA requires access across the blood-brain barrier (BBB) to enter the brain, and iron has been shown to affect the expression and function of a number of BBB transporters. Therefore, this study aimed to assess the effect of iron on the expression and function of fatty acid binding protein 5 (FABP5) and fatty acid transport protein 1 (FATP1), both which mediate brain endothelial cell trafficking of DHA.

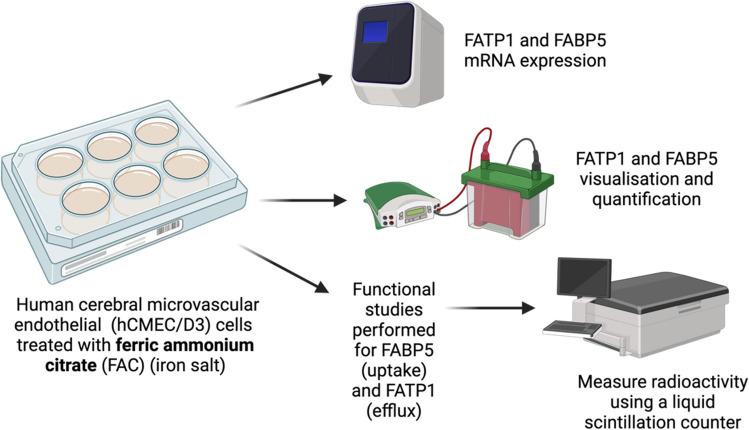
Methods: The mRNA and protein levels of FABP5 and FATP1 in human cerebral microvascular endothelial (hCMEC/D3) cells was assessed by RT-qPCR and Western blot, respectively following ferric ammonium citrate (FAC) treatment (up to 750 µM, 72 h). The function of FABP5 and FATP1 was assessed via uptake and efflux of radiolabelled 3H-oleic acid and 14C-DHA.

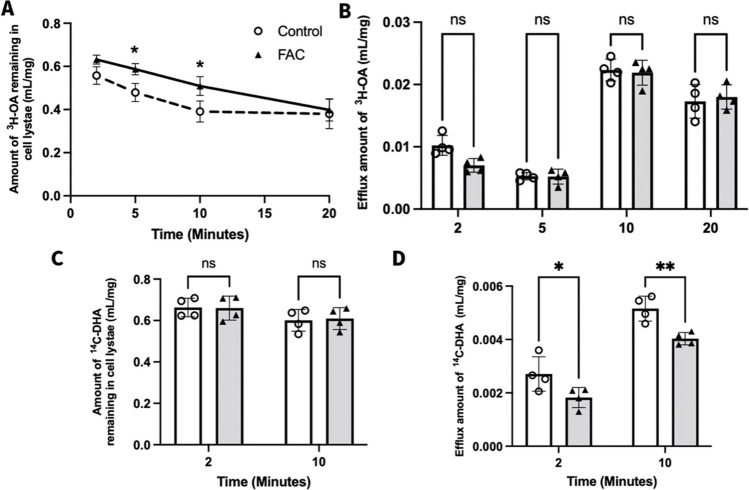
Results: FAC (500 µM, 72 h) had no impact on the expression of FABP5 at the protein and mRNA level in hCMEC/D3 cells, which was associated with a lack of effect on the uptake of 14C-DHA. FAC led to a 19.7% reduction in FATP1 protein abundance in hCMEC/D3 cells with no impact on mRNA levels, and this was associated with up to a 32.6% reduction in efflux of 14C-DHA.

Conclusions: These studies demonstrate a role of iron in down-regulating FATP1 protein abundance and function at the BBB, which may have implications on fatty acid access to the brain.

Keywords: blood-brain barrier; docosahexaenoic acid; fatty acid binding protein 5; fatty acid transport protein 1; iron.


Figures

Fig. 1
Fig. 1
The schematic diagram illustrates the workflow for studying the expression and quantification of FATP1 and FABP5 using key steps that include mRNA expression analysis by RT-qPCR, protein visualisation and quantification by western blotting and functional studies (uptake and efflux studies) using radioactive 3H-OA and 14C-DHA
Fig. 2
Fig. 2
hCMEC/D3 cell viability assay when treated with vehicle, 125 to 2000 µM FAC and 10% (v/v) DMSO (as positive control) over 72 h. Data are presented as mean ± SD (n = 3, independent cell culture preparations). ***p < 0.001 and ****p < 0.0001, using a one-way ANOVA and a post-hoc Dunnett’s test where the mean of every treatment was compared to the control mean
Fig. 3
Fig. 3
(A) A representative western blot demonstrating FABP5 protein abundance in hCMEC/D3 cells treated with vehicle (control) or FAC (500 μM) for 72 h. (B) Mean fold-change in FABP5 (15 kDa) protein expression normalised to the housekeeping protein β-actin (47 kDa) in hCMEC/D3 cells treated with vehicle (control; open circles) or FAC (500 μM; filled upward-triangles) for 24 h, 48 h, and 72 h. Data are presented as mean ± SD (n = 4, independent cell culture preparations), p > 0.05 (non-significant, ns), using a two-way ANOVA test and a post-hoc Šídák's test between control and FAC-treated cells. (C) Mean fold-change in FABP5 (15 kDa) protein expression normalised to the housekeeping protein β-actin (47 kDa) in hCMEC/D3 cells treated with vehicle (control; open circles) or FAC (750 μM, 72 h; closed upward-triangles). Data are presented as mean ± SD (n = 4, independent cell culture preparations), p > 0.05 (non-significant, ns), using a two-tailed Student’s t-test between control and FAC-treated cells. (D) A representative western blot demonstrating FABP5 protein abundance in hCMEC/D3 cells treated with vehicle (control) or pioglitazone (25 μM, 72 h). (E) Mean fold-change in FABP5 (15 kDa) protein expression normalised to the housekeeping protein β-actin (47 kDa) in hCMEC/D3 cells treated with vehicle (control; open circles) or pioglitazone (25 μM; closed squares) for 72 h. Data are presented as mean ± SD (n = 8, independent cell culture preparations), ***p < 0.001, using a two-tailed Student’s t-test between control and pioglitazone-treated cells
Fig. 4
Fig. 4
2−ΔΔCt represents the fold-change in FABP5 mRNA transcript levels (normalised to housekeeping genes (GAPDH and β-actin) in RNA isolated from hCMEC/D3 cells treated with vehicle (control; open circles) or FAC (500 μM; closed upward-triangles) for (A) 24 h, (B) 48 h, or (C) 72 h. Data are presented as mean ± SD (n = 4, independent cell culture preparations), p > 0.05 (non-significant, ns), using a two-tailed Student’s t-test between control and FAC-treated cells
Fig. 5
Fig. 5
Cellular uptake of (A) 3H-OA (mL/mg) and (B) 14C-DHA (mL/mg) in hCMEC/D3 cells, treated with vehicle (control; open circles) or FAC (500 μM; closed upward-triangles) for 72 h. (C) Cellular uptake of 3H-OA (mL/mg) into hCMEC/D3 cells treated with vehicle (control; open circles) or pioglitazone (25 μM; closed squares) for 72 h. Data are presented as mean ± SD (n = 4, independent cell culture preparations), *p < 0.05 and p > 0.05 (non-significant, ns), using a two-tailed Student’s t-test between control and treated cells
Fig. 6
Fig. 6
(A) A representative western blot demonstrating FATP1 protein abundance in hCMEC/D3 cells treated with vehicle (control) or FAC (500 μM) for 72 h. (B) Mean fold-change in FATP1 (71 kDa) protein abundance normalised to the housekeeping protein β-actin (47 kDa) in hCMEC/D3 cells treated with vehicle (control; open circles) or FAC (500 μM; closed upward-triangles) for 72 h. Data are presented as mean ± SD (n = 8, independent cell culture preparations), ***p < 0.001, using a two-tailed Student’s t-test between control and FAC-treated cells
Fig. 7
Fig. 7
Cellular efflux of 3H-OA (mL/mg) and 14C-DHA (mL/mg) from hCMEC/D3 cells treated with vehicle (control; open circles) or FAC (500 μM; closed upward-triangles) for 72 h. (A) Amount of 3H-OA remaining in hCMEC/D3 cell lysate at 2, 5, 10 and 20 min, (B) amount of 3H-OA detected in the efflux buffer, (C) amount of 14C- DHA remaining in hCMEC/D3 cell lysate at 2 and 10 min, and (D) amount of 14C- DHA detected in the efflux buffer. Data are presented as mean ± SD (n = 4, independent cell culture preparations), *p < 0.05, **p < 0.01 and p > 0.05 (non-significant, ns), using a two-way ANOVA test and a post-hoc Šídák's test between control and FAC-treated cells
Fig. 8
Fig. 8
(A) 2-ΔΔCt represents the fold-change in FATP1 mRNA transcript levels (normalised to housekeeping gene GAPDH) in mRNA isolated from hCMEC/D3 cells treated with scrambled siRNA (control; open circles) or siRNA against FATP1 (50 nM; closed squares) for 72 h. Data are presented as mean ± SD (n = 4, independent cell culture preparations), ***p < 0.001 using a two-tailed Student’s t-test between control and siRNA-treated cells. (B) A representative western blot demonstrating FATP1 protein abundance in hCMEC/D3 cells treated with scrambled siRNA (control) or siRNA against FATP1 (50 nM) for 72 h. (C) Mean fold-change in FATP1 (71 kDa) protein abundance normalised to the housekeeping protein β-actin (47 kDa) in hCMEC/D3 cells treated with scrambled siRNA (control; open circles) or siRNA against FATP1 (50 nM; closed squares) for 72 h. Data are presented as mean ± SD (n = 4, independent cell culture preparations), *p < 0.05, using a one-tailed Student’s t-test between control and siRNA-treated cells. Cellular efflux after 10 min of efflux phase in hCMEC/D3 cells treated with (control; open circles) or siRNA against FATP1 (50 nM; closed squares) for 72 h with (D) 3H-OA remaining in cell lysate, (E) 3H-OA in efflux buffer, (F) 14C-DHA remaining in cell lysate, and (G) 14C-DHA in efflux buffer. Data are presented as mean ± SD (n = 4, independent cell culture preparations), **p < 0.01, *p < 0.05 and p > 0.05 (non-significant, ns), using a two-tailed Student’s t-test between control and siRNA-treated cells
Fig. 9
Fig. 9
Amount of 3H-OA remaining in cell lysate following cellular efflux of 3H-OA (mL/mg) in hCMEC/D3 cells treated with vehicle (control; open circles) or FAC (500 μM; closed squares), FATP1 siRNA (50 nM; closed upward-triangles) or combination of FAC and FATP1 siRNA (500 μM and 50 nM; closed downward-triangles) for 72 h. Data are presented as mean ± SD (n = 4, independent cell culture preparations), *p < 0.05, **p < 0.01 and p > 0.05 (non-significant, ns), using a one-way ANOVA test and a post-hoc Tukey's test where mean of every treatment was compared to all other groups
Fig. 10
Fig. 10
2-ΔΔCt represents the fold-change in FATP1 mRNA transcript levels (normalised to housekeeping genes GAPDH and β-actin) in RNA isolated from hCMEC/D3 cells after vehicle (control; open circles) or FAC (500 μM; closed upward-triangles) treatment for (A) 12 h, (B) 24 h, (C) 48 h, and (D) 72 h Data are presented as mean ± SD (n = 4, independent cell culture preparations), p > 0.05 (non-significant, ns), using a two-tailed Student’s t-test between control and FAC-treated cells
Fig. 11
Fig. 11
hCMEC/D3 cell viability assay following treatment with vehicle (control), 10 to 50 mM SP concentrations and 10% (v/v) DMSO (positive control) over 72 h. Data are presented as mean ± SD (n = 3, independent cell culture preparations). **p < 0.01 and ****p < 0.0001, using a one-way ANOVA and a post-hoc Dunnett’s test where the mean of every treatment was compared to the control mean
Fig. 12
Fig. 12
ROS levels in hCMEC/D3 cells following treatment with vehicle (control; open-circles), FAC (500 μM; closed squares), SP (15 mM; closed upward-triangles) and FAC in conjunction with SP (500 μM and 15 mM; closed downward-triangles) for 72 h. Data are presented as mean ± SD (n = 4, independent cell culture preparations), ***p < 0.001, **p < 0.01 and p > 0.05 (non-significant, ns), using a using a one-way ANOVA and a post-hoc Tukey’s test where the mean of every treatment was compared to all other groups
Fig. 13
Fig. 13
(A) A representative western blot demonstrating FATP1 protein in hCMEC/D3 cells treated with vehicle (control), FAC (500 μM), NAC (10 mM) or FAC in combination with NAC (500 μM and 10 mM) for 72 h and (B) mean fold-change in FATP1 (71 kDa) protein abundance normalised to the housekeeping protein β-actin (47 kDa) in hCMEC/D3 cells treated with vehicle (control; open-circles), FAC (500 μM; closed squares), NAC (10 mM; closed upward-triangles) or FAC in combination with NAC (500 μM and 10 mM; closed diamonds) for 72 h. Data are presented as mean ± SD (n = 4, independent cell culture preparations), *p < 0.05 and p > 0.05 (non-significant, ns), using a one-way ANOVA and a post-hoc Dunnett’s test where the mean of every treatment was compared to the control mean

References

    1. Söderberg M, Edlund C, Kristensson K, Dallner G. Fatty acid composition of brain phospholipids in aging and in Alzheimer’s disease. Lipids. 1991;26(6):421–5. 10.1007/BF02536067 - DOI - PubMed
    1. Lukiw WJ, Cui J-G, Marcheselli VL, Bodker M, Botkjaer A, Gotlinger K, et al. A role for docosahexaenoic acid–derived neuroprotectin D1 in neural cell survival and Alzheimer disease. J Clin Investig. 2005;115(10):2774–83. 10.1172/JCI25420 - DOI - PMC - PubMed
    1. Nakada T, Kwee IL, Ellis WG. Membrane fatty acid composition shows delta-6-desaturase abnormalities in Alzheimer’s disease. NeuroReport. 1990;1(2):153–5. 10.1097/00001756-199010000-00018 - DOI - PubMed
    1. Corrigan FM, Horrobin DF, Skinner ER, Besson JA, Cooper MB. Abnormal content of n-6 and n-3 long-chain unsaturated fatty acids in the phosphoglycerides and cholesterol esters of parahippocampal cortex from Alzheimer’s disease patients and its relationship to acetyl CoA content. Int J Biochem Cell Biol. 1998;30(2):197–207. 10.1016/S1357-2725(97)00125-8 - DOI - PubMed
    1. Prasad MR, Lovell MA, Yatin M, Dhillon H, Markesbery WR. Regional membrane phospholipid alterations in Alzheimer’s disease. Neurochem Res. 1998;23(1):81–8. 10.1023/A:1022457605436 - DOI - PubMed

MeSH terms

LinkOut - more resources