. 2024 Jul 23;24(1):721.
doi: 10.1186/s12879-024-09526-3.

Mapping the evidence about the natural history of acute infections commonly seen in primary care and managed with antibiotics: a scoping review

Affiliations

Mapping the evidence about the natural history of acute infections commonly seen in primary care and managed with antibiotics: a scoping review

Kwame Peprah Boaitey et al. BMC Infect Dis. .

Abstract

Background: Knowing the natural history of acute infections in primary care, defined as the course of a disease over time in the absence of specific therapy or treatment, can inform clinicians' and patients' expectations about illness recovery, but this evidence is fragmented across the literature. This scoping review aimed to map existing research and research gaps relevant to the natural history of acute infections.

Methods: We searched MEDLINE, Embase and CENTRAL using a 2-phase hierarchical search approach. In Phase A, we focused on identifying systematic reviews synthesising natural history data for eligible infections (acute respiratory, urinary, and skin and soft tissue) and systematic reviews of treatment effectiveness (of RCTs with placebo or no treatment arm, or cohort studies). For infections without existing reviews, in Phase B, we searched for primary studies (placebo-controlled RCTs or cohort studies). Two reviewers independently screened and extracted the data (study characteristics, outcome data - e.g., symptom duration, proportion with resolution at various time points).

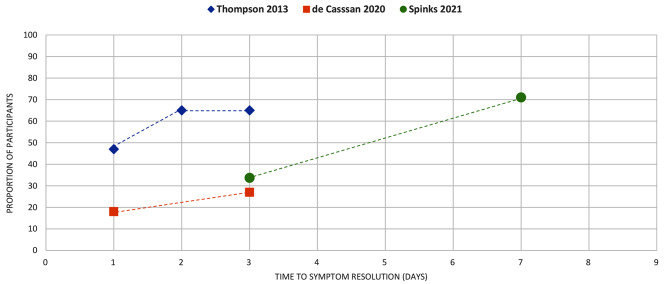
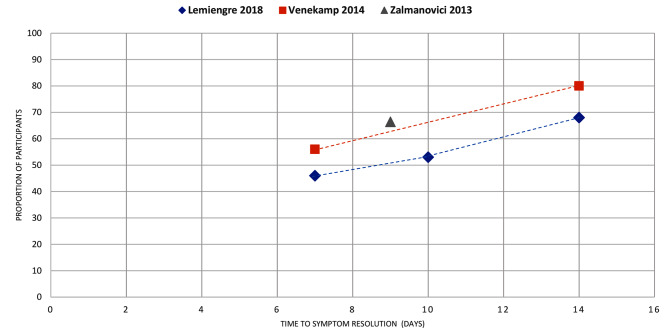
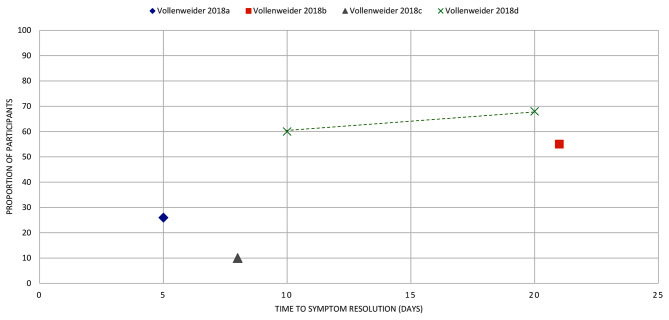
Results: We identified 40 systematic reviews, reporting on 45 infections, most commonly (90%) respiratory tract infections. Six (15%) of these aimed to synthesise natural history information. Most reviews reported the proportion of participants with symptom resolution at various time point/s, with 58% providing data on mean symptom duration. Recovery data show the spontaneous resolution of some infections in some people. We found no eligible studies for cellulitis, ecthyma, carbuncle, and erysipelas.

Conclusions: Our review has shown that natural history evidence exists for many common acute infections. It can be utilised by clinicians in implementing patient-centred antibiotic stewardship strategies in primary care. Future research should focus on generating natural history evidence for skin and soft tissue infections and urinary tract infections.

Keywords: Acute infections; Antibiotic stewardship; Natural history; Primary care; Respiratory tract infections.


Conflict of interest statement

The authors declare no competing interests.

Figures

Fig. 1
Fig. 1
PRISMA diagram. 1Records identified from a previously published systematic review: 2Conditions with no identified reviews: cellulitis, ecthyma, carbuncle, and erysipelas. RCT: Randomised controlled trials
Fig. 2
Fig. 2
Evidence map of reviews containing natural history information about acute infections. OME: Acute otitis media with effusion, UTI: Urinary tract infection. X-axis: Systematic reviews identified for each condition; Y-axis: The number of eligible primary studies reported in each systematic review with a placebo or no treatment arm for randomised controlled trails. The bubble size reflects the number of studies included in the identified reviews that contributed natural history information. Thompson 2013*a, b, c, d, e, and f is a review reporting multiple respiratory tract conditions (a*= common cold, b*=cough, c*=sore throat, d*= otitis media, e*= bronchiolitis, and f*= croup), Rosenfeld 2003a^, and b^ included both otitis media and otitis media with effusion, respectively
Fig. 3
Fig. 3
The mean duration of symptoms (unless otherwise specified) of the various conditions as reported in the systematic reviews. UTI: Urinary tract infection (uncomplicated), SSTI: Skin and Soft Tissue Infection 1Science 2021: Outcome data calculated from pooled analysis of data presented for both adult and children. 2Thompson 2013: This review reported data for multiple respiratory infections (reported separately). Outcomes were reported as the time point for when 90% of participants recovered from symptoms. 3Hayward 2015: Outcome data reported as the time-lapse to symptom resolution. 4Smith 2017: Outcome calculated from pooled analysis (Analysis 4.1; 6 studies, 1162 participants). The outcome was reported as the mean number of days of cough. 5Fahay 1998: Outcome reported from the final day of clinical assessment. 6Outcome data reported narratively. Duration reported from physician outcome measure with complication. *Median duration of symptoms
Fig. 4
Fig. 4
COMMON COLD: the proportion of participants with symptom resolution at various time points. De Sutter 2015*: The outcome data were reported as improvements in symptoms score. We calculated the proportions from the forest plots. Kenealy 2013~: The outcome data were reported as proportion of participants with persistent symptoms, which we used to calculate the proportion with symptoms resolution. The review reported outcome data on days 1-7. We assumed the median point for the time to symptom resolution. Science 2012^: We calculated the proportion of participants with symptoms resolution from the number of participants with symptoms (pooled analysis, 17 studies, 858 participants)
Fig. 5
Fig. 5
COUGH: the proportion of participants with symptom resolution at various time points. De Sutter 2015*: The outcome data were reported as improvements in symptoms score. We calculated the proportions from the forest plots. Kenealy 2013~: The outcome data were reported as proportion of participants with persistent symptoms, which we used to calculate the proportion with symptoms resolution. The review reported outcome data on days 1-7. We assumed the median point for the time to symptom resolution.Science 2012^: We calculated the proportion of participants with symptoms resolution from the number of participants with symptoms (pooled analysis, 17 studies, 858 participants). Bergmann 2021: We plotted the proportion of participants with clinical improvement (4 studies, 1016 participants). Ebell 2013: Outcome data were calculated by subtracting the percentage of participants with cough to attain the number of participants symptom resolution. Smith 2017: The time point for proportion without symptoms is assumed from the trial with the largest sample size in the review (Little 2013). Outcome data were calculated from the pooled analysis (11 studies, 1277 participants). Wagner 2015: We used the timepoint from one trial (Kammerich 2017), which is the only included study that provided a timepoint for assessment. Outcome data were calculated from the pooled analysis (2 studies, 395 participants). Speich 2018*: Patients with subacute cough, outcome data reported by one study (Ponsioen 2005)
Fig. 6
Fig. 6
SORE THROAT: the proportion of participants with symptom resolution at various time points. Thompson 2013: The review reported the proportion of participants who were symptomatic at the specified time point. We calculated the outcome from the proportion with symptoms. de Cassan 2020: The proportion of participants with complete resolution of pain. Spinks 2021: The outcome data at day 3 was reported as the proportion of participants with symptoms, which was used to calculate the proportion of participants with symptom resolution
Fig. 7
Fig. 7
ACUTE OTITIS MEDIA: the proportion of participants with symptom resolution at various time points
Fig. 8
Fig. 8
OTITIS MEDIA WITH EFFUSION: the proportion of participants with symptom resolution at various time points. Griffin 2011: Plotted data represents placebo participants from the RCT of antihistamine + decongestant combination in the review. Refer to Supplementary Table V for further details. Rosenfeld 2003*a: participants with untreated otitis media with effusion; Rosenfeld 2003*b: otitis media with effusion of unknown duration. Venekamp 2016: As reported in the review, only 52% of placebo participants received a true placebo, others received treatment of unproven efficacy (this was not clearly defined in the review)
Fig. 9
Fig. 9
ACUTE SINUSITIS: the proportion of participants with symptom resolution at various time points. Griffin 2011: Plotted data represents placebo participants from the RCT of antihistamine + decongestant combination in the review. Refer to Supplementary Table V for further details. Rosenfeld 2003*a: participants with untreated otitis media with effusion; Rosenfeld 2003*b: otitis media with effusion of unknown duration. Venekamp 2016: As reported in the review, only 52% of placebo participants received a true placebo, others received treatment of unproven efficacy (this was not clearly defined in the review). Lemiengre 2018: Outcome data as reported (pooled analysis, 11 studies, 603 participants). Venekamp 2014: Outcome data as reported (narratively, 1 study, 86 participants). Zalmanovici 2013: Outcome data as reported (pooled analysis, 3 studies, 624 participants). We used the median time to clinical success reported in one study (Dolor 2001) for the datapoint
Fig. 10
Fig. 10
CONJUNCTIVITIS: the proportion of participants with symptom resolution at various time points (in days). Sheikh 2012*: Outcome data for clinical remission. Sheikh 2012^: Outcome data for biological remission
Fig. 11
Fig. 11
BRONCHIOLITIS: the proportion of participants with symptom resolution at various time points. Gadomski 2014: We used the pooled mean duration as the time point to resolution of symptoms. Thompson 2013: The proportion of participants symptom free at day 21 was an estimated proportion reported narratively in the review
Fig. 12
Fig. 12
LARYNGITIS: the proportion of participants with symptom resolution at various time points. Outcome data represent data from placebo participants of fusafungine + clarithromycin combination. The review reported additional data for fusafungine alone + placebo and Erythromycin alone + placebo in the review. Refer to Supplementary Table V for further details
Fig. 13
Fig. 13
OTITIS EXTERNA: the proportion of participants with symptom resolution at various time points. Kaushik 2010: Outcome data as reported narratively (20 participants). Rosenfeld 2006: Outcome data calculated (pooled analysis, 2 studies, 46 participants)
Fig. 14
Fig. 14
ACUTE EXACERBATION OF COPD: the proportion of participants with symptom resolution at various time points. Vollenweider 2008a, b, c, d represents reported data from individual studies extracted from the review. (a): data from Allegra 1991, (b): Anthonisen 1987, (c): Jorgensen 1992, (d): Llor 2012
Fig. 15
Fig. 15
ACUTE RHINITIS: the proportion of participants with symptom resolution at various time points. Segboer 2019 a, b, c, d represents reported data from individual studies extracted from the review. (a): data from Day 1990, (b): Tuekeltaub 1982, (c): Schulz 1978, (d): Lundblad 2001
Fig. 16
Fig. 16
UNCOMPLICATED SKIN ABSCESS: the proportion of participants with symptom resolution at various time points after incision and drainage. Bowen 2017a, b, c, d represents reported data from individual studies narratively presented in the review. Wang 2018: Data reported as treatment failure, which was used to calculate the proportion of participants with symptom resolution (8 trials, 1121 participants)

References

    1. World Health Organisation. Global action plan on antimicrobial resistance. 2015. 2015 [cited 2023 28 Aug]. https://www.who.int/publications/i/item/9789241509763.
    1. Goossens H, Ferech M, Vander Stichele R, Elseviers M, Group EP. Outpatient antibiotic use in Europe and association with resistance: a cross-national database study. Lancet (London England). 2005;365(9459):579–87. 10.1016/S0140-6736(05)17907-0 - DOI - PubMed
    1. Lee GC, Reveles KR, Attridge RT, Lawson KA, Mansi IA, Lewis JS, et al. Outpatient antibiotic prescribing in the United States: 2000 to 2010. BMC Med. 2014;12:96. 10.1186/1741-7015-12-96 - DOI - PMC - PubMed
    1. Ventola CL. The Antibiotic Resistance Crisis. Pharm Ther. 2015;40(4):277–83. - PMC - PubMed
    1. McCullough AR, Pollack AJ, Hansen MP, Glasziou PP, Looke DF, Britt HC, et al. Antibiotics for acute respiratory infections in general practice: comparison of prescribing rates with guideline recommendations. Med J Aust. 2017;207(2):65–9. 10.5694/mja16.01042 - DOI - PubMed

Publication types

MeSH terms

Substances

LinkOut - more resources