

Palm kernel meal regulates the expression of genes involved in the amino acid metabolism in the liver of Tibetan sheep
- PMID: 39044234
- PMCID: PMC11264444
- DOI: 10.1186/s12917-024-04193-7
Palm kernel meal regulates the expression of genes involved in the amino acid metabolism in the liver of Tibetan sheep
Abstract
Background: Palm kernel meal (PKM) is a by-product of oil palm kernel after oil extraction, which is widely used in animal feeds due to its high energy content. This study aimed to investigate the impact of supplementing Tibetan sheep with PKM on their hepatic phenotype, oxidative stress and immune response. A total of 120 Tibetan lambs (Initial weight = 12.37 ± 0.92 kg) were randomly assigned into four groups: control group (C group, 0% PKM diet), low group (L group, 15% PKM diet), middle group (M group, 18% PKM diet), and high group (H group, 21% PKM diet) on a dry matter basis. The feeding experiment was performed for 130 d, including a 10 d adaption period.
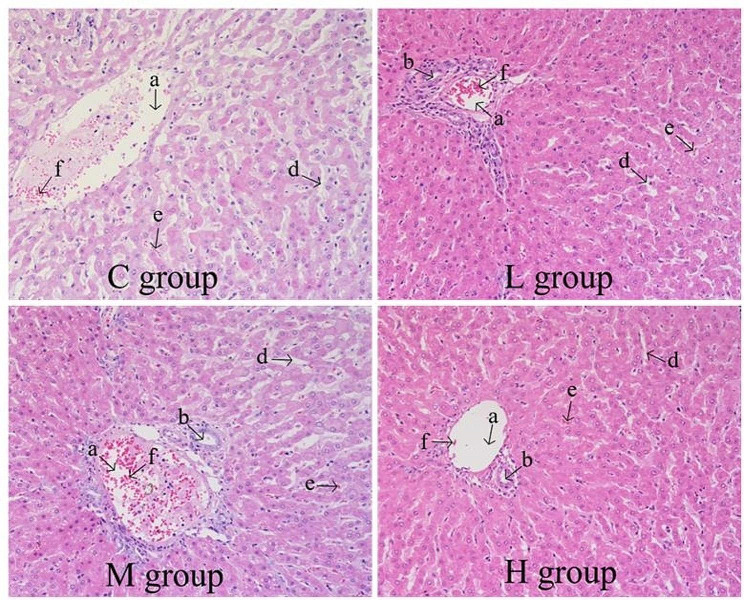
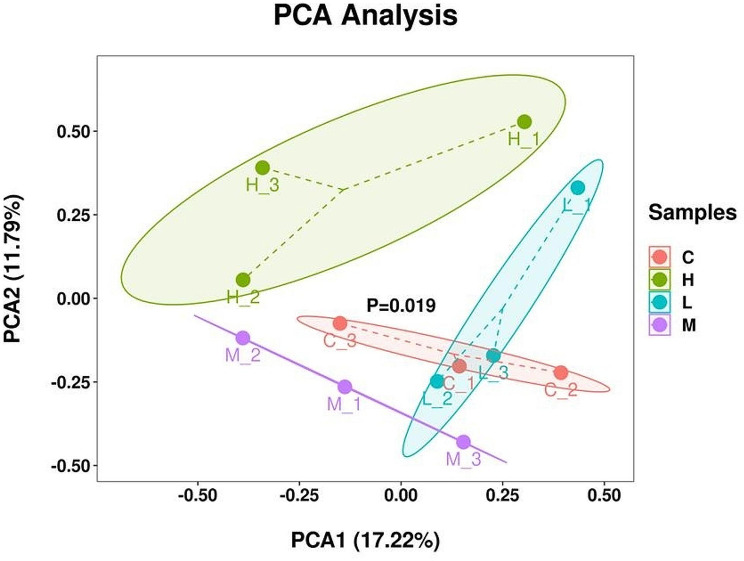
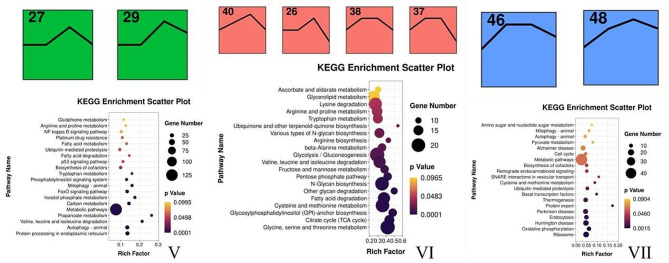
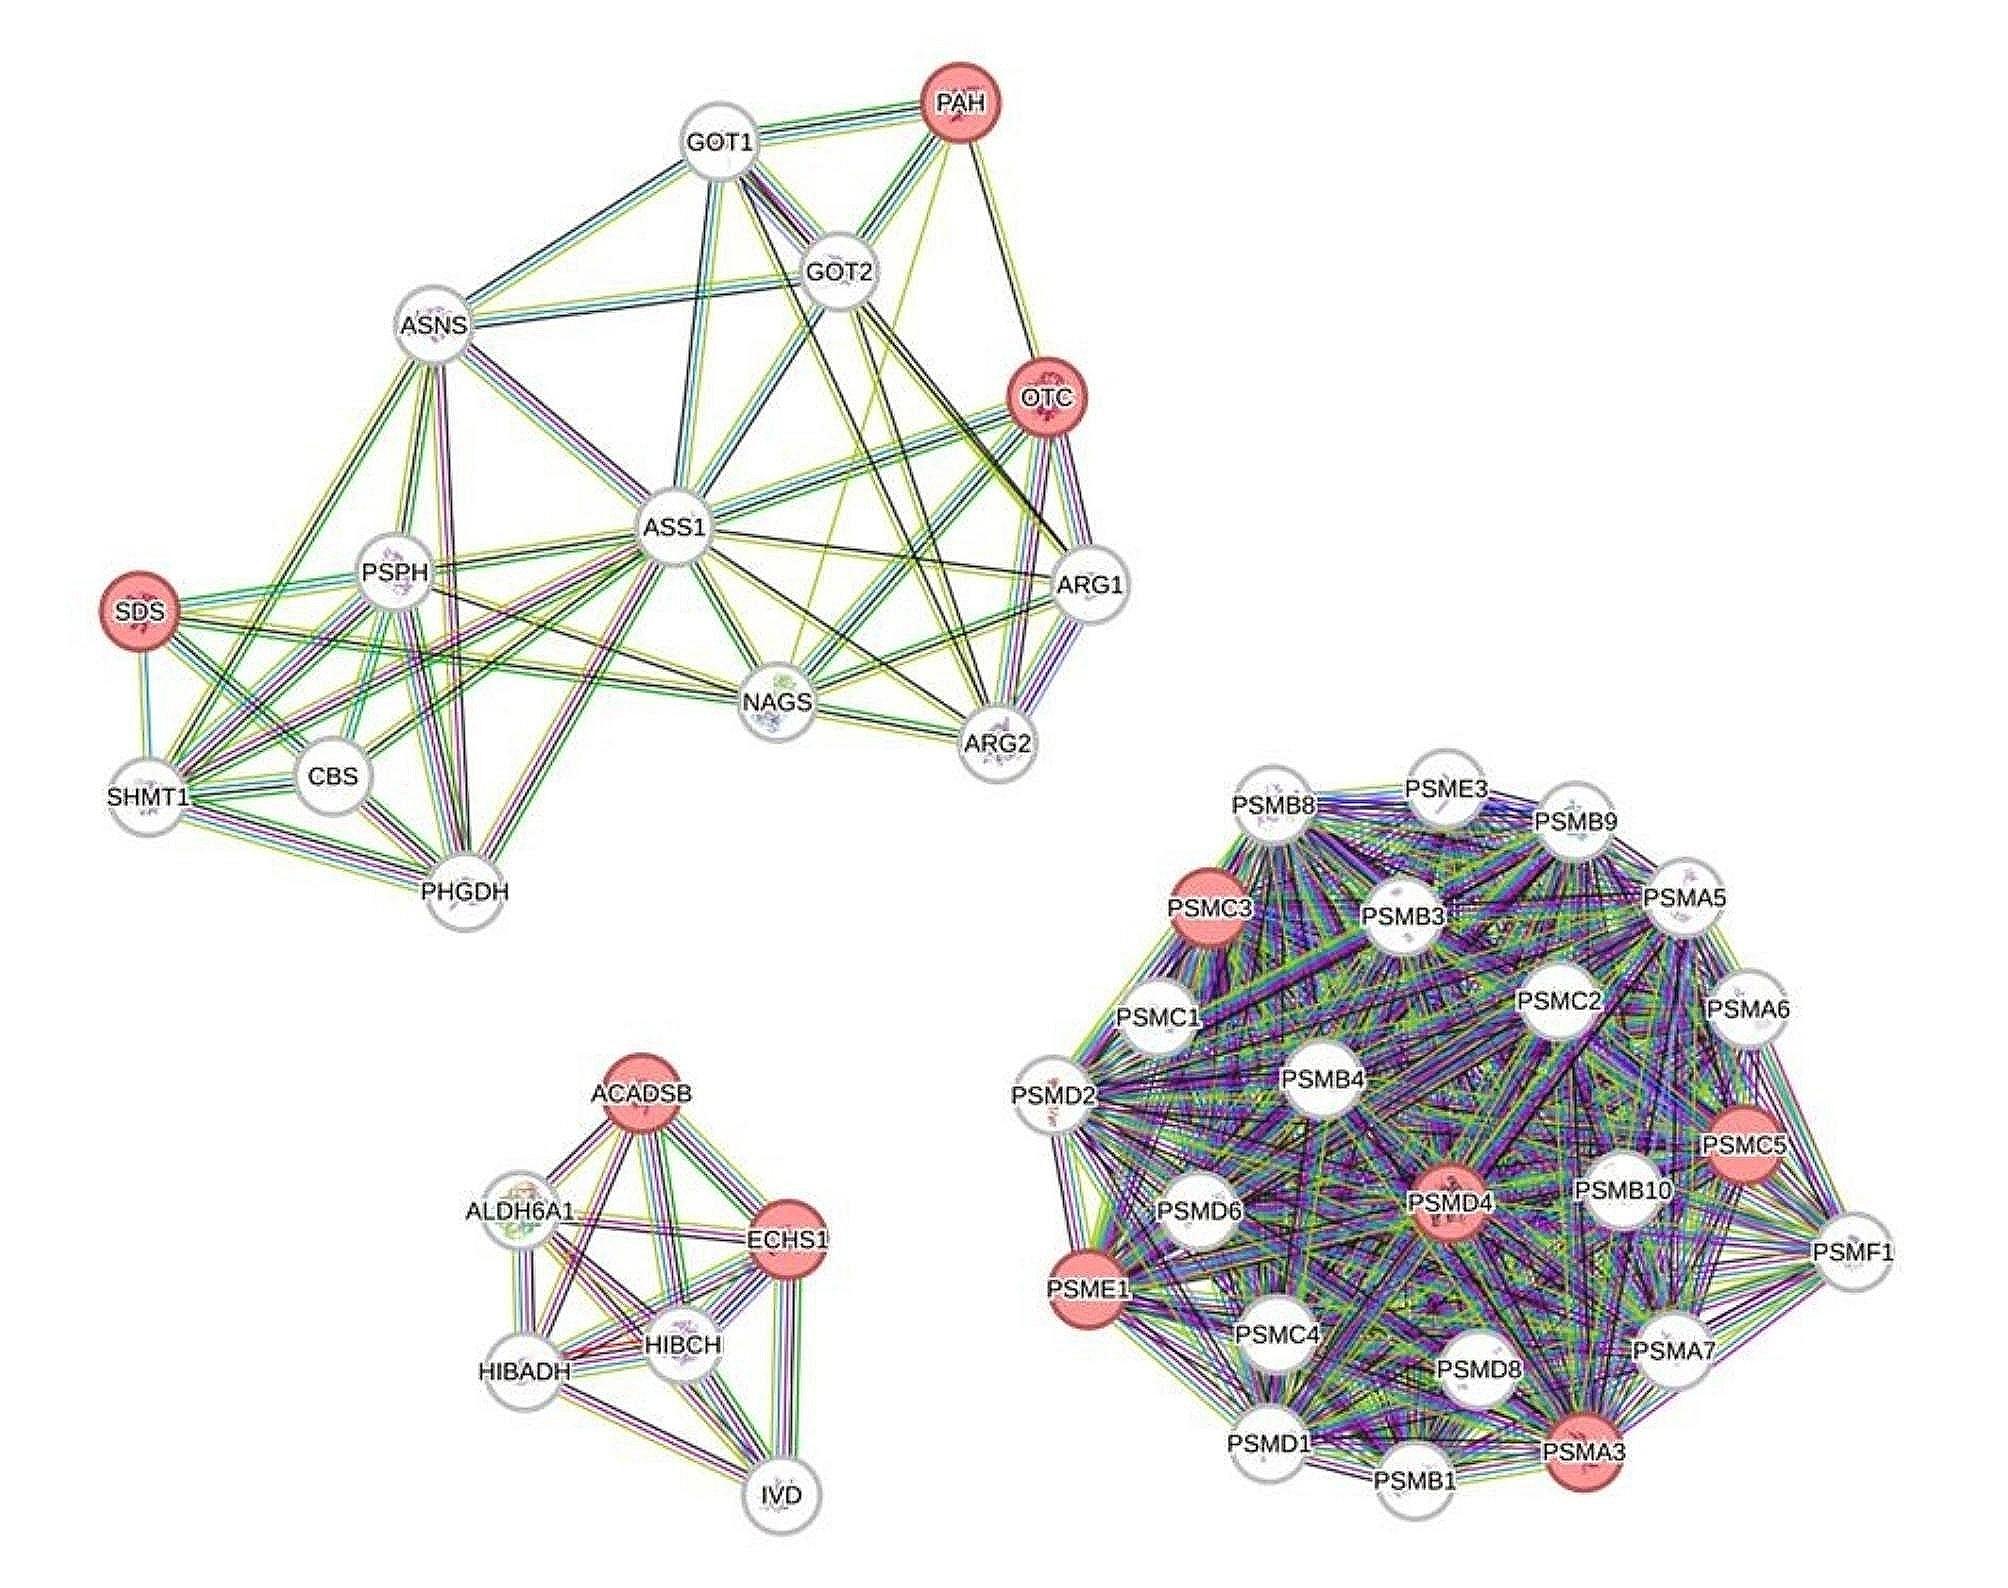
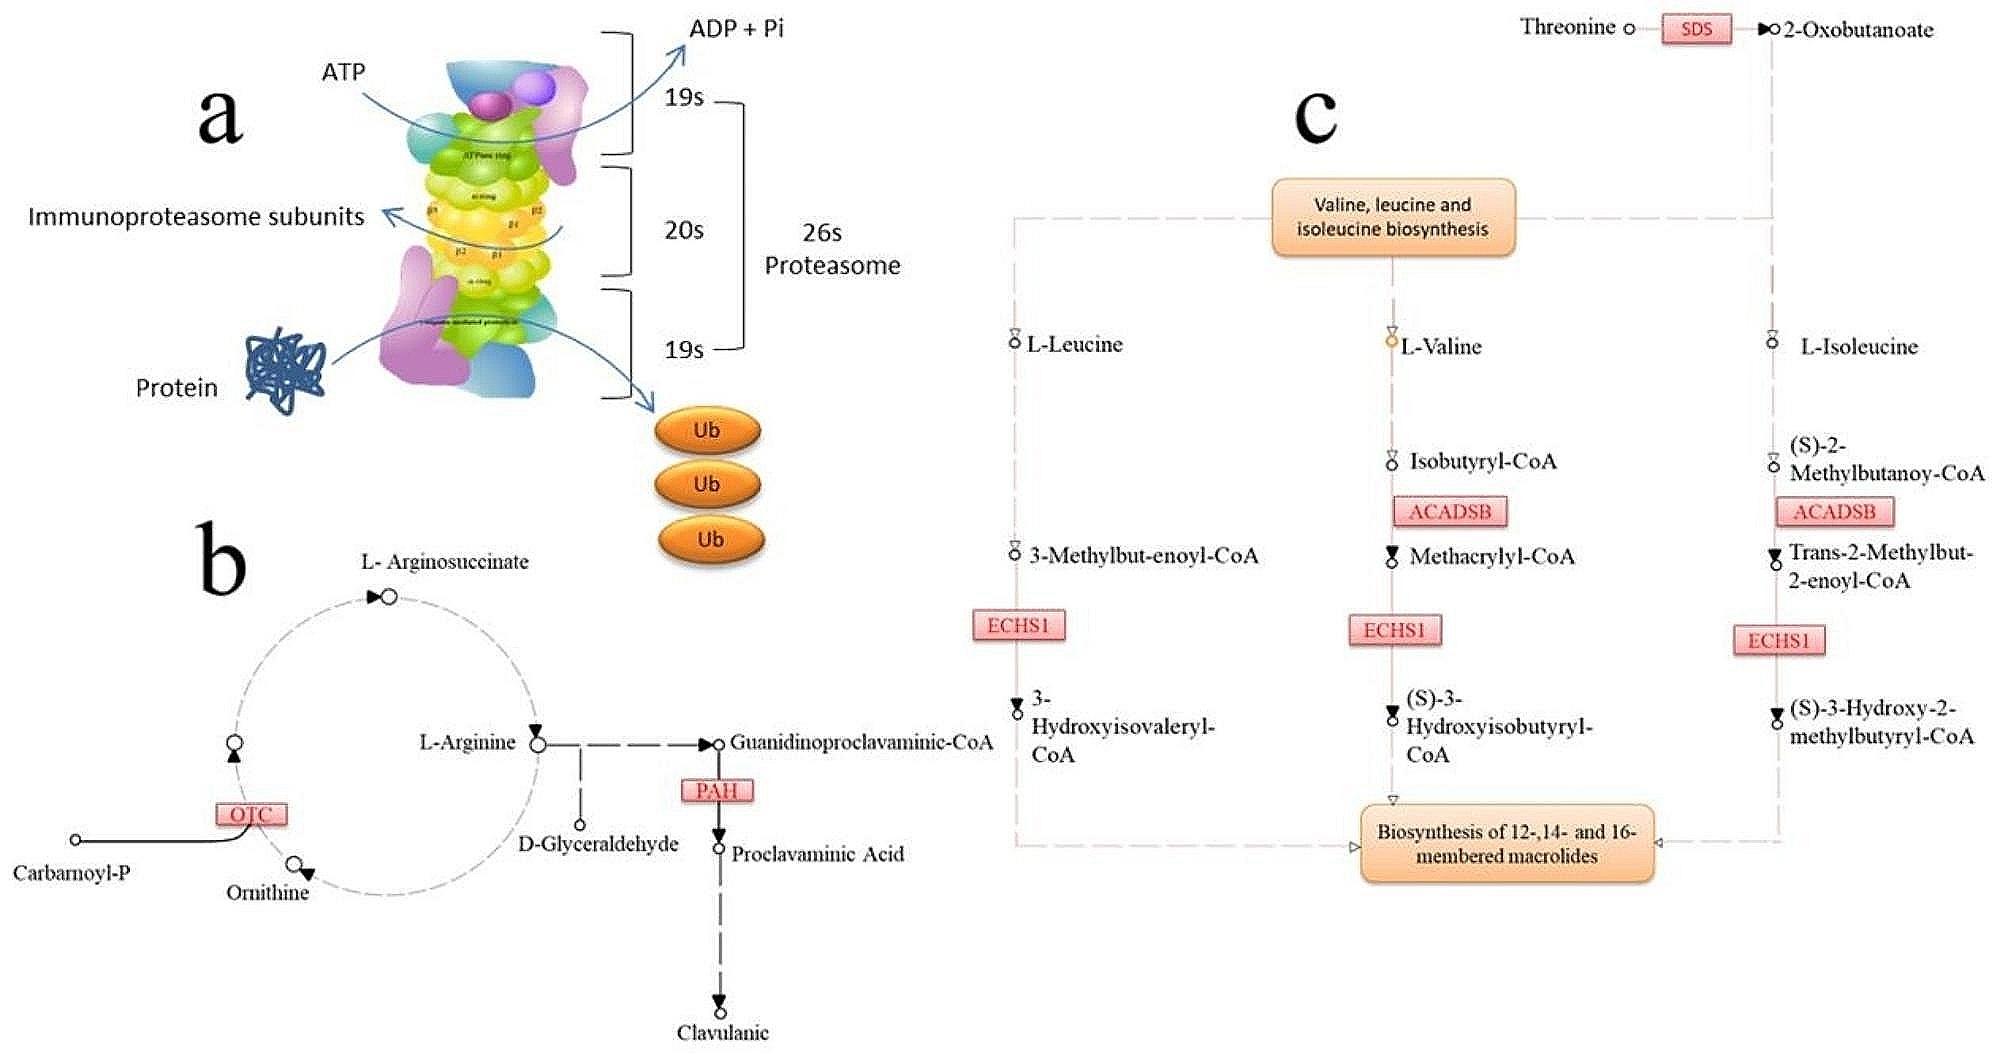
Results: Results showed that the level of GSH-Px were higher in the H and M groups than in the C and L groups (P < 0.05). The levels of IgM and TNF-α were higher in the M group when compared to those on the C group (P < 0.05). The level of IgA was significantly higher in the M group than in the H group (P < 0.05). Additionally, compared with the others groups, the hepatocytes in the M group displayed a radial arrangement, forming hepatic plates that were centered around the central vein. The transcriptome results revealed that proteasome 26 S subunit, ATPase 3 (PSMC3), proteasome 26 S subunit, ATPase 5 (PSMC5), proteasome 26 S subunit ubiquitin receptor, non-ATPase 4 (PSMD4), proteasome activator subunit 1 (PSME1), acyl-CoA dehydrogenase short/branched chain (ACADSB), enoyl-CoA hydratase, short chain 1 (ECHS1), serine dehydratase (SDS), ornithine transcarbamylase (OTC), and phenylalanine hydroxylase (PAH) were the hub genes regulating the amino acid metabolism in the liver.
Conclusions: In summary, dietary 18% PMK supplementation contributed to improve the hepatic phenotype, oxidative stress and immune response through regulating the expression of related genes.
Keywords: Liver; Nutrient; Palm kernel meal; Tibetan sheep; Transcriptome.
© 2024. The Author(s).
Conflict of interest statement
The authors declare no competing interests.
Figures


References
-
- Oluwafemi RA. Production performance of crossbred dairy cows fed palm kernel cake in feedlots. SEMIN-CIENC AGRAR. 2018;39(5):2103–12.10.5433/1679-0359.2018v39n5p2103 - DOI
-
- Zain M, Rahman J. Khasrad. Effect of Palm Oil by products on in Vitro Fermentation and Nutrient Digestibility. Anim Nutr Feed Techn. 2012;14(1):175–81.
MeSH terms
Substances
Grants and funding
- (2022-NK-169)/The current work was funded by Construction of Standardized Production System for Improving quality and efficiency of Tibetan sheep industry (2022-NK-169).
- (2022-NK-169)/The current work was funded by Construction of Standardized Production System for Improving quality and efficiency of Tibetan sheep industry (2022-NK-169).
- (2022-NK-169)/The current work was funded by Construction of Standardized Production System for Improving quality and efficiency of Tibetan sheep industry (2022-NK-169).
- (2022-NK-169)/The current work was funded by Construction of Standardized Production System for Improving quality and efficiency of Tibetan sheep industry (2022-NK-169).
- (2022-NK-169)/The current work was funded by Construction of Standardized Production System for Improving quality and efficiency of Tibetan sheep industry (2022-NK-169).
- (2022-NK-169)/The current work was funded by Construction of Standardized Production System for Improving quality and efficiency of Tibetan sheep industry (2022-NK-169).
- (2022-NK-169)/The current work was funded by Construction of Standardized Production System for Improving quality and efficiency of Tibetan sheep industry (2022-NK-169).
- (2022-NK-169)/The current work was funded by Construction of Standardized Production System for Improving quality and efficiency of Tibetan sheep industry (2022-NK-169).
LinkOut - more resources
Full Text Sources
Miscellaneous
